Microsoft Statistics By Revenue, Product Line, Software Spending and Gaming Revenue

Updated · Mar 10, 2025


TABLE OF CONTENTS
- Introduction
- Editor’s Choice
- What is Microsoft?
- General Microsoft Statistics
- Microsoft’s Income Statement Statistics
- Most Valuable Technology Brands
- Microsoft’s Revenue Statistics by Product Line
- Microsoft Statistics by Revenue
- Revenue Statistics by Microsoft Productivity and Business Processes Segment
- Microsoft Statistics by Software Spending
- Microsoft Statistics by Gaming Revenue
- The Top Microsoft Apps Statistics by Downloads
- Microsoft Patent Portfolio Statistics
- Microsoft’s Recent Outage
- Microsoft Website Statistics by Top Countries
- Microsoft’s Financial Strength
- Products and Users
- Employment and Innovation
- Interesting Tidbits: What’s New in 2024?
- Looking Ahead: What’s Next for Microsoft?
- Conclusion
Introduction
Microsoft Statistics: Microsoft is one of the world’s biggest technology companies, known for products like Windows, Office, and Azure. It has millions of users worldwide and plays a major role in software, cloud computing, and artificial intelligence. The company constantly grows, with high revenue and a strong customer base. Microsoft’s market value is in the trillions, making it one of the most valuable companies.
It also invests in innovation, security, and sustainability. With services like Xbox and LinkedIn, Microsoft reaches different industries. The company’s statistics show steady growth, strong profits, and a major impact on global technology. Its success comes from continuous improvements and adapting to new trends in the digital world.
Editor’s Choice
- Microsoft reported over USD 245 billion in revenue for fiscal year 2024, a 16% increase over the previous year.
- During the same period, the company generated over USD 109 billion in operating income, reflecting a 24% year-over-year growth.
- Microsoft Statistics represented that as of December 31, 2024, Microsoft’s market capitalization stood at approximately USD 3.134 trillion.
- For the quarter ending September 30, 2024, Microsoft reported revenue of USD 65.6 billion, a 16% increase driven by growth across all segments.
- In the second quarter of fiscal year 2025, the company reported revenue of USD 56.5 billion and a gross margin increase of USD 5.4 billion, or 13%, driven by growth across each of its segments.
- This segment generated approximately USD 29.4 billion in the second quarter of fiscal year 2025.
- In Q2 FY2025, Microsoft returned USD 9.7 billion to shareholders through dividends and share repurchases.
- The company plans to invest around USD 80 billion in artificial intelligence by 2025.
- Azure and other cloud services revenue grew by 31% in the second quarter of fiscal year 2025.
- As of the end of fiscal year 2024, Microsoft employed approximately 228,000 people worldwide.
You May Also Like To Read
- Xiaomi Statistics
- Lenovo Statistics
- Asus Statistics
- Toshiba Statistics
- Intel Statistics
- Dell Statistics
- HP (Hewlett-Packard) Statistics
- Philips Statistics
- Apple Statistics
- Google Statistics
- Sony Statistics
- Airbnb Statistics
- Google Revenue Statistics
- Amazon Statistics
- Tencent Statistics
What is Microsoft?
Microsoft, originally Microsoft, was founded by Bill Gates and Paul Allen and launched on April 4, 1975. The company is headquartered at One Microsoft Way, Redmond, Washington, in the United States of America.
The products of Microsoft are:
- Computer hardware
- Software development
- Internet
- Cloud computing
- Social networking service
- Video games
- Consumer electronics
The Services of Microsoft are:
- Microsoft 365
- Azure
- Bing
- OneDrive
- com
- GitHub
- Microsoft Store
- Windows Update
- Xbox Game Pass
- Xbox network
- Yammer
General Microsoft Statistics
- Microsoft is the 3rd largest gaming company globally.
- Around 550,000 Dragon medical users use DAX Express, amplified and enhanced by Microsoft Azure and GPT-4, respectively.
- In Microsoft Azure, the total number of leading services offered is 41,000 products and services, of which around 8,256 services belong to the IT and management tools category.
- On January 18, 2023, the partnership between OpenAI and Microsoft was extended.
- During the same period, on February 7, the company overhauled Edge and Bing with AI.
- On May 23, Microsoft launched Windows Copilot.
- As of February 2024, Xbox 360 is Microsoft’s bestselling video game console, with 86 million units shipped.
- Another shipment unit of Xbox Series X and S resulted in 27.7 million.
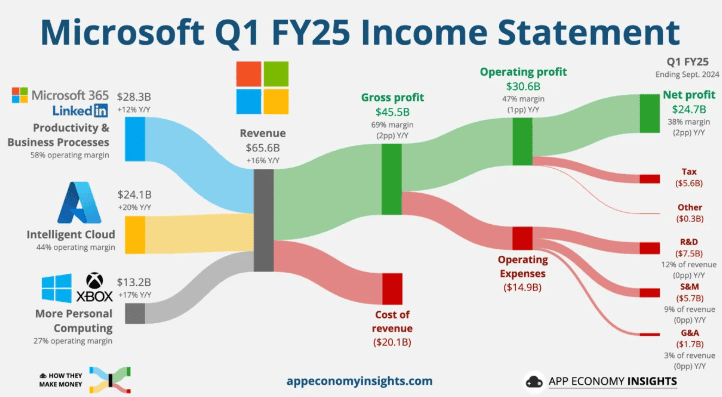
Microsoft’s Income Statement Statistics
 (Source: swipeinsight.app)
- Revenue: Totaled USD 65.6 billion, a 16% increase from USD 56.5 billion in the same period the previous year.
- Cost of Revenue: Increased by 23% to USD 20.1 billion, up from USD 16.3 billion in the prior year.
- Gross Margin: Rose 13% to USD 45.5 billion, compared to USD 40.2 billion in the previous year.
- Operating Expenses: Totaled USD 14.9 billion, a 12% increase from USD 13.3 billion in the same quarter last year.
- Operating Income: Grew 14% to USD 30.6 billion, up from USD 26.9 billion in the previous year.
- Net Income: Reached USD 24.7 billion, a 13% increase from USD 22.3 billion in the same period last year.
- Earnings Per Share (EPS): Diluted EPS was USD 3.30, up from USD 2.99 in the prior year.
- Intelligent Cloud Revenue: Increased by 20% to USD 24.1 billion, driven by Azure and other cloud services.
- Productivity and Business Processes Revenue: Rose 12% to USD 28.3 billion, with growth in Office Commercial and LinkedIn.
- More Personal Computing Revenue: Increased by 17% to USD 13.2 billion, driven by a 61% rise in Xbox content and services revenue.
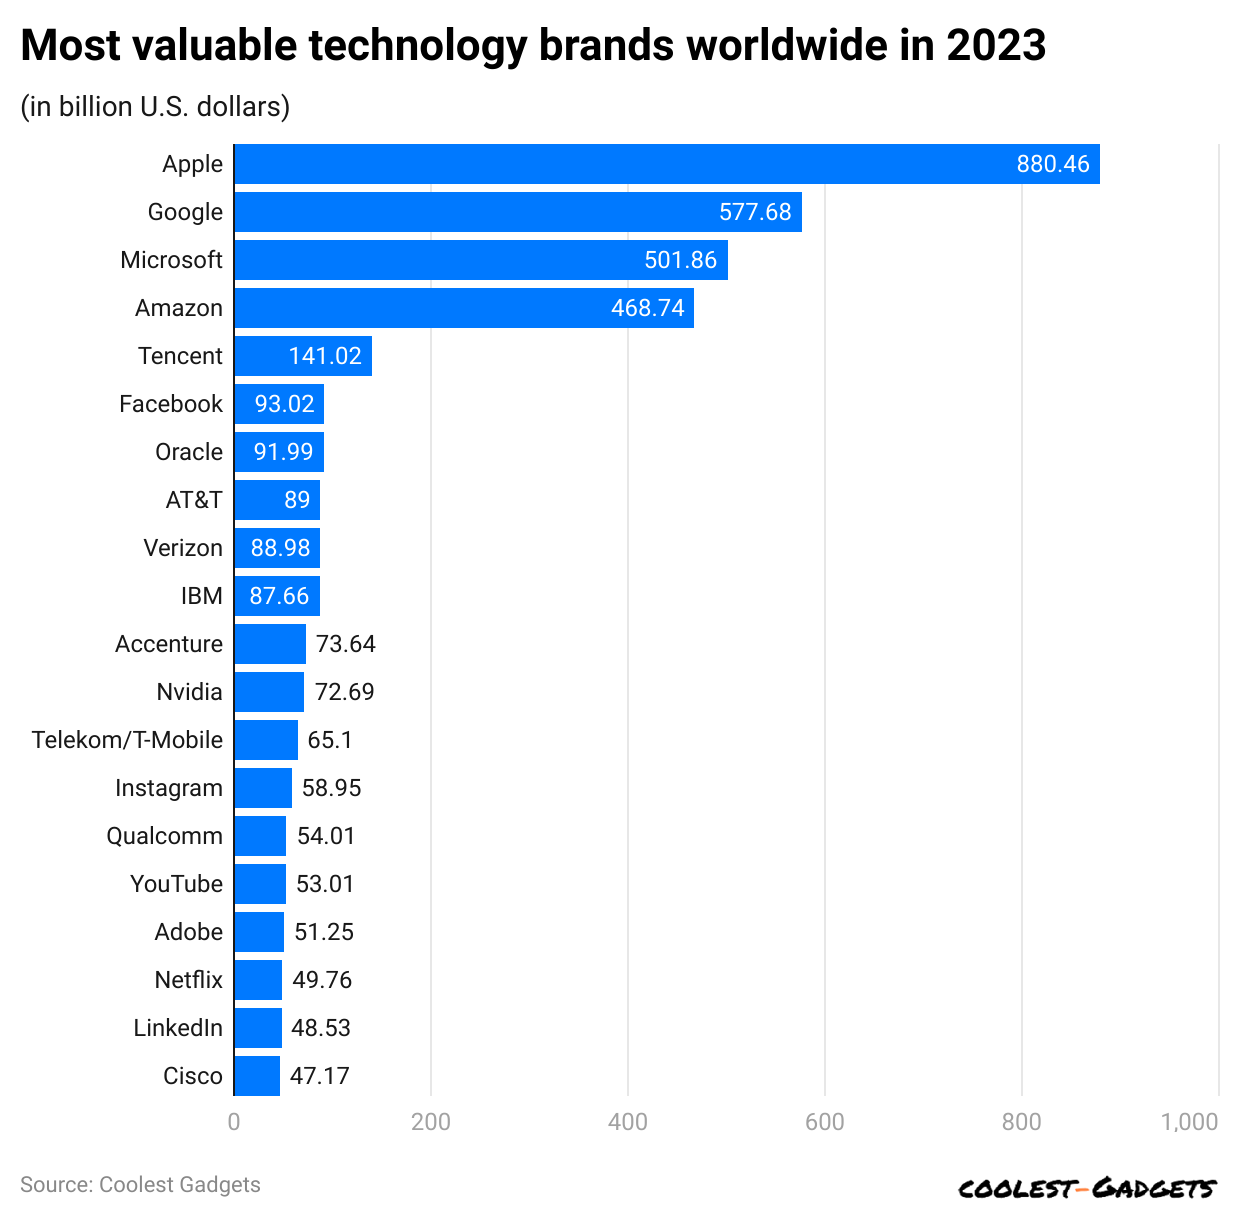
Most Valuable Technology Brands
Apple maintained its position as the world’s most valuable company, reaching a market capitalisation of approximately USD 3.8 trillion by the end of 2024.
During the same duration, other companies’ market valuations were Nvidia (USD 3.28 trillion), Microsoft (USD 3.1 trillion), Alphabet: Google’s parent company (USD 2.3 trillion), and Amazon (USD 2.3 trillion).
(Reference: statista.com)
- As of 2023, the top three valuable technology brands share are Apple (USD 880.46 billion), Google (USD 577.68 billion), and Microsoft (USD 501.86 billion).
- Moreover, other market shares of valuable technology brands are followed by Amazon (USD 468.74 billion), Tencent (USD 141.02 billion), Facebook (USD 93.02 billion), Oracle (USD 91.99 billion), AT&T (USD 89 billion), Verizon (USD 88.98 billion), IBM (USD 87.66 billion), Accenture (USD 73.64 billion), Nvidia (USD 72.69 billion), Telekom/T-Mobile (USD 65.1 billion), Instagram (USD 58.95 billion), Qualcomm (USD 54.01 billion), YouTube (USD 53.01 billion), Adobe (USD 51.25 billion), Netflix (USD 49.76 billion), LinkedIn (USD 48.53 billion), and Cisco (USD 47.17 billion).
Microsoft’s Revenue Statistics by Product Line
 (Source: statista.com)
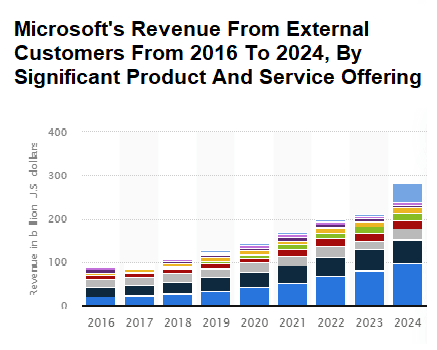
- In fiscal year 2024, Microsoft’s Server Products and Cloud Services generated approximately USD 97 billion, making them the largest contributors to Microsoft’s revenue.
- Office Products and Cloud Services: Accounted for nearly USD 55 billion in revenue.
- Intelligent Cloud Segment: Brought in about USD 105 billion, reflecting the growing demand for cloud solutions.
- Productivity and Business Processes Segment: Contributed USD 77 billion to the total revenue.
- Windows: Generated USD 22 billion, reflecting the continued demand for Microsoft’s operating systems.
- Gaming: Achieved USD 21.5 billion in revenue, driven by Xbox content and services.
- LinkedIn: Contributed USD 15 billion, indicating its strong position in the professional networking space.
- Search Advertising: Accounted for USD 12 billion, showcasing growth in Microsoft’s advertising efforts.
- Devices: Generated USD 15 billion, reflecting sales from hardware products like Surface devices.
(Source: voronoiapp.com)
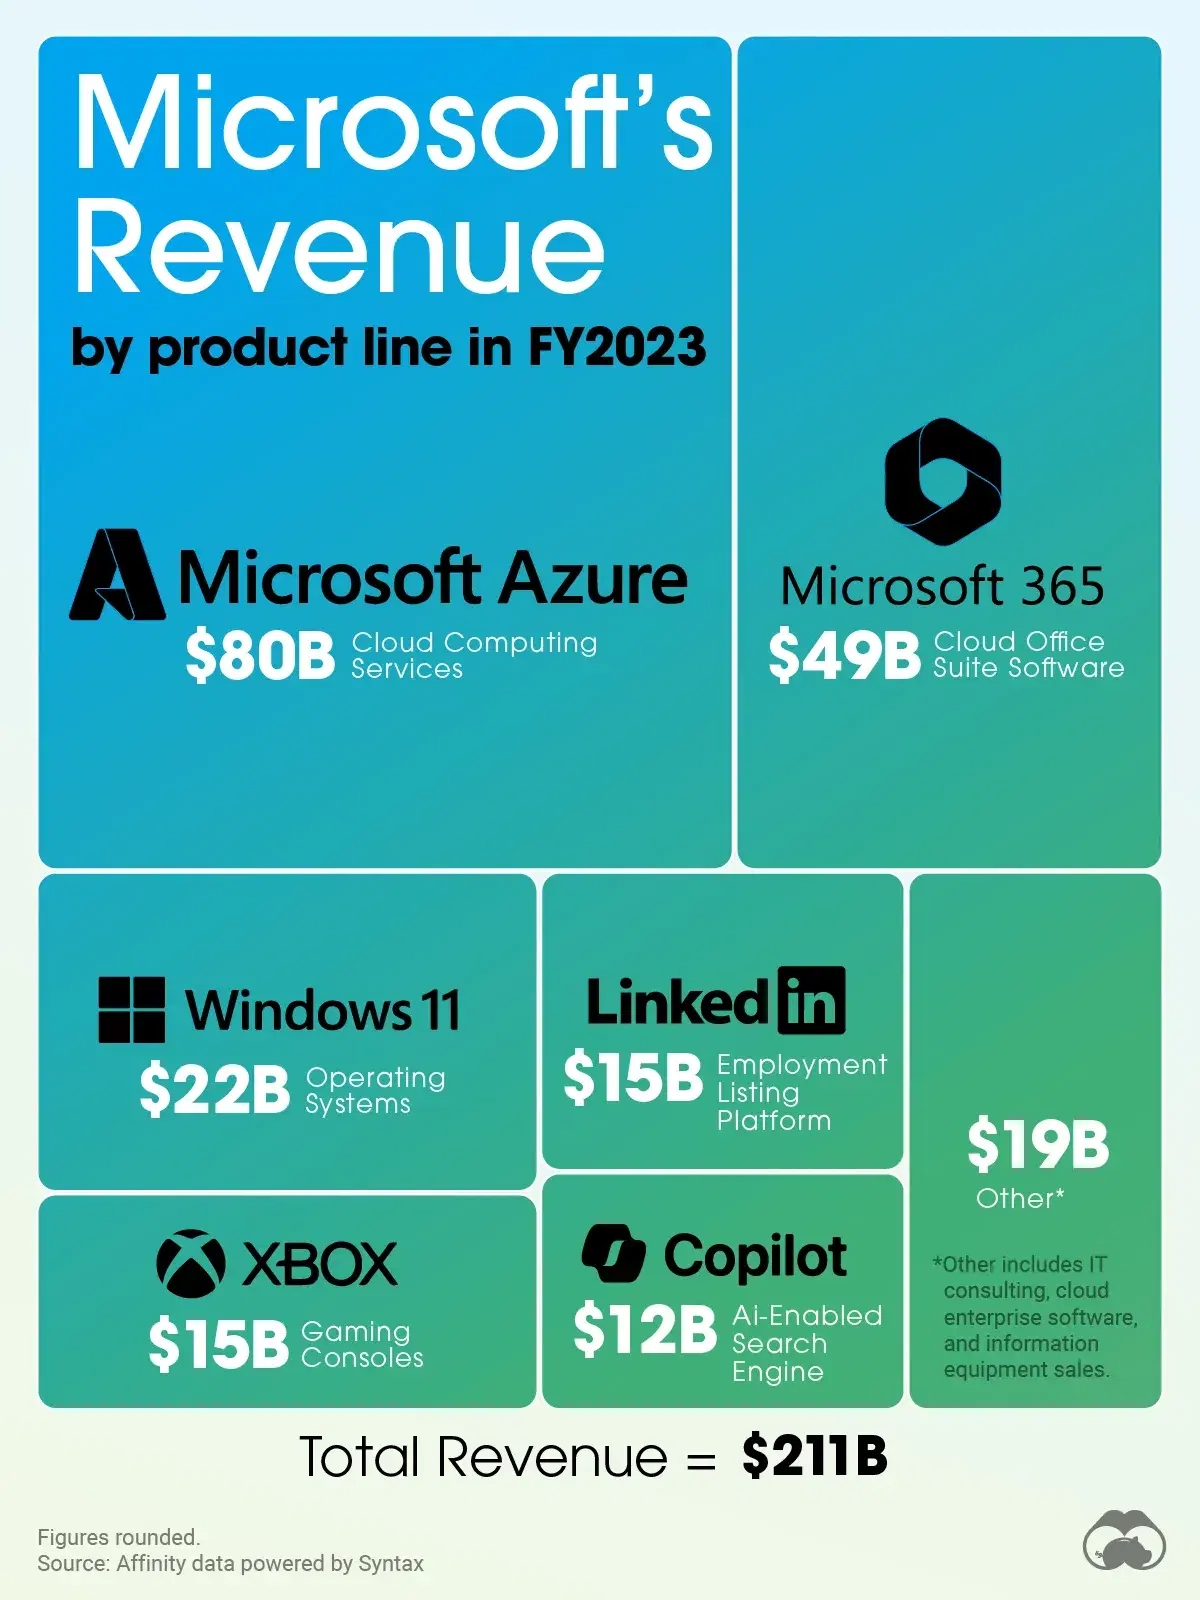
- In FY 2023, Microsoft’s revenue record was USD 211 billion, an increase of 6.88% year over year.
- Furthermore, in the same year, Microsoft Azure (cloud computing services) generated USD 80 billion in revenue, and Microsoft 365 (cloud office suite software) generated USD 49 billion.
Other product line’s revenue and share in 2023 are described below:
- Windows 11 (Operating Systems): USD 22 billion and 10%
- XBOX (Gaming Consoles): USD 15 billion and 7%
- LinkedIn (Employment Listing Platform): USD 15 billion and 7%
- Copilot (AI-Enabled Search Engine): USD 12 billion and 6%
- Others: USD 19 billion and 9%
Microsoft Statistics by Revenue
(Reference: statista.com)
- Microsoft’s revenue in the first quarter of 2023 was USD 50.12 billion, followed by the second quarter (USD 52.75 billion), the third quarter (USD 52.88 billion), and the fourth quarter (USD 56.19 billion).
- In FY 2024, revenue generated in Q1 was USD 56.52 billion.
- The expected revenue accounted for in the 2nd quarter and 3rd quarter of 2024 will be USD 62.02 billion and USD 61.9 billion, respectively.
By Gross Profit
 (Reference: macrotrends.net)
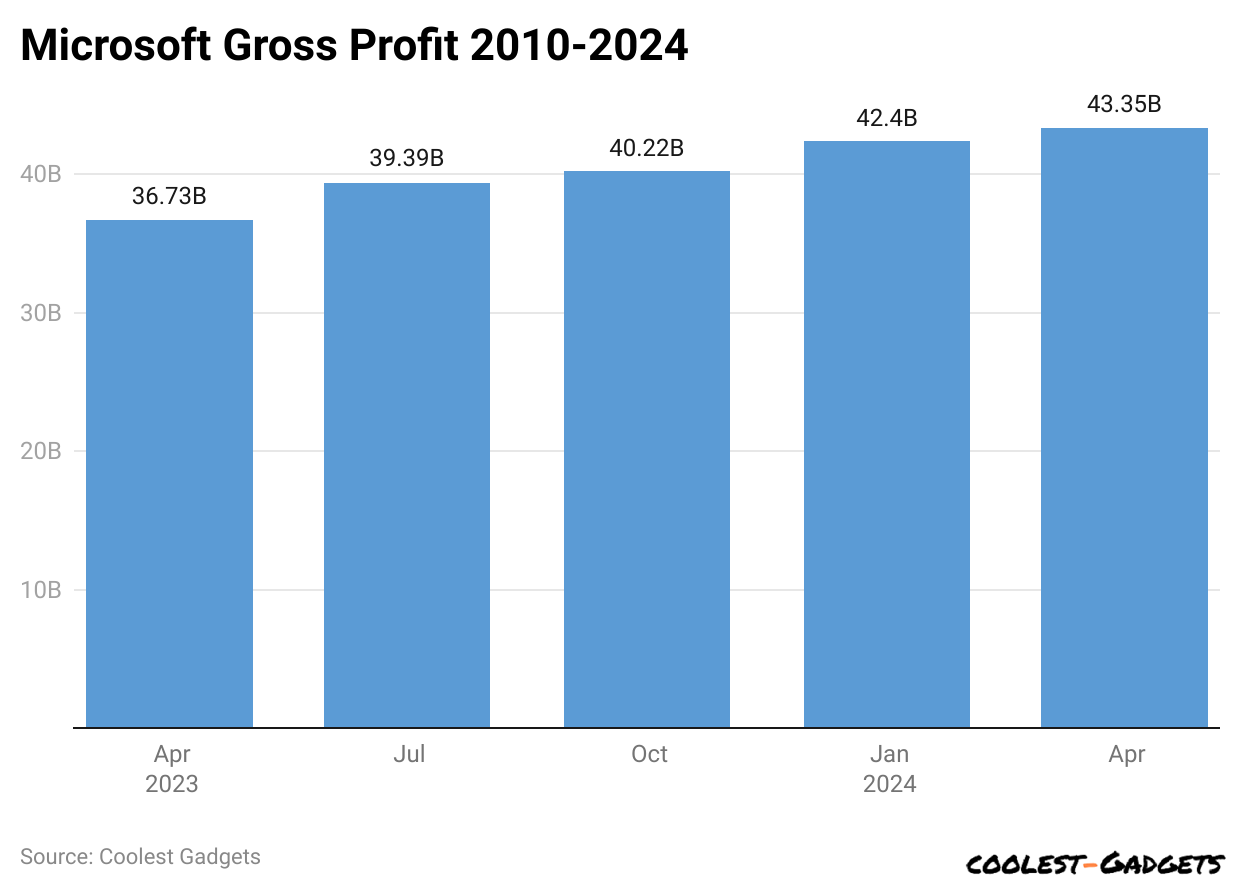
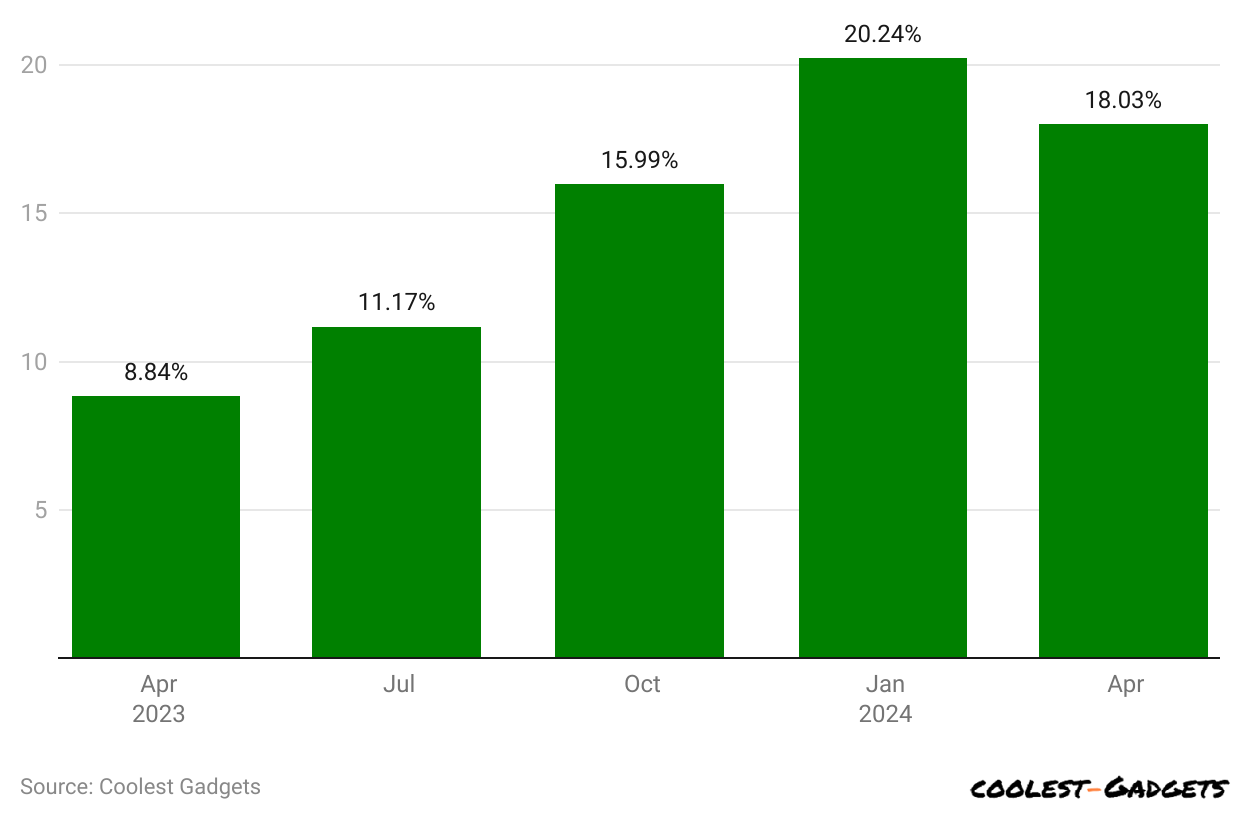
- Based on Microsoft Statistics 2023, Microsoft generated quarterly gross profit and a YoY quarterly growth rate of USD 36.729 billion in Q1 (8.84%), USD 39.394 billion in Q2 (11.17%), USD 40.215 billion in Q3 (15.99%), and USD 42.397 billion in Q4 (20.24%).
- On March 31, 2024, Microsoft’s gross profit was USD 43.353 billion, with an 18.03% growth rate.
By Operating Income
- Microsoft Statistics further states that in the first quarter of 2024, Microsoft’s operating income was USD 27.581 billion, an increase of 23.39% year over year.
- Microsoft’s quarterly operating income and growth rate in 2023 include Q1 (USD 22.352 billion and 9.76%), Q2 (USD 24.254 billion and 18.12%), Q3 (USD 26.895 billion and 24.99%), and Q4 (USD 27.032 billion and 32.52%).
By EBITDA
- By the end of March 31, 2024, Microsoft’s EBITDA was USD 33.608 billion, up 29.76% from the previous year.
- Furthermore, Microsoft Corporation’s quarterly EBITDA and YoY quarterly growth rate in 2023 were March 31 (USD 25.901 billion and 7.31%), June 30 (USD 28.128 billion and 14.75%), September 30 (USD 30.816 billion and 26.77%), and December 31 (USD 32.991 billion and 37.19%).
By Net Income
- On March 31, 2024, Microsoft’s net income was USD 21.939B, a 19.89% increase from the previous
- In 2023, Microsoft’s net income and yearly growth rate followed the first quarter (USD 18.299 billion and 9.39%), the second quarter (USD 20.081 billion and 19.96%), the third quarter (USD 22.291 billion and 26.97%), and the fourth quarter (USD 21.870 billion and 33.15%).
Revenue Statistics by Microsoft Productivity and Business Processes Segment
(Reference: statista.com)
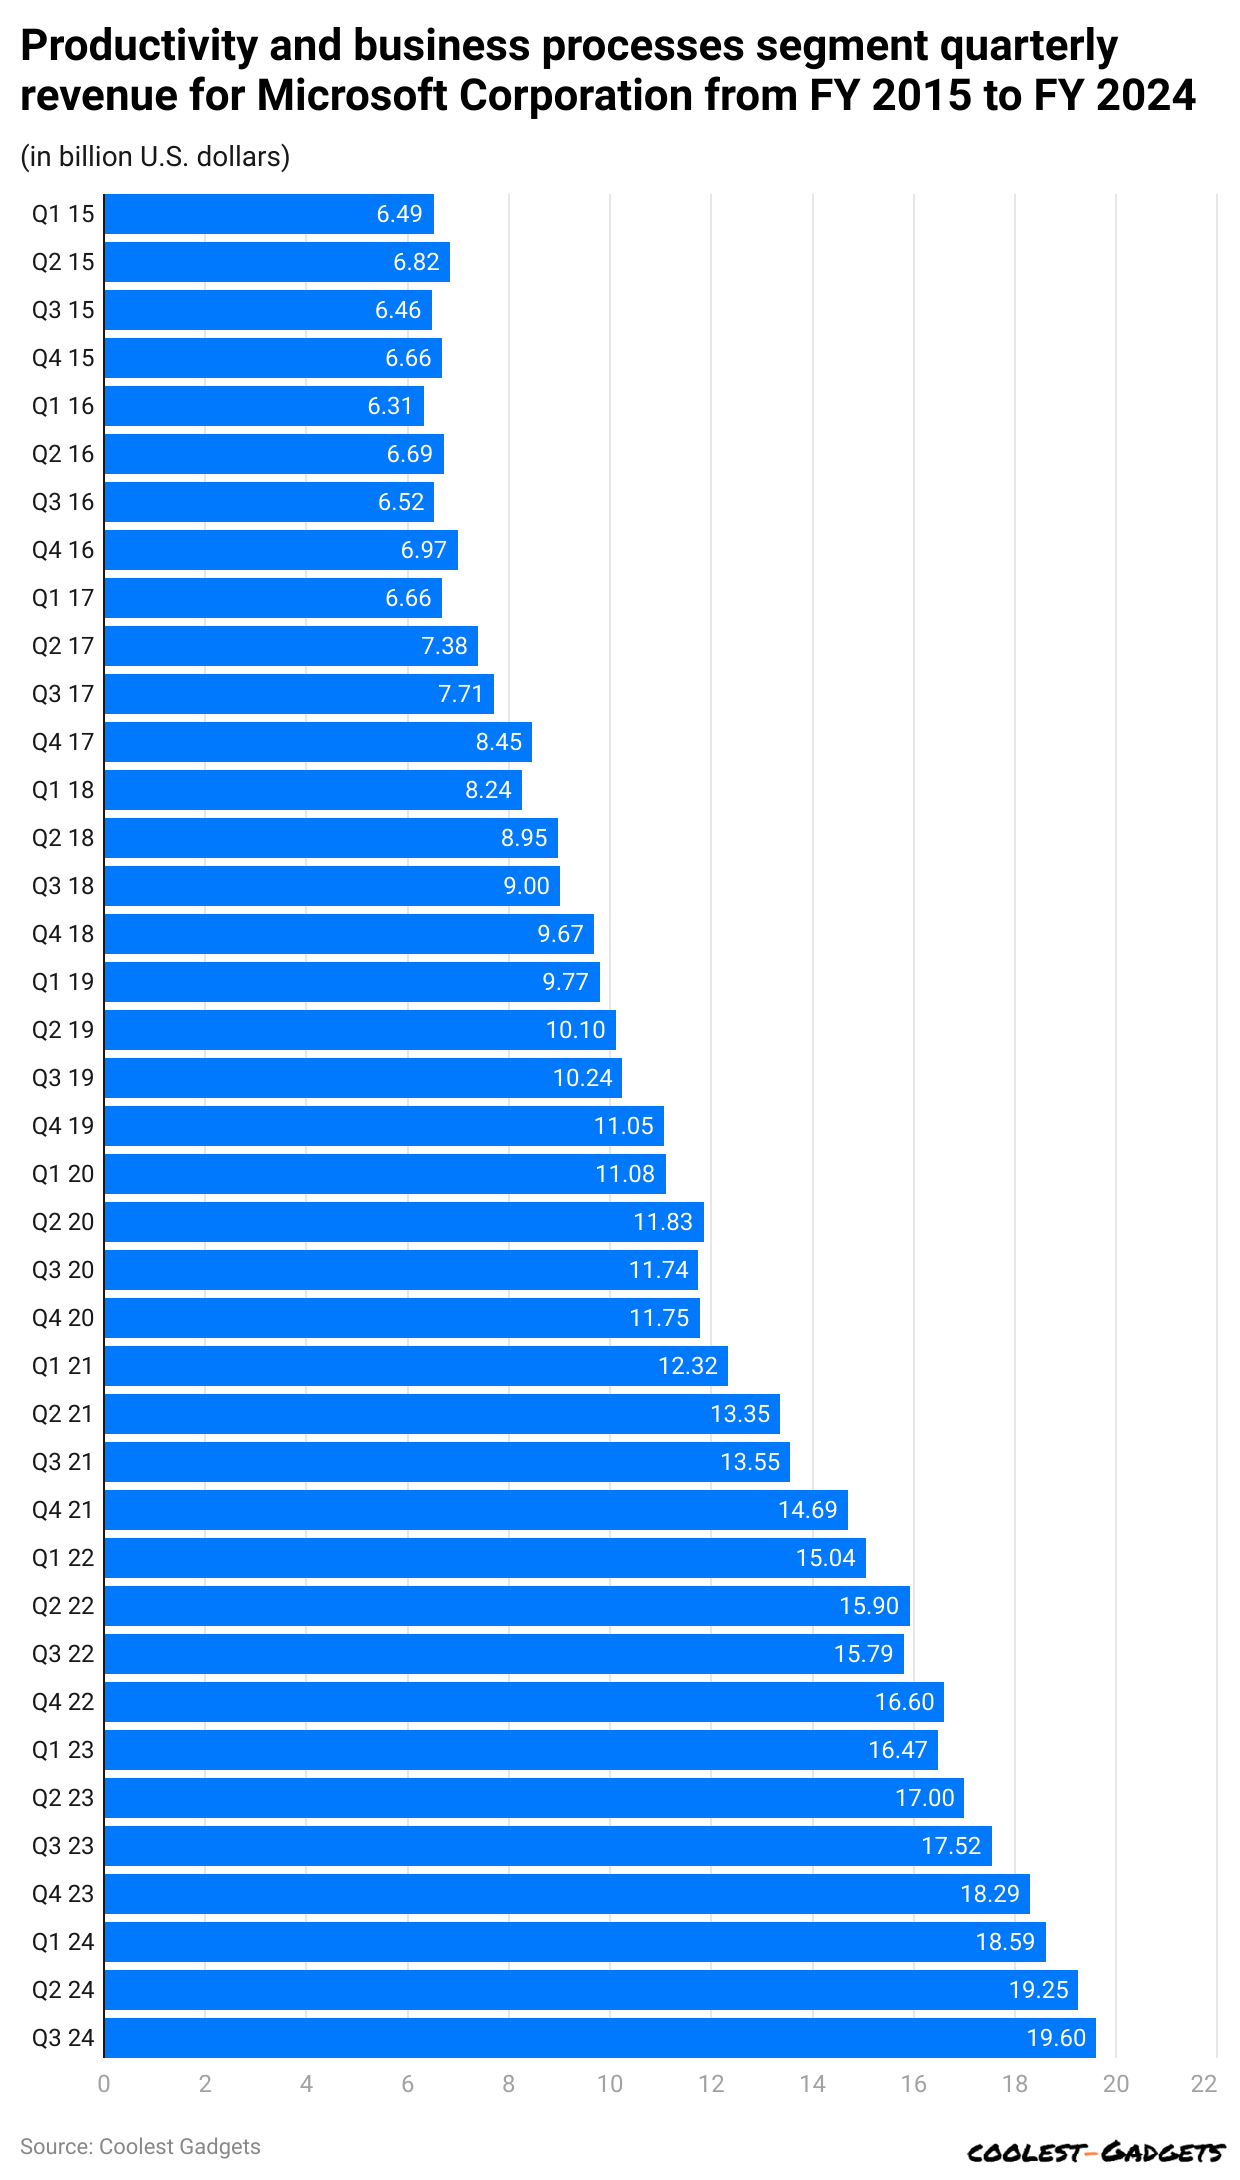
- According to Microsoft Statistics, revenue in Microsoft’s productivity and business processes segment in the first quarter of 2024 was USD 18.59 billion.
- Moreover, this segment’s expected revenue in the 2nd and 3rd quarters of 2024 will be Q2 (USD 19.25 billion) and Q3 (USD 19.6 billion), individually.
- Furthermore, in 2023, the quarterly revenue in Microsoft’s productivity and business processes segment were Q1 (USD 16.47 billion), Q2 (USD 17 billion), Q3 (USD 17.52 billion), and Q4 (USD 18.29 billion).
By More Personal Computing
(Reference: statista.com)
- In 2024, the segment is expected to generate revenue in Q1 (USD 13.67 billion) and Q2 (USD 16.89 billion).
- Furthermore, Microsoft Statistics states that quarterly revenue earned in 2023 is Q1 (USD 13.33 billion), Q2 (USD 14.24 billion), Q3 (USD 13.26 billion), and Q4 (USD 13.9 billion).
By Cloud Computing
(Source: Statista.com)
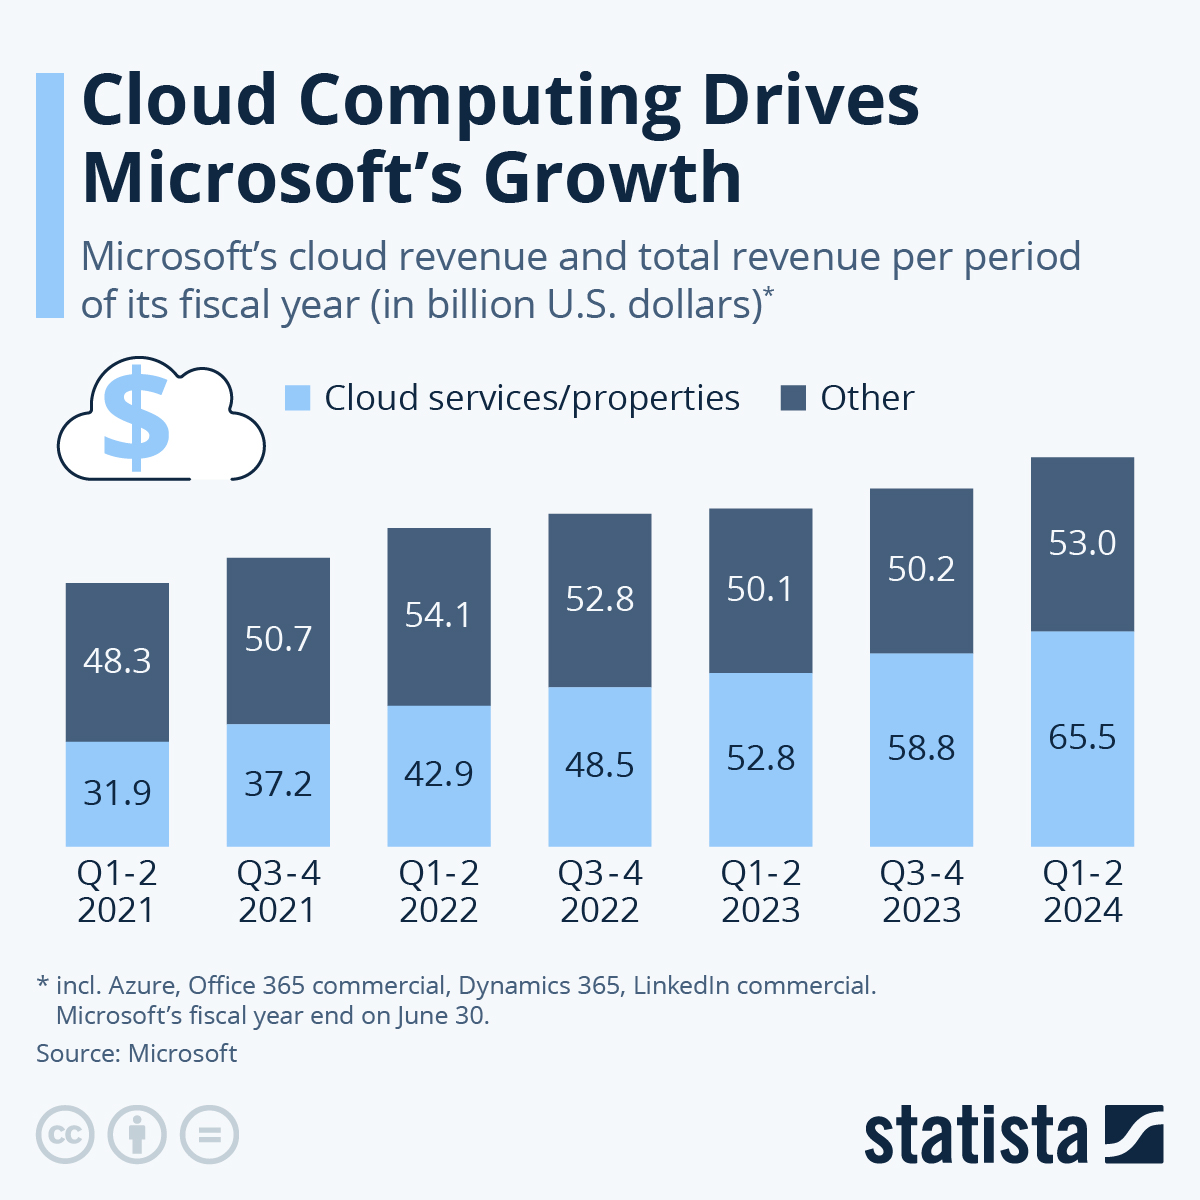
- A report published by Statista states that the expected revenue earned by Microsoft’s cloud from Q1 to Q2 will be USD 65.5 billion by 2024.
- In 2023, total revenue growth from Q1 to Q2 was USD 52.8 billion, and from Q3 to Q4 was USD 58.8 billion.
- It is estimated that users will spend approximately USD 679 billion on public cloud services.
You May Also Like To Read
- Anker Statistics
- Sennheiser Statistics
- Seagate Statistics
- Razer Statistics
- Motorola Statistics
- Samsung Statistics
- Garmin Statistics
- Panasonic Statistics
- LG Statistics
- Huawei Statistics
- Oppo Statistics
- iPhone Statistics
Microsoft Statistics by Software Spending
(Source: uscloud.com)
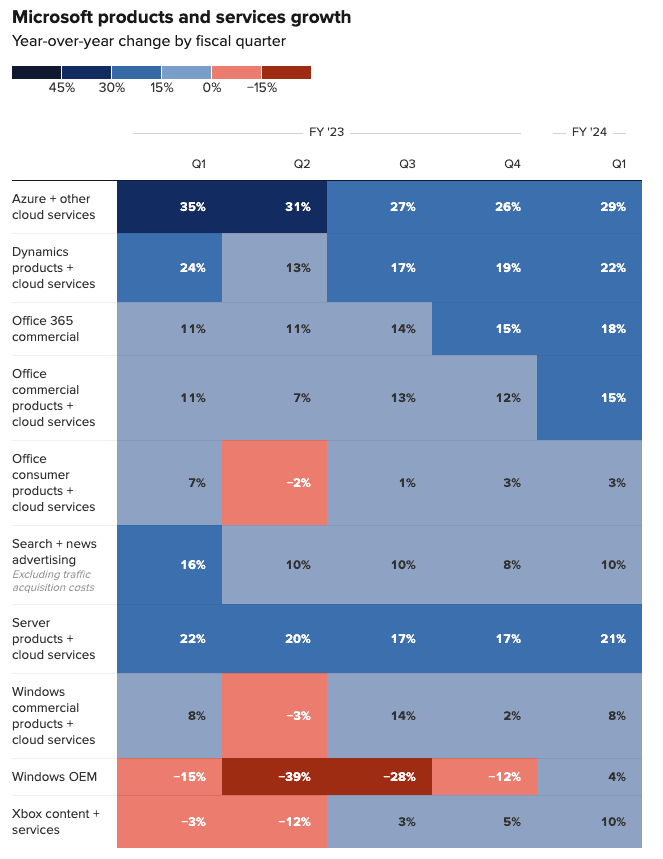
- In Q1 of 2024, Microsoft’s most significant software spending was Azure+ other cloud services, with a share of 29%.
- Meanwhile, Microsoft Azure’s other quarterly software spending in 2023 was followed by Q1 (35%), Q2 (31%), Q3 (27%), and Q4 (26%).
- Based on Microsoft Statistics, the total quarterly spending share of Dynamics products cloud services in 2023 was Q1 (24%), Q2 (13%), Q3 (17%), and Q4 (19%).
- In the first quarter of 2024, the total spending of Microsoft’s Dynamics products cloud services resulted in 22%.
- On the other hand, Microsoft’s Office 365 commercial spending share in 2023 was Q1 (11%), Q2 (11%), Q3 (14%), and Q4 (15%). Whereas in the first quarter of 2024, total spending share accounted for 22%.
- Furthermore, Microsoft’s other quarterly Software Spending in 2023 was for Office commercial products cloud services (Q1 = 11%), Q2 = 7%), Q3 = 13%), and Q4 = 12%), and in 2024 (Q1 = 15%).
- Office consumer products cloud services in 2023: (Q1 = 7%, Q2 = -2%, Q3 = 1%, Q4 = 3%) and in 2024: (Q1 = 3%).
- Search+ news advertising in 2023: (Q1 = 16%, Q2 = 10%, Q3 = 10%, Q4 = 8%) and in 2024: (Q1 = 10%).
- Server products+ cloud services in 2023: (Q1 = 22%, Q2 = 20%, Q3 = 17%, Q4 = 17%) and in 2024: (Q1 = 21%).
- Windows commercial products+ cloud services in 2023: (Q1 = 8%, Q2 = -3%, Q3 = 14%, Q4 = 2%) and in 2024: (Q1 = 8%).
- Windows OEM in 2023: (Q1 = -16%, Q2 = -39%, Q3 = -28%, Q4 = -12%) and in 2024: (Q1 = 4%).
- Xbox content+ services in 2023: (Q1 = -3%, Q2 = -12%, Q3 = 3%, Q4 = 5%), and in 2024: (Q1 = 10%).
Microsoft Statistics by Gaming Revenue
- Fiscal Year 2024 Total Gaming Revenue: Microsoft’s gaming division generated approximately USD 21.5 billion in revenue during FY2024, up from USD 15.47 billion in FY2023.
- Q1 FY2024 (July-September 2023): Increased by 9%, driven by a 13% rise in Xbox content and services revenue, while Xbox hardware revenue decreased by 7%.
- Q4 FY2024 (April-June 2024): Grew by 39%, primarily due to a 50% increase in Xbox content and services revenue, though Xbox hardware revenue declined by 13%.
- Q1 FY2025 (July-September 2024): Surged by 43%, with a 61% increase in Xbox content and services revenue, while Xbox hardware revenue dropped by 29%.
- Q2 FY2025 (October-December 2024): Declined by 7%, with a 2% increase in Xbox content and services revenue, but a significant 29% decrease in Xbox hardware revenue.
(Reference: statista.com)
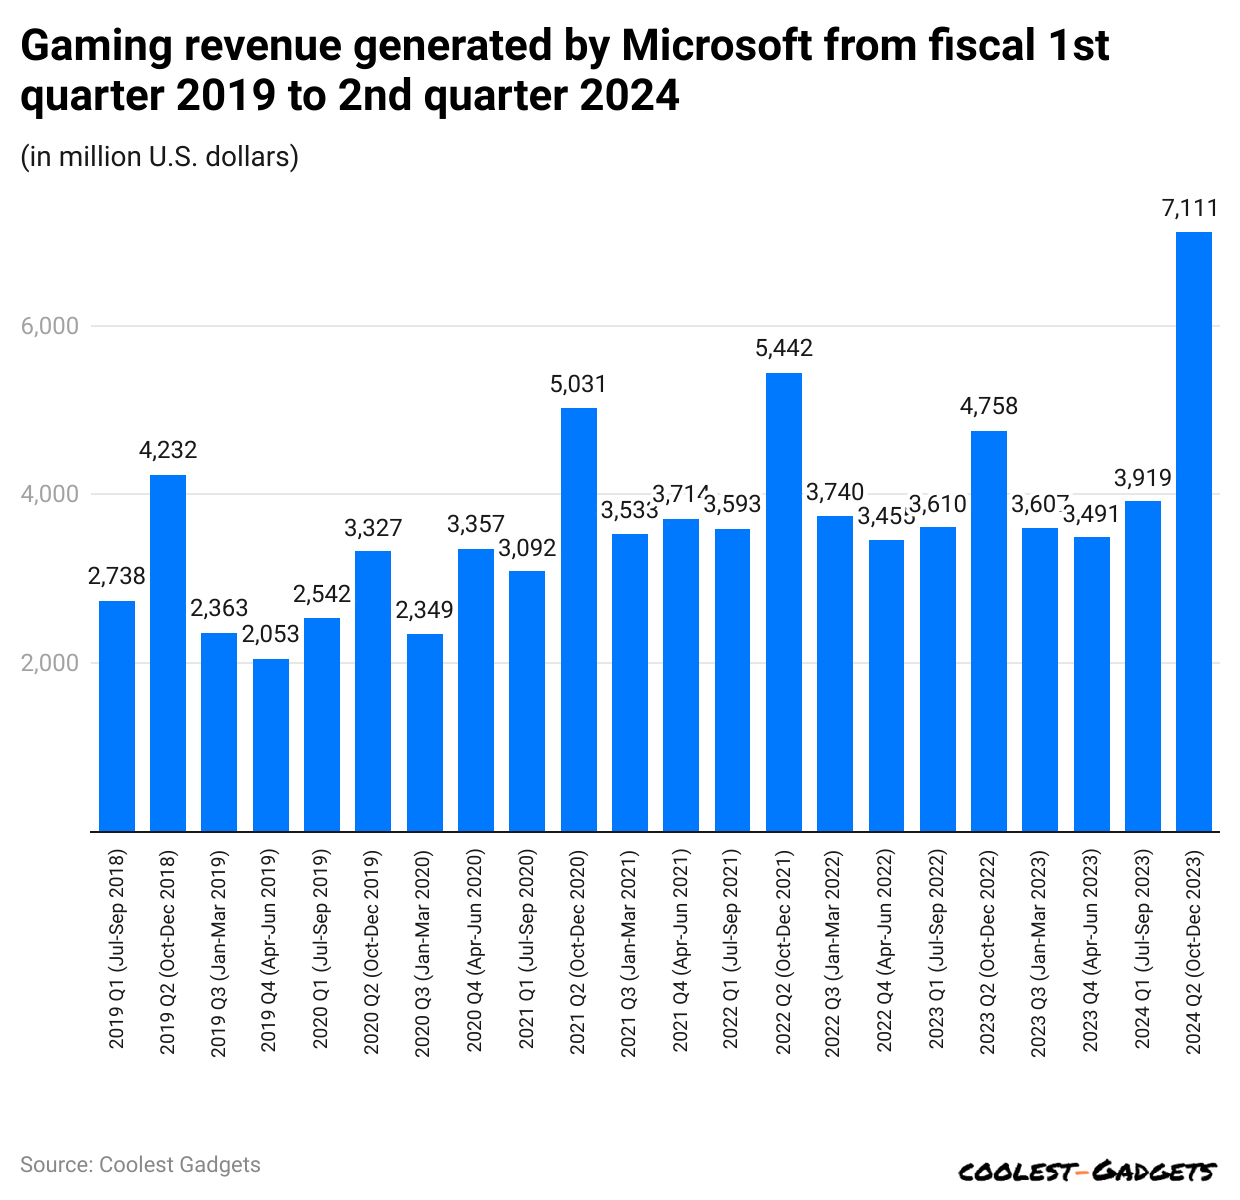
- Microsoft generated $3,610 million in gaming revenue in the first quarter of 2023, followed by Q2 (USD 4,758 million), Q3 (USD 3,607 million), and Q4 (USD 3,491 million).
- In contrast, the estimated revenue earned by the gaming sector in the 1st and 2nd quarters of 2024 will be USD 3,919 million and USD 7,111 million, respectively.
The Top Microsoft Apps Statistics by Downloads
(Reference: statista.com)
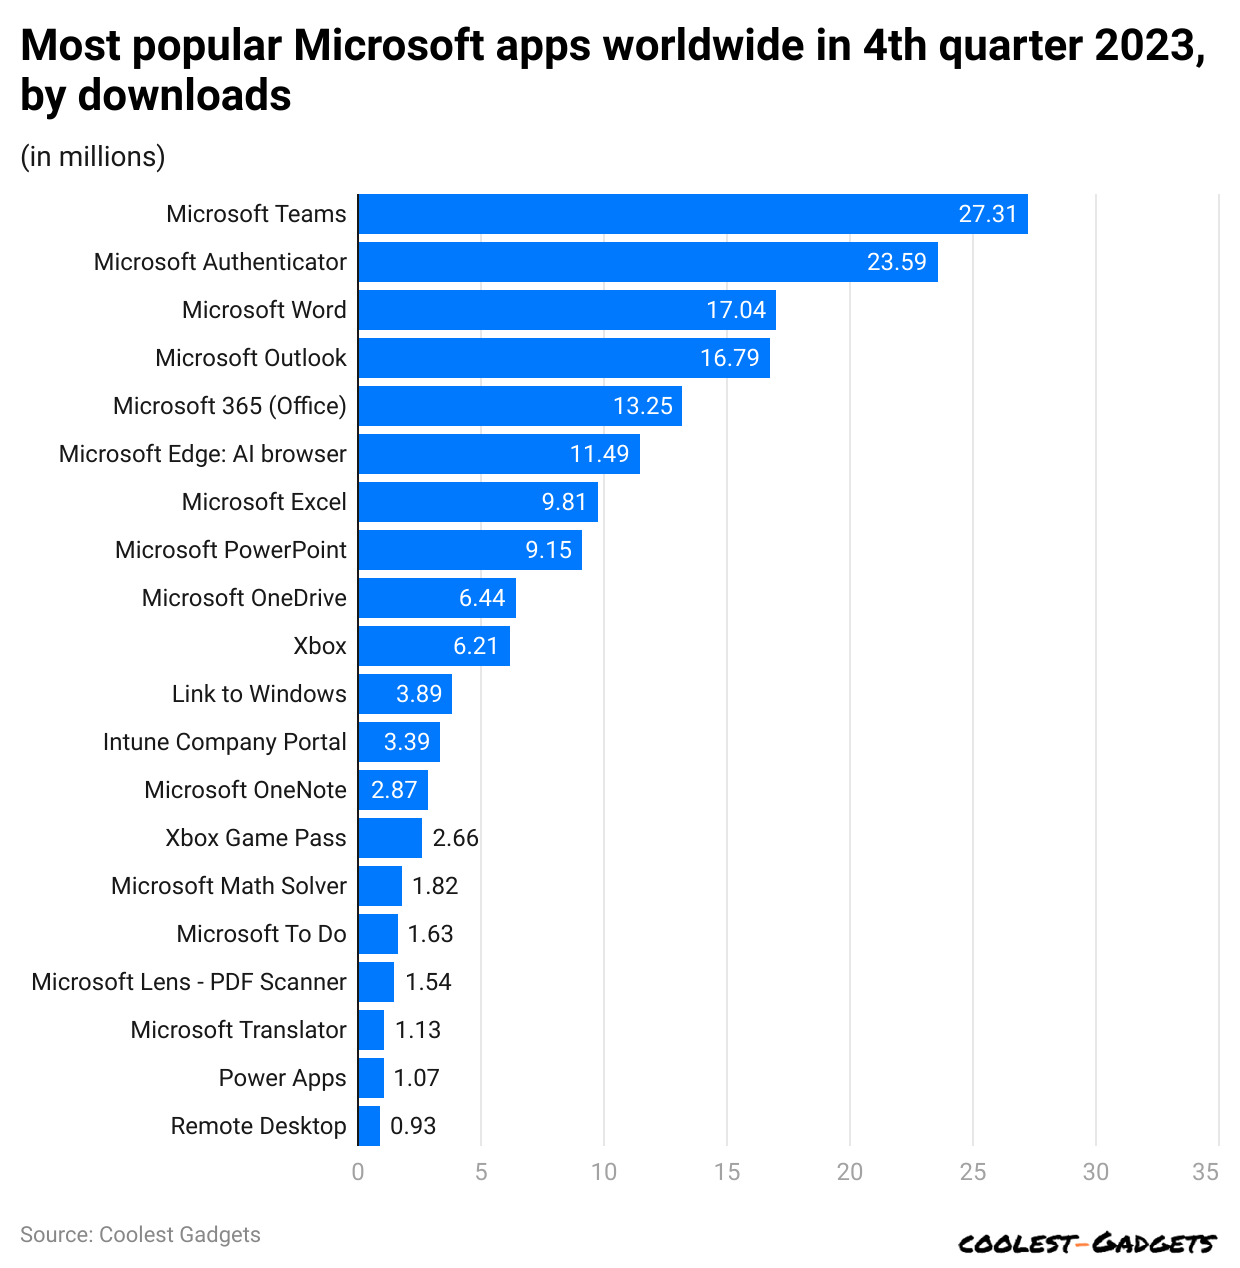
- Microsoft Statistics further states that in the fourth quarter of 2024, the top five popular Microsoft apps by total number of downloads are Microsoft Teams (27.31 million), Microsoft Authenticator (23.59 million), Microsoft Word (17.04 million), Microsoft Outlook (16.79 million), and Microsoft 365 (13.25 million).
- On the other hand, other applications by number of downloads are Microsoft Edge: AI browser (11.49 million), Microsoft Excel (9.81 million), Microsoft PowerPoint (9.15 million), Microsoft OneDrive (6.44 million), Xbox (6.21 million), Link to Windows (3.89 million), Intune Company Portal (3.39 million), Microsoft OneNote (2.87 million), Xbox Game Pass (2.66 million), Microsoft Math Solver (1.82 million), Microsoft To Do (1.63 million), Microsoft Lens – PDF Scanner (1.54 million), Microsoft Translator (1.13 million), Power Apps (1.07 million), and Remote Desktop (0.93 million).
Microsoft Patent Portfolio Statistics
(Reference: insights.greyb.com)
- Microsoft Statistics also show that there are over 107170 patents available in Microsoft globally, in which active Microsoft patents are around 70,676 and dead patents (36,494).
- Microsoft applications filed around 97 in the year 2024 and granted patents 833.
- Microsoft filed 39,771 patents in the top three countries: the United States of America (11,999), Europe (11,218), and China (11,218).
- Other country’s number of Microsoft patents are followed by Germany (4455), Japan (4264), India (4151), South Korea (3618), Canada (1994), Brazil (1916), Australia (1461), Taiwan (1293), Russian Federation (1276), Mexico (1158), Hong Kong (1133), United Kingdom (623), South Africa (520), Singapore (436), Malaysia (385), Israel (367), Austria (305), Indonesia (282), Spain (267), Philippines (180), Thailand (165), Chile (154), Argentina (122), New Zealand (114), Netherlands (84), Colombia (77), Luxembourg (67), Italy (65), Norway (58), Vietnam (51), Denmark (30), Portugal (15), Egypt (15), Poland (15), Slovenia (5), France (2), Finland (2), Cyprus (1), Turkey (1), Romania (1), Serbia (1), Lithuania (1), Croatia (1) and Hungary (1).
Microsoft’s Recent Outage
- On July 19, 2024, a faulty update from cybersecurity company CrowdStrike caused massive system failures on millions of Microsoft Windows devices, impacting around 8.5 million systems in one of the biggest IT outages ever recorded.
- Later, on September 12, 2024, Microsoft 365 services—such as Outlook, Teams, and Xbox Live—suffered disruptions, affecting over 25,000 users. The outage was traced back to modifications made by a third-party Internet service provider.
You May Also Like To Read
- Apple Customer Loyalty Statistics
- Apple Smartphone Statistics
- Apple MacBook Statistics
- Google Smartphone Statistics
- (Advanced Micro Devices) AMD Statistics
- Xiaomi Smartphone Statistics
Microsoft Website Statistics by Top Countries
(Source: similarweb.com)
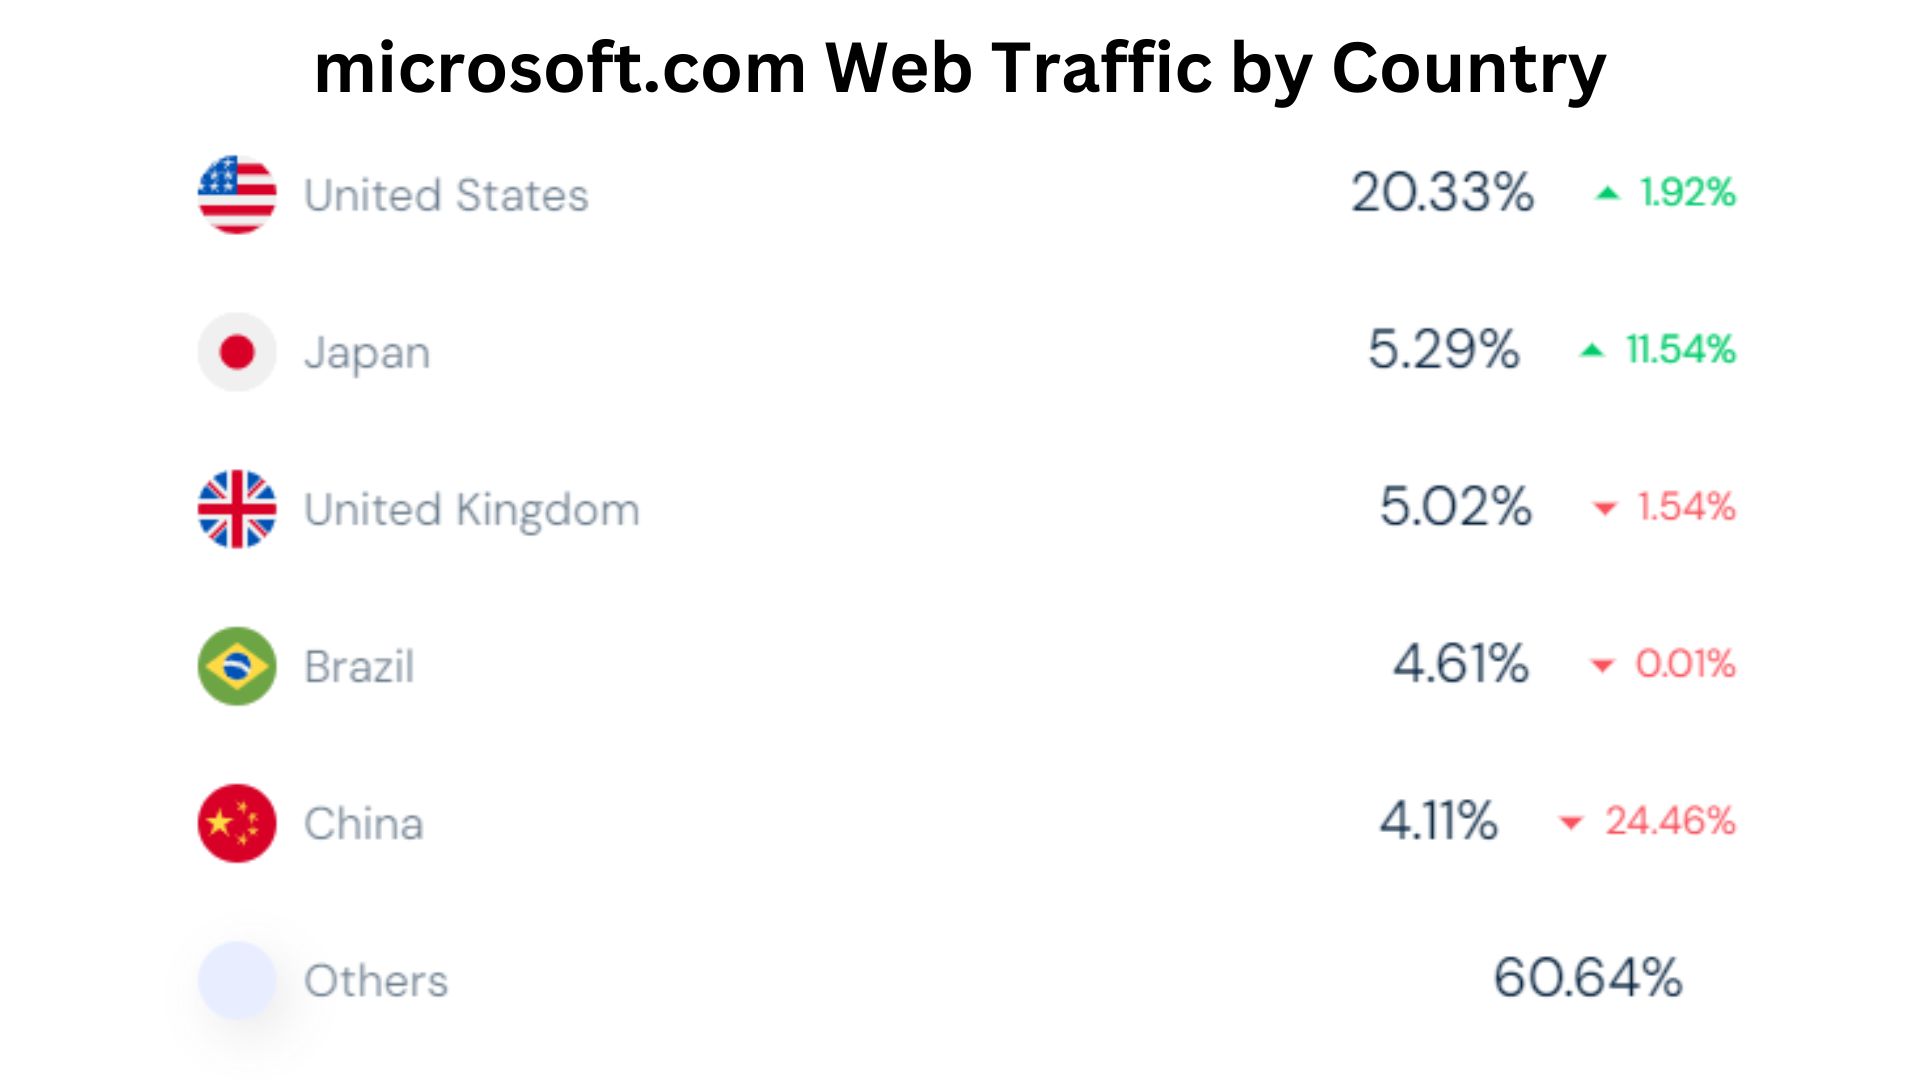
- In April 2024, the United States of America had 20.33% of total traffic on microsoft.com, but it recorded an increment in total website visitors by 1.92%.
- During the same duration, other countries recorded the following contribution in total traffic: Japan = 5.29% (+11.54%), the United Kingdom = 5.02% (-1.54%), Brazil = 4.61% (-0.01%), China = 4.11% (-24.46%),
- Other countries collectively made around 60.64% of visitor share in microsoft.com.
By Device
(Reference: semrush.com)
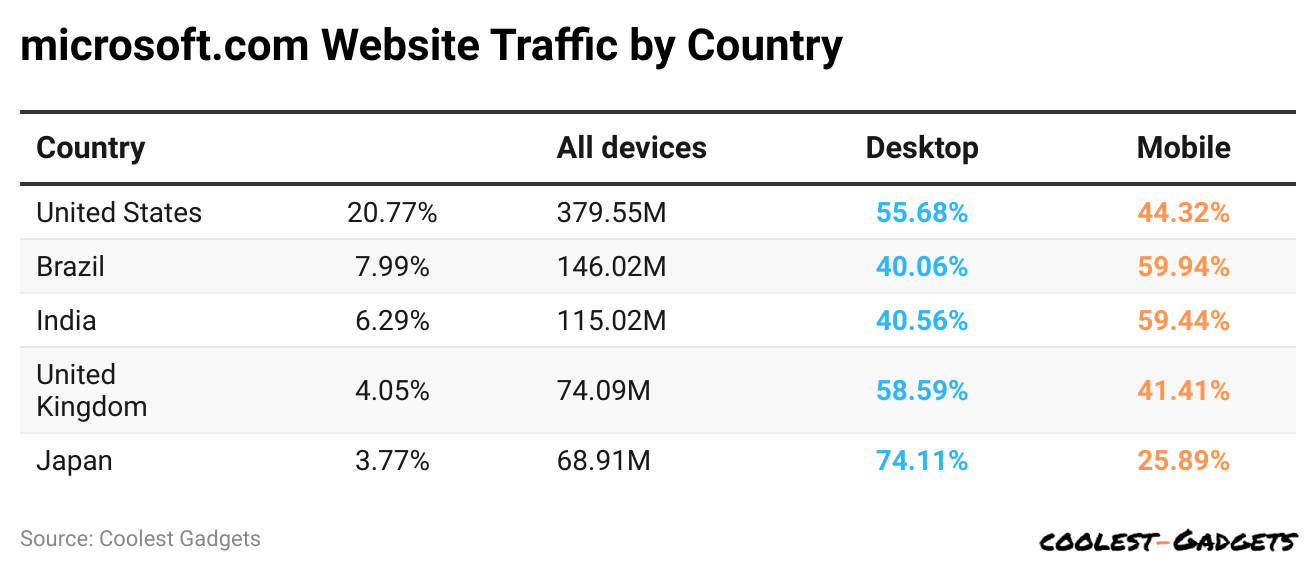
- As per Microsoft Statistics, the total traffic share from desktop and mobile on microsoft.com is 58.09% and 41.91% visits, respectively, in April 2024.
- The United States of America has 379.55 million users; 20.77% out of these, 55.68% share on desktop, and 44.32% share on mobile devices.
- The total Microsoft users share is around 7.99% in Brazil, resulting in 146.02 million, with 40.06% access to the desktop version and 59.94% to mobile devices.
- In India, the website had 115.02 million users and 6.29% website traffic, with desktop and mobile users being 40.56% and 59.44%, respectively.
- The United Kingdom and Japan each have around 74.09 million and 68.91 million users, respectively, and their website traffic is around 4.05% and 3.77%.
- Besides, 58.59% of desktop and 41.41% of mobile users in the U.K. access the website, whereas in Japan, 74.11% of users access it on desktop and 25.89% on mobile.
By Demographics
(Reference: similarweb.com)
- The male and female users of Microsoft.com hold 60.39% and 39.61% shares, respectively.
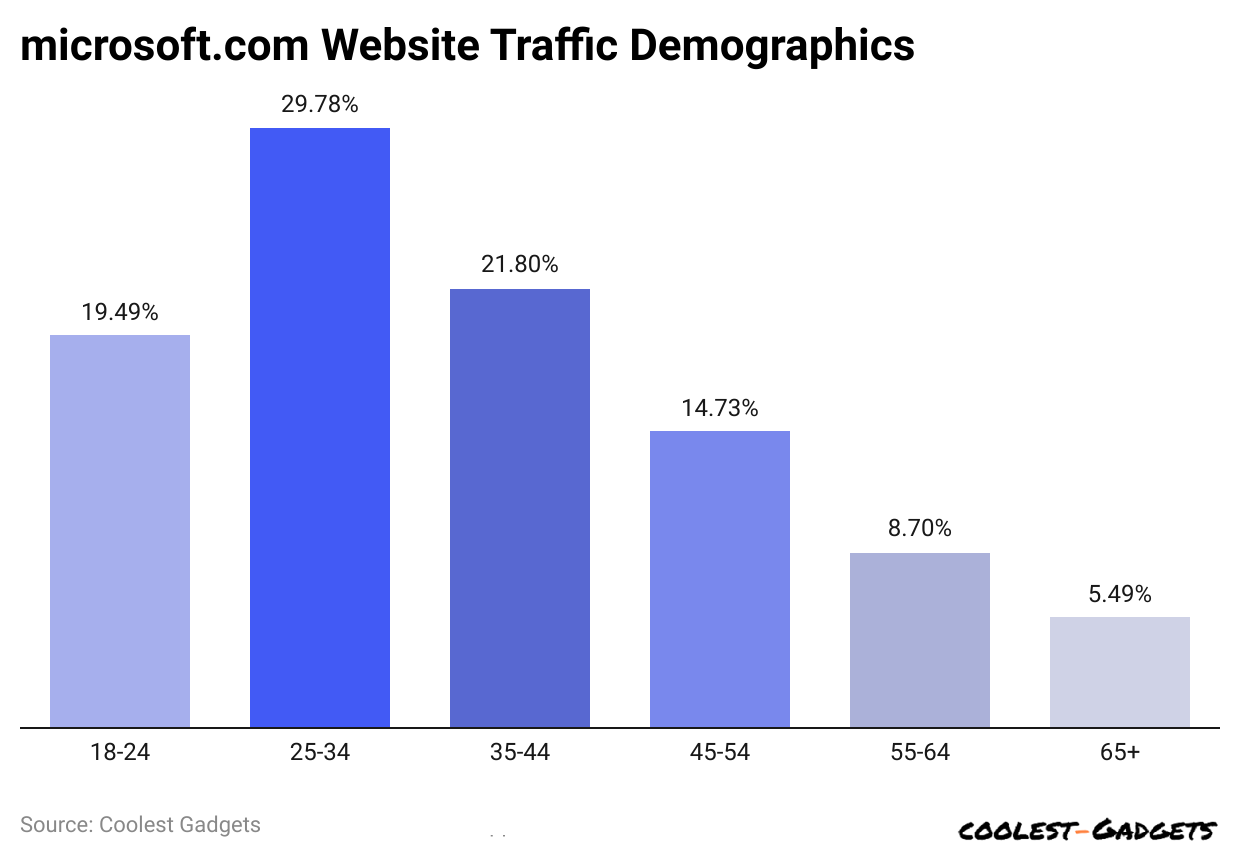
- Microsoft Statistics by age group states that the highest number of website users observed is between 25 and 34 years old, resulting in a 29.78% share.
- Out of total Microsoft users, 21.8% are aged from 35 to 44 years.
- As per Microsoft Statistics, 19.49% and 14.73% belong to individuals aged 18 to 24 and 45 to 54.
- 7% of website users are aged from 55 to 64 years.
- Nearly 5.49% of user shares were contributed by people from the age group above 65 years.
By Traffic Sources
(Reference: similarweb.com)
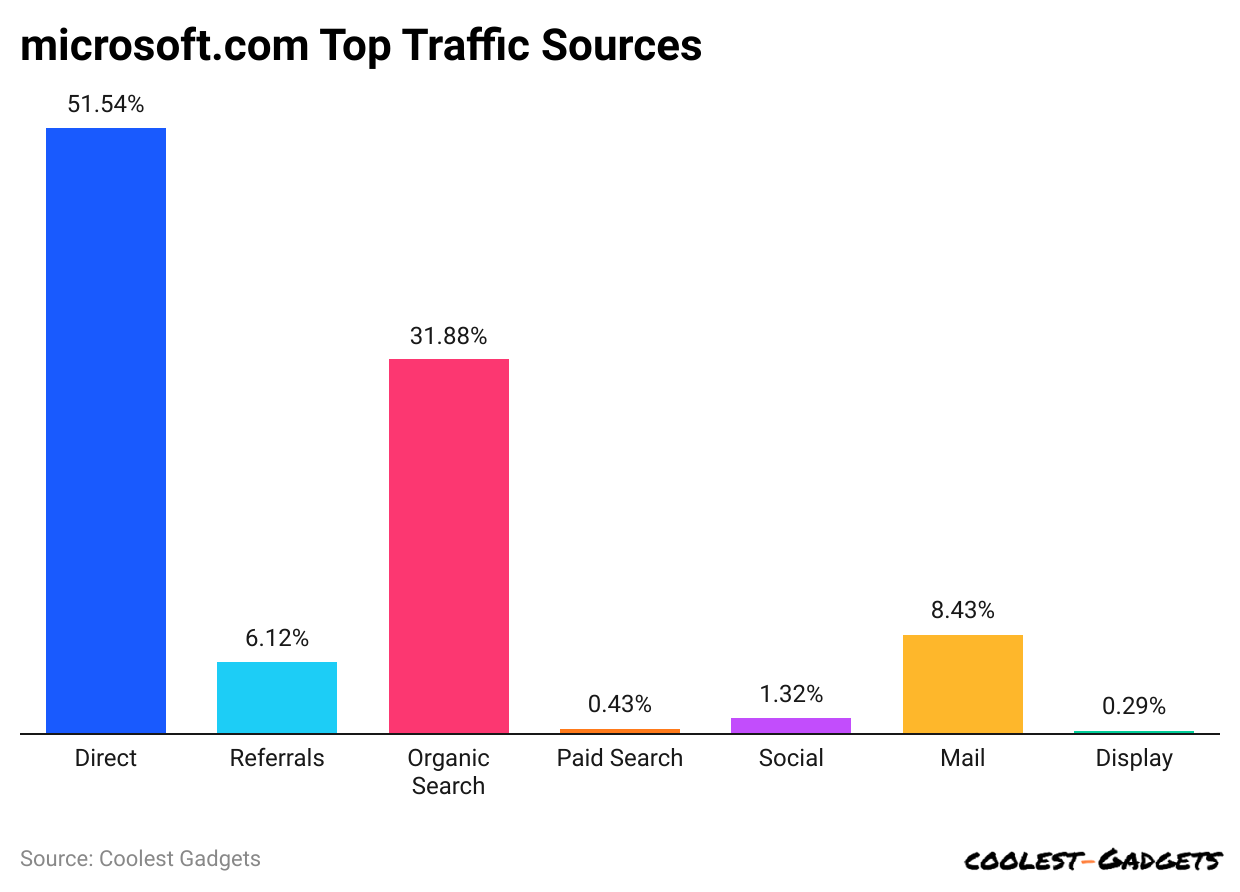
- The highest traffic rate tocom in April 2024 was from direct searches, which resulted in 51.54% by April 2024.
- As mentioned in Microsoft Statistics, around 31.88% of the share is generated by organic traffic search, while 8.43% is from Mail search from the website.
- Furthermore, other traffic sources towards microsoft.com are referrals search (6.12%), paid search (0.43%), social (1.32%), and display (0.29%).
By Social Media Referral Rate
(Reference: similarweb.com)
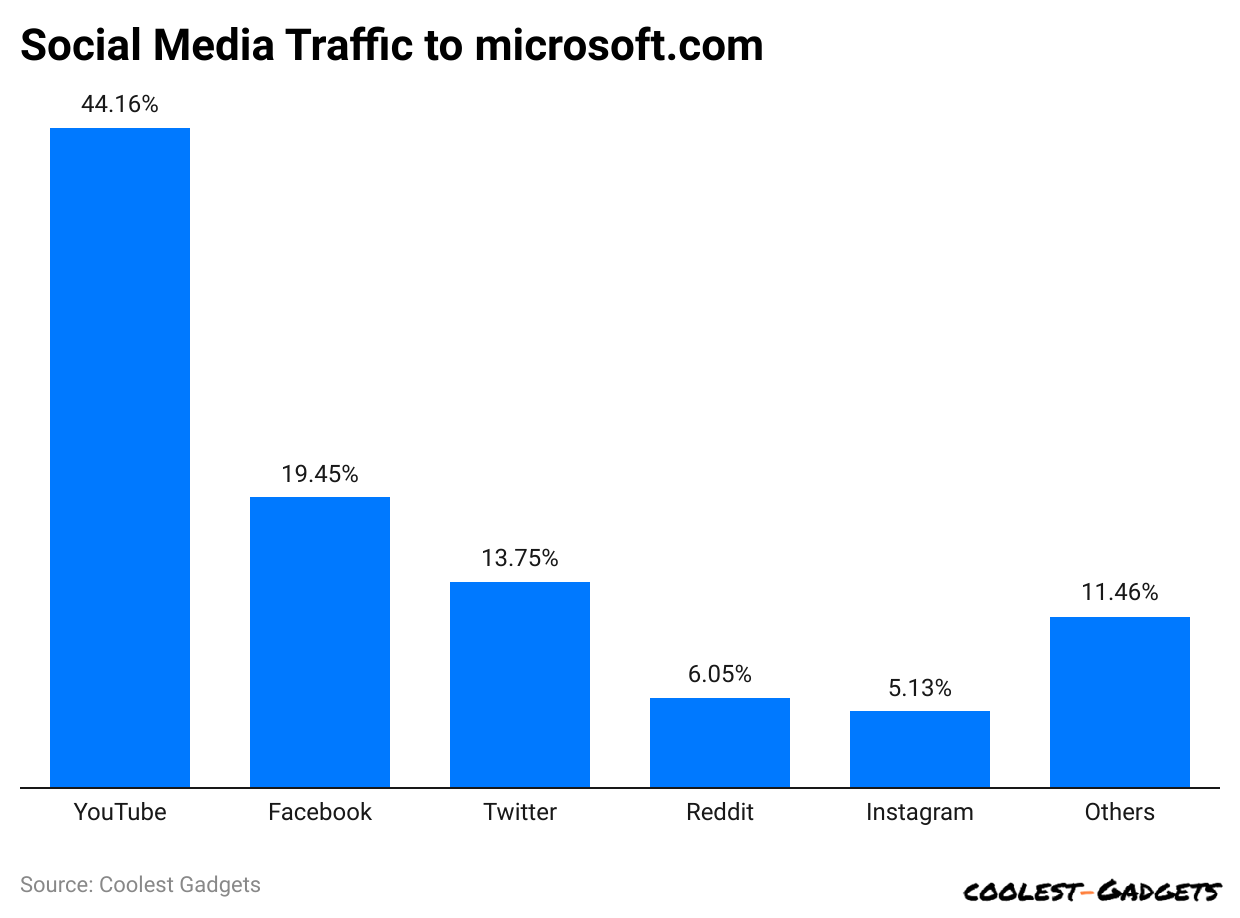
- Microsoft Statistics also shows that YouTube has the highest social media referral rate, with a 44.16% share compared to other social networks.
- LinkedIn and Reddit contribute by 19.45% and 13.75%, respectively.
- Traffic sent by Facebook is 6.05%, and WhatsApp contributes 5.13%.
- Other social media networks within microsoft.com have a nominal contribution, collectively around 11.39%.
Microsoft’s Financial Strength
- Microsoft remains a dominant force in the market, with a market capitalisation surpassing USD 2 trillion as of May 2024, showcasing strong investor trust.
- Revenue increased, with a 17% YoY increase, reaching USD 61.9 billion in the latest quarter.
- Additionally, the company’s net income of USD 21.9 billion highlights its ability to sustain profitability while investing in future innovations.
Products and Users
- Windows World: While Windows remains dominant in desktops, recent statistics suggest its market share might be stabilizing. Estimates suggest that around 1.5 billion active devices globally still rely on Windows, but growth might slow down a bit.
- Xbox Evolving: Microsoft continues to be a major player in gaming. The exact number of Xbox users in 2024 has yet to be publicly available, but the continued success of the Xbox Series X/S consoles suggests a strong and loyal user base.
- Edge is Growing: The battle among web browsers remains intense, with Chrome maintaining its lead as the most widely used option. However, Microsoft Edge is steadily gaining traction. By 2024, its user base is projected to surpass 200 million, positioning it as an increasingly popular choice for internet browsing.
- Office Stays King: For many professionals and businesses, Microsoft Office remains an essential suite. Public data on user numbers, specifically for 2024, needs to be provided, but with the continued reliance on productivity tools, Office is likely holding strong.
Employment and Innovation
- Global Workforce: Microsoft remains a major employer. While the exact figures for 2024 aren’t available yet, estimates suggest hundreds of thousands of employees worldwide continue to contribute to the company’s success.
- Cloud Computing Skyrocket: Cloud services are booming, and Microsoft Azure is a major player. With businesses increasingly moving their data and applications online, Azure is a fast-growing service for Microsoft.
Interesting Tidbits: What’s New in 2024?
- AI on the Rise: Artificial Intelligence (AI) is a growing focus for Microsoft. In 2024, the integration of AI features into existing products like Microsoft 365, and the development of new AI-powered tools are areas to watch.
- Focus on Security: Cybersecurity threats are ever-present, and Microsoft is making security a top priority. Investments in security solutions and features across their products highlight this growing focus.
- The Future of Work: The way we work has changed with the pandemic. Microsoft, through its products like Teams and ongoing research with the Work Trend Index, is actively involved in shaping the future of work.
Looking Ahead: What’s Next for Microsoft?
While we have yet to get all the 2024 data, Microsoft shows no signs of slowing down. With its strong financial performance, focus on innovation, and commitment to areas like AI and security, Microsoft is well-positioned to continue being a major force in the ever-changing tech landscape.
Some 2024 statistics might be publicly available later. However, based on the latest information and Microsoft’s trajectory, we can expect the company to remain a dominant player in the tech world.
Conclusion
In conclusion, Microsoft has solidified its position as a global technology leader by continuously innovating and adapting to the ever-evolving digital landscape. From pioneering software solutions like Windows and Office to advancing cloud computing with Azure, the company has played a crucial role in shaping modern technology. Its commitment to artificial intelligence, cybersecurity, and sustainable computing ensures ongoing relevance in an increasingly digital world. As Microsoft continues to push boundaries, its focus on user experience, business solutions, and ethical technology development will likely keep it at the forefront of the industry for years to come.
Sources
Pramod Pawar brings over a decade of SEO expertise to his role as the co-founder of 11Press and Prudour Market Research firm. A B.E. IT graduate from Shivaji University, Pramod has honed his skills in analyzing and writing about statistics pertinent to technology and science. His deep understanding of digital strategies enhances the impactful insights he provides through his work. Outside of his professional endeavors, Pramod enjoys playing cricket and delving into books across various genres, enriching his knowledge and staying inspired. His diverse experiences and interests fuel his innovative approach to statistical research and content creation.