Tesla Statistics By Revenue, Market, Region And Fact

Updated · Mar 11, 2025


TABLE OF CONTENTS
- Introduction
- Editor’s Choice
- Features of Tesla
- General Tesla Statistics
- Tesla Current Facts
- Tesla Production Statistics
- Tesla Delivery Statistics
- Tesla Revenue Statistics
- Tesla Stock Market Statistics
- Tesla United States of America Statistics
- Tesla Market Capital and Market Share Statistics
- Tesla Vehicles Delivered Statistics
- Tesla Statistics By Region
- Tesla Charging Station Market Size Statistics
- Recent Developments of Tesla
- Conclusion
Introduction
Tesla Statistics: Tesla has grown rapidly over the years and plays a major role in the electric vehicle (EV) industry. The company leads the market with its advanced technology, increasing global reach, and rising car sales. Its production numbers, revenue, and market share show its strong position. Tesla also helps cut carbon emissions and improve battery technology. As more companies enter the EV market, Tesla must keep innovating and expanding to stay ahead.
Looking at Tesla’s numbers gives a clear picture of its financial health, market influence, and future potential, making it a key player in clean energy and self-driving cars.
Editor’s Choice
- Tesla is expected to deliver around 369,400 vehicles in the first quarter of 2025, which is 16% less than Wall Street’s forecast of 437,500.
- By early March 2025, its stock had dropped over 30% due to worries about deliveries and market trends.
- Sales of Tesla’s China-made electric vehicles dropped by 49.2% in February 2025 compared to the previous year, marking the lowest monthly sales since August 2022.
- In Germany, Tesla car registrations fell by 76% in February 2025 year-over-year, despite an overall increase in electric vehicle sales in the country.
- By 2025, Tesla will operate over 7,000 Supercharger stations globally, with more than 65,800 connectors, enhancing charging infrastructure for its customers.
- The Tesla Model Y continues to be a strong performer, with global sales reaching approximately 1.2 million units in 2024.
- By January 2025, Tesla customers had driven 3 billion miles using the FSD (Supervised) feature, showing strong interest in its self-driving technology.
- Meanwhile, Elon Musk’s political views have sparked concerns that Tesla’s reputation and sales may be affected, especially among liberal buyers.
- Despite stock declines, Tesla’s valuation remains high. As of early 2025, its forward price-to-earnings (P/E) ratio was still in the triple digits.
- Tesla faces increasing competition from other automakers, notably China’s BYD, which saw a 90.4% increase in vehicle sales, challenging Tesla’s market share.
You May Also Like To Read
- Lamborghini Statistics
- Li-Auto Statistics
- McLaren Statistics
- Mercedes-Benz Statistics
- Peugeot Statistics
- Porsche Statistics
- Ram Trucks Statistics
- Rolls-Royce Statistics
- Skoda Statistics
- Subaru Statistics
- Suzuki Statistics
- Tata Motors Statistics
- Toyota Statistics
- Vauxhall Statistics
- Volkswagen Statistics
- Volvo Statistics
Features of Tesla
- Tesla offers a variety of electric vehicles (EVs) aimed at different markets.
- The Model S is a luxury sedan known for its performance and range.
- The Model 3 is a midsize sedan designed to make EV technology more accessible.
- The Model X is an SUV that combines electric power with space and versatility, while the Model Y is a compact SUV made to be practical and affordable for everyday use.
- Tesla’s cars run on electric power, which reduces greenhouse gas emissions and eliminates the need for gasoline.
- Tesla has invested heavily in battery technology and operates its own Gigafactories to produce high-capacity lithium-ion batteries. This helps Tesla manage costs and ensure a stable supply of batteries for its vehicles.
- In addition to vehicles, Tesla focuses on clean energy solutions. They offer products like the Powerwall and Powerpack, which store energy from sources like solar power and provide backup power for homes and businesses.
- Tesla’s cars run on electricity, which helps cut down greenhouse gas emissions and removes the need for gasoline.
- Tesla has invested heavily in battery technology and operates its Gigafactories to produce powerful lithium-ion batteries. This allows Tesla to control costs and maintain a steady supply of batteries for its cars.
- Beyond cars, Tesla also develops clean energy solutions. It sells products like the Powerwall and Powerpack, which store solar energy and provide backup power for homes and businesses. The company also makes solar panels and solar roof tiles to encourage renewable energy use.
- Tesla is a leader in self-driving technology with its Autopilot system. Although drivers must stay alert, Autopilot assists with tasks like steering, lane changes, and parking. With factories and sales worldwide, Tesla continues to push for a future powered by sustainable energy.
General Tesla Statistics
- Tesla saw significant growth in 2023, producing 1.85 million vehicles, a 35% increase from the previous year.
- Vehicle deliveries also increased by 38%, reaching 1.81 million. In the first quarter of 2024, Tesla built 495,000 vehicles and delivered more than 484,000.
- The company’s revenue for 2023 totaled USD 96.77 billion, marking an 18.79% rise compared to USD 81.46 billion in 2022.
- For Q1 2024, Tesla reported a revenue of USD 21.3 billion. Tesla remained the top player in the US EV market, selling 654,888 electric vehicles and holding a 55% market share.
- In China, the company sold 603,304 EVs, securing a 7.5% market share. European sales were also strong, with Germany recording 63,682 units (12% market share), France selling 62,711, and Italy reaching 16,633 units (24.9% market share).
- Model Y and Model 3 continued to be the best-selling Tesla cars worldwide.
- As mentioned in Tesla Statistics as of Q1 2024, Tesla sold 369,783 Model 3/Y vehicles, while Model X/S sales stood at 17,027 units.
- By December 2023, Tesla had 5,878 Supercharger stations worldwide, with the US and China accounting for 68.12% of these locations. The number of Supercharger stations had increased by 91.47% over two years.
- Norway recorded 23,058 Model Y sales in 2023, while in Germany, Model Y (45,818 units) and Model 3 (15,865 units) were the top choices.
- In China, Model Y led the market with 456,394 units sold. Tesla ended 2023 with a market value of USD 789.89 billion, which dropped to USD 616.47 billion by February 2024.
- The company reported a GAAP income of USD 15 billion for 2023, with USD 7.9 billion coming from Q4 alone.
- Tesla achieved a new record in global EV sales, delivering 1,845,985 electric vehicles—the highest number in its history. In 2023, Tesla also began Cybertruck deliveries, though delays continued into early 2024.
- In Q4 2023, Tesla installed 41 MW of solar panels and deployed 3.2 GWh of energy storage.
- The company maintained a 17% share of the global EV market, with Model Y (1,211,601 units) and Model 3 (529,287 units) being the year’s best-selling models.
- The US and China remained Tesla’s largest EV markets, accounting for the highest number of vehicle sales in 2023.
Tesla Current Facts
- In 2023, Tesla finally began delivering its long-awaited Cybertruck models, though they faced further delays in early 2024.
- Around this time, Tesla also had layoffs globally, affecting its workforce of nearly 140,500 employees.
- Despite these challenges, Tesla remained a top global brand and achieved a record-breaking 1.8 million vehicle deliveries in 2023.
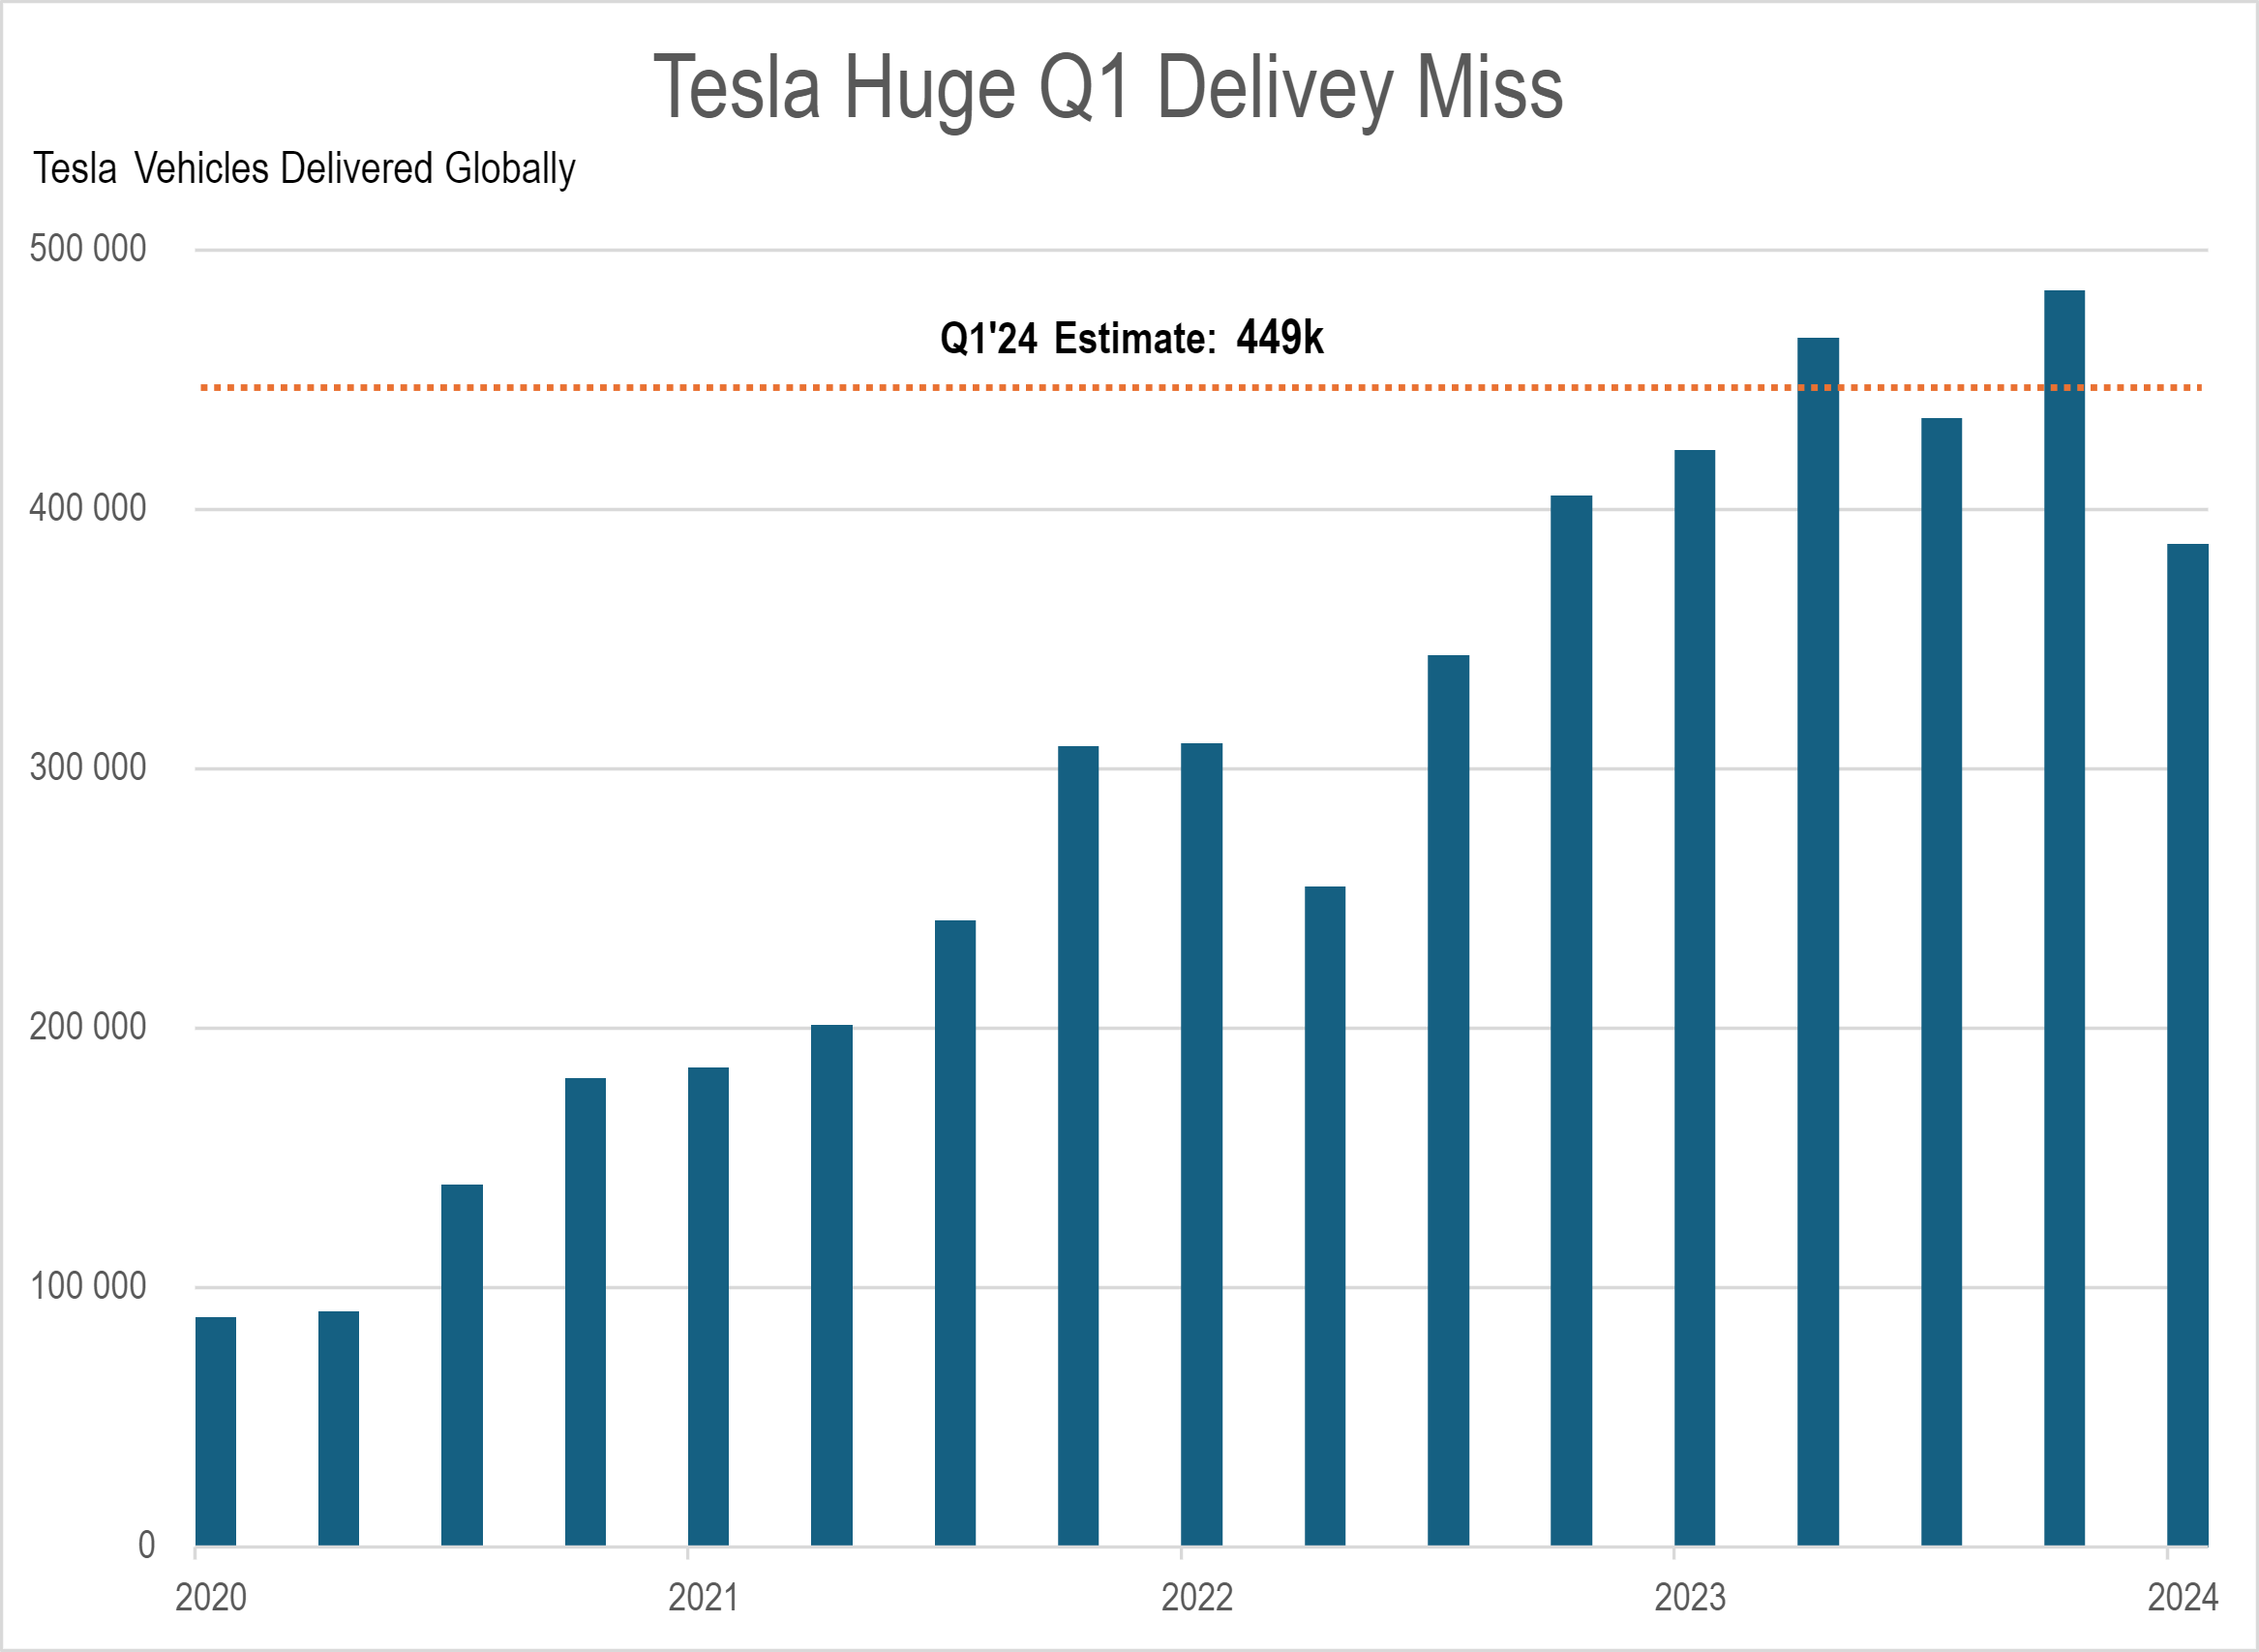
(Source: leverageshares.com)
- In the above chart, we can see the Tesla vehicles that have been delivered in recent years.
- The majority of Tesla’s revenue, which surpassed USD 78.5 billion, came from selling cars, as per Tesla Statistics.
- The company continued to invest heavily in research and development, focusing on artificial intelligence and connected vehicles.
- Tesla strengthened its presence in North America by becoming the standard for fast-charging connectors and expanding its Supercharger network to serve more electric vehicles.
- The US remained Tesla’s main market, where it held a significant share of the automotive market.
- However, Tesla faced increasing competition from Chinese automakers, especially in China’s growing EV market.
- BYD surpassed Tesla in EV sales in 2022 and widened the lead in 2023 by selling over a million more EVs than Tesla did. This competition highlighted the global challenges that Tesla was confronting.
- As per Tesla Statistics, Tesla’s success in the U.S. led to new competitors like Rivian, Lucid Motors, and Canoo joining the electric vehicle market.
- However, many of these companies struggled to profit. For example, Lucid Motors suffered a huge net loss of about USD 2.8 billion in 2023.
- Moving forward, Tesla must handle competition while staying innovative.
- Additionally, controversies surrounding its CEO and the company have impacted its stock price, creating future challenges.
Tesla Production Statistics
(Source: statista.com)
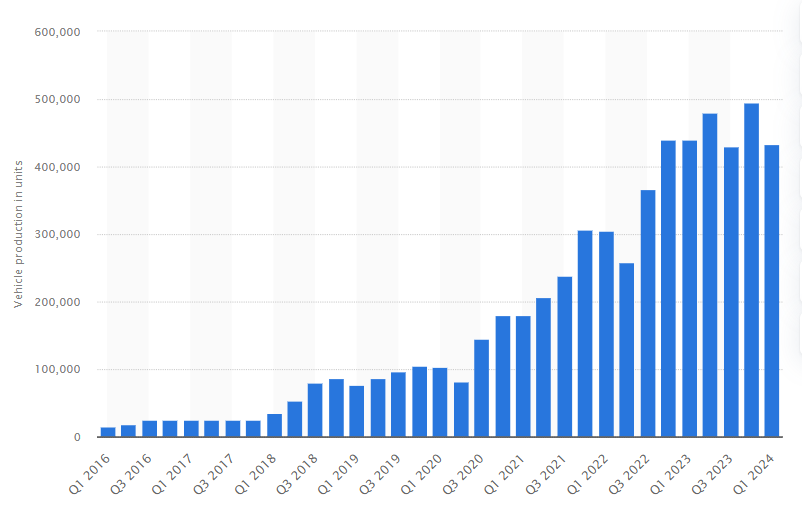
- The above chart shows the number of Tesla vehicles produced globally between Q1 2016 and Q1 2024.
- In the latest quarter, Tesla, Inc. produced nearly 433,400 vehicles. This marked a decrease of about 12.4% compared to the previous quarter and about 1.7% compared to the same quarter last year.
- Despite challenges such as the impact of the coronavirus outbreak on Tesla’s Shanghai factory and the temporary shutdown of its Fremont, California factory in early 2020, Tesla still managed to produce almost 185,000 vehicles in the first half of that year.
- After reopening in May 2020, the Fremont factory quickly resumed production, contributing over 82,000 units in the second quarter alone.
- As per Tesla Statistics, Tesla continued to achieve record production levels, reaching a new high in the fourth quarter of 2023.
- Globally, Tesla manufactured a total of 1,845,985 cars and delivered 1,808,581 vehicles to customers.
- Of these, Tesla produced 1,775,159 units of the Model 3 and Model Y combined and delivered 1,739,707 vehicles to customers.
- In 2023, Tesla produced 70,826 units of the Tesla Model S, Model X, and Cybertruck models, of which 68,874 were delivered to customers.
- In 2023, Tesla produced nearly 1.85 million vehicles, marking a significant 35% increase from its strong performance in 2022.
- A report based on Tesla Statistics shows that this growth was driven largely by the high production and sales of models such as the Model 3 and Model Y.
- The Model 3 had been the top-selling plugin electric vehicle globally in 2020 and 2021 but faced tougher competition from other Tesla models in 2023, including the Model Y and the updated Model S Plaid, leading to a third-place ranking in sales for the year.
- In 2023, Tesla achieved its highest-ever production year for electric vehicles (EVs).
Tesla Delivery Statistics
- In the first few months of 2023, Tesla delivered almost 1,324,074 vehicles globally.
- The third quarter of 2023 saw the deliveries of almost 435,059 vehicles, which is almost 26.53% of the Year-on-year average.
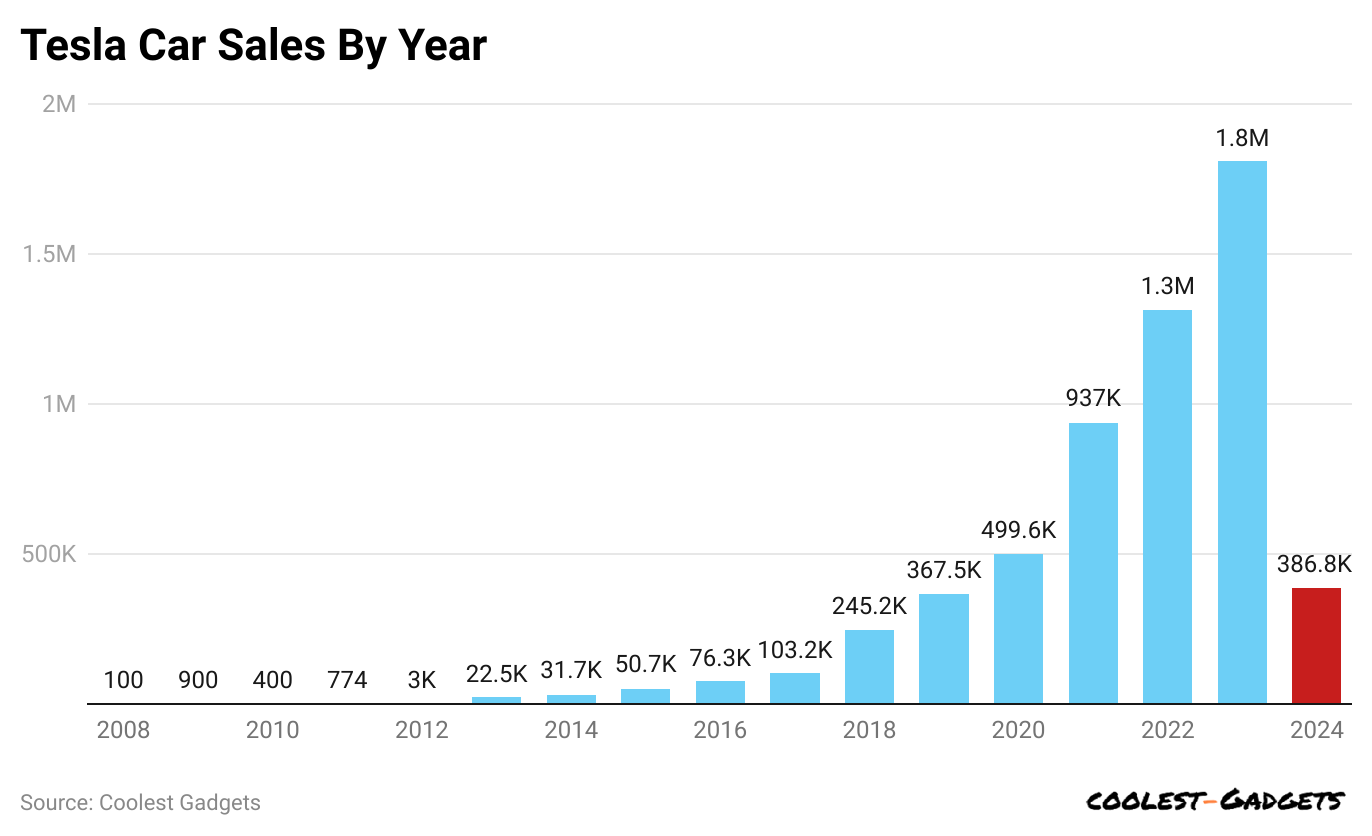
(Reference: tridenstechnology.com)
- In the above chart, we can see the Tesla Car Sales and delivery between 2008 to 2024.
| Year | Total Sales | Vehicles Models Sold |
|
Q1 2024 |
386,810 | Model 3/Y, Model X/S, Cybertruck |
| 2023 | 1,808,581 |
Model 3/Y, Model X/S |
|
2022 |
1,313,581 | Model 3/Y, Model X/S |
| 2021 | 936,950 |
Model 3/Y, Model X/S |
|
2020 |
499,550 | Model 3/Y, Model X/S |
| 2019 | 367,500 |
Model 3/Y, Model X/S |
|
2018 |
245,240 | Model 3/Y, Model X/S |
| 2017 | 103,181 |
Model X/S, Model 3 |
|
2016 |
76,285 | Model S, Model X |
| 2015 | 50,658 |
Model S, Model X |
|
2014 |
31,655 | Model S |
| 2013 | 22,477 |
Model S |
|
2012 |
3,000 | Roadster, Model S |
| 2011 | 774 |
Roadster |
|
2010 |
~400 | Roadster |
| 2009 | ~900 |
Roadster |
|
2008 |
~100 |
Roadster |
(Reference: buyacar.co.uk)
- Tesla’s worldwide electric vehicle deliveries reached 1.81 million, 38% higher than the 1.31 million cars they produced in 2022, as per Tesla Statistics.
- In 2023, production grew by almost 35% from 1,369,611 in 2022 to 1,845,985.
Tesla’s Worldwide Deliveries and Production in 2023:
| Model | Production | Delivery |
|
Other Models |
70,826 | 68,874 |
| Model 3/Y | 1,77,159,159 |
1,739,707 |
|
Total |
1,845,985 |
1,808,581 |
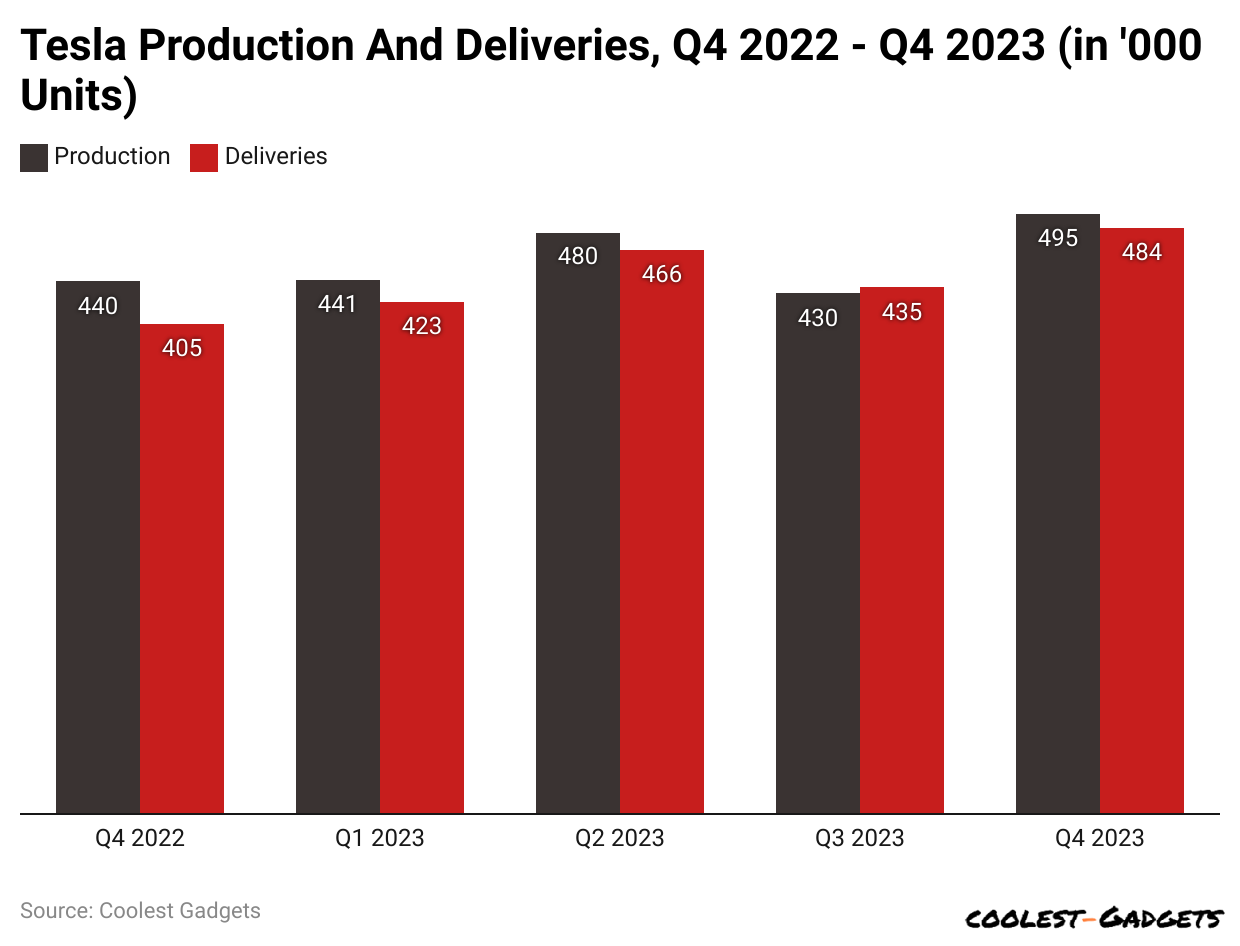
- In Q1 2023, Tesla manufactured around 440,808 electric vehicles, of which 422,875 were delivered.
- Of the 422,875 vehicles that Tesla delivered in Q1 2023, nearly 97% of the Model 3/Y were delivered.
- Q1 2023 of Tesla Deliveries and Production:
| Model | Production | Delivery |
|
Model 3/Y |
421,371 | 412,180 |
| Model S/X | 19,437 |
10,695 |
|
Total |
440,808 |
422,875 |
- Tesla increased the production of electric vehicles by 8.8% in Q2 of 2023. The total number of vehicles manufactured stood at 479,700 EVs and 466,140 deliveries.
Tesla Q2 2023 Deliveries and Production:
| Model | Production | Delivery |
|
Model 3/Y |
460,211 | 446,915 |
| Model S/X | 19,489 |
19,225 |
|
Total |
479,700 |
466,140 |
- In Q3 of 2023, there was around an 11.4% decrease in Tesla’s deliveries of electric vehicles.
- Almost 430,488 EVs were produced and 435,059 delivered because of the planned downtimes for factory updates.
Tesla Q3 Deliveries and Productions:
| Model | Production | Delivery |
|
Model 3/Y |
416,800 | 419,074 |
| Model S/X | 13,688 |
15,985 |
|
Total |
430,488 |
435,059 |
- In Q4 2023, Tesla produced 495,989 vehicles and delivered almost 484,507 vehicles.
- By the last quarter of 2023, Tesla had cleared its 1.8 million vehicles target for 2023 by 45,985 vehicles.
Tesla Q4 Deliveries and Production:
| Model | Production | Delivery |
|
Other Models |
18,212 | 22,969 |
| Model 3/Y | 476,777 |
461,538 |
|
Total |
494,989 |
484,507 |
- Tesla’s carbon footprint from producing electric vehicles totaled 610,000 metric tons of CO2 in 2022.
- This includes emissions from their production processes (Scope 1) and from the electricity and heat they purchase (Scope 2).
- Tesla Statistics also show that the largest source of Tesla’s emissions, accounting for 27%, comes from activities like mining and manufacturing batteries.
- Another 18% of emissions are attributed to aluminum and 8% to steel.
- “All other” sources, such as transportation, distribution, employee commuting, and business travel, make up 47% of Tesla’s emissions.
- Additionally, the use of Tesla vehicles by customers generated 3.4 million metric tons of CO2 emissions in 2022.
You May Also Like To Read
- Ferrari Statistics
- Fiat Statistics
- Ford Statistics
- General Motors Statistics
- Honda Statistics
- Hyundai Statistics
- Infiniti Statistics
- Isuzu Statistics
- Jaguar Statistics
- Jeep Statistics
- Kia Statistics
Tesla Revenue Statistics
- Tesla earned USD 419 billion from selling cars in 2023, a 15% increase from the USD 71.462 billion earned in 2022.
- Tesla’s revenue from energy generation and storage hit a record high of USD 6.035 billion in 2023.
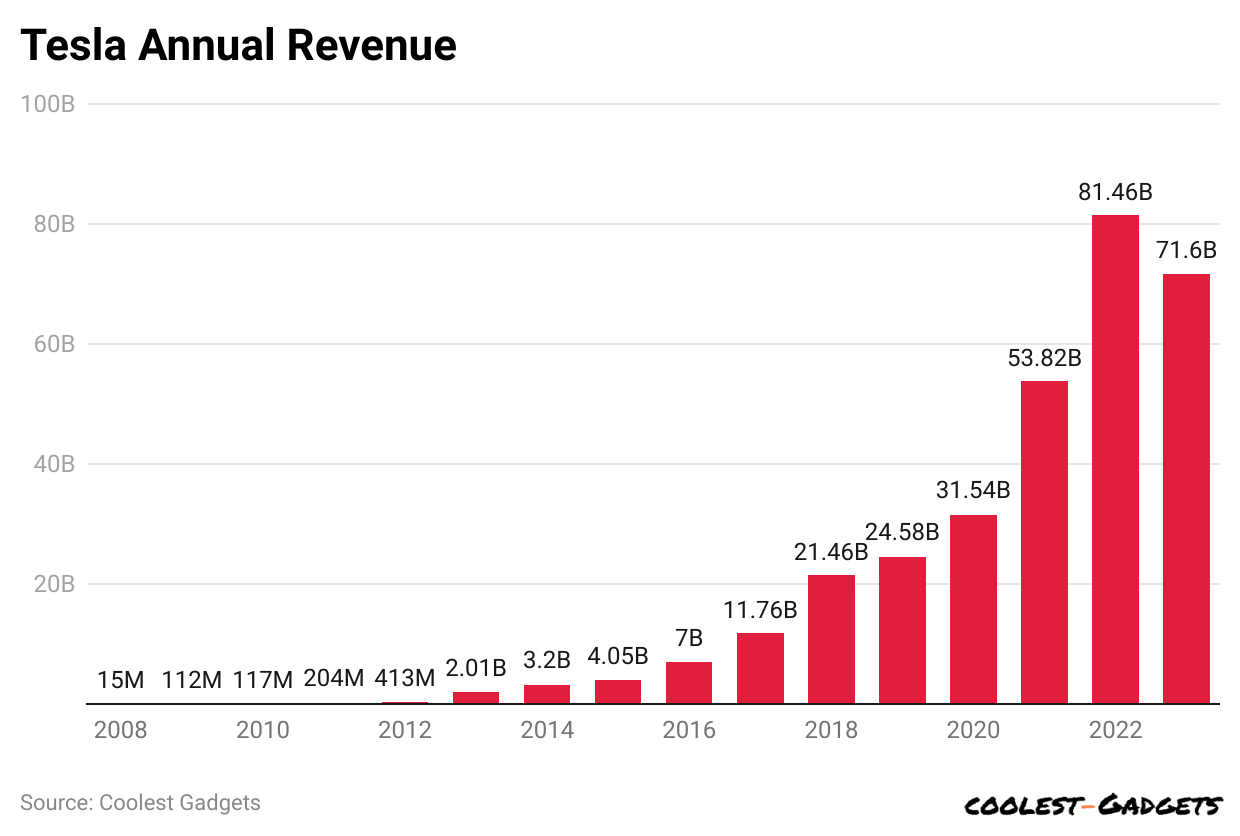
(Reference: backlinko.com)
| Year | Annual Revenue |
| 2023 |
USD 71.6 billion |
|
2022 |
USD 81.46 billion |
| 2021 |
USD 53.82 billion |
|
2020 |
USD 31.54 billion |
| 2019 |
USD 24.58 billion |
|
2018 |
USD 21.46 billion |
| 2017 |
USD 11.76 billion |
|
2016 |
USD 7 billion |
| 2015 |
USD 4.05 billion |
|
2014 |
USD 3.2 billion |
| 2013 |
USD 2.01 billion |
|
2012 |
USD 413 million |
| 2011 |
USD 204 million |
|
2010 |
USD 117 million |
| 2009 |
USD 112 million |
|
2008 |
USD 15 million |
- Revenue from services and other sources totaled USD 319 billion in 2023, marking a 37% increase from USD 6.091 billion in the previous year, as per Tesla Statistics.
- In 2023, Tesla earned USD 790 billion from selling carbon credits. Quarterly sales were USD 521 million in Q1, USD 282 million in Q2, USD 554 million in Q3, and USD 433 million in Q4.
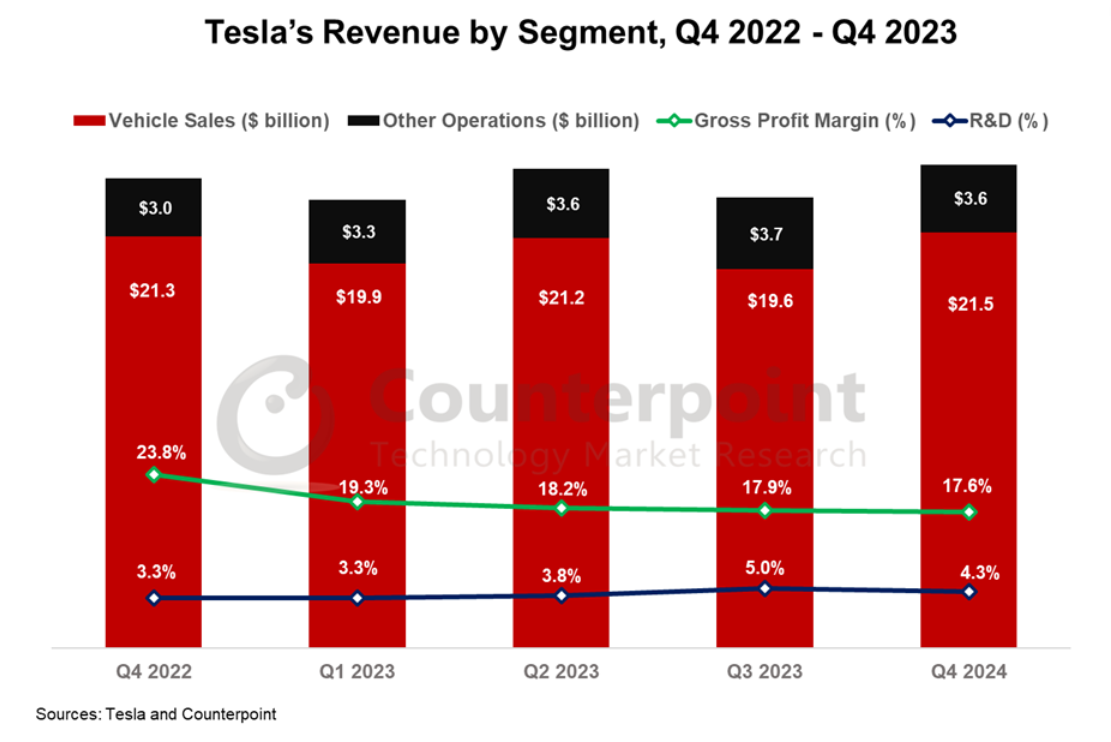
(Source: buyacar.co.uk)
- In the fourth quarter of 2023, Tesla’s automotive sector revenue increased slightly by 1% year over year to approximately USD 21.5 billion despite a roughly 20% increase in vehicle deliveries.
- As per Tesla Statistics, this growth was limited by lower prices for the Model Y and Model 3 in China and the US.
- Revenue from other ventures, such as energy storage deployment, charging networks, and additional services, rose 20% year over year to USD 3.6 billion.
- During Q4 2023, Tesla installed 41 megawatts (MW) of solar panels and deployed 3.2 gigawatt-hours (GWh) of energy storage.
- Tesla Statistics further determined that Tesla’s gross profit for Q4 2023 was USD 4.4 billion, a 23% decline from the same quarter last year.
- For the entire year of 2023, Tesla’s overall gross profit decreased by 15%, mainly due to several vehicle price reductions and lower-than-expected revenue from Full Self-Driving (FSD) features.
Tesla’s quarter revenue for 2023:
| Q1 | Q2 | Q3 | Q4 |
|
23,329 |
24,927 | 23,350 |
25,167 |
- On Tuesday, April 23, 2024, Tesla announced its first-quarter earnings. The company reported earnings per share (EPS) of USD 0.45, which missed the analyst estimate of USD 0.49 by USD 0.04.
- Revenue for the quarter was USD 21.3 billion, below the expected consensus of USD 22.27 billion.
Tesla Stock Market Statistics
- Valuation Measures
| Current | 3/31/2024 | 12/31/2023 | 9/30/2023 | 6/30/2023 | 3/31/2023 | |
|
Enterprise Value/EBITDA |
47.28 | 36.52 | 47.31 | 44.03 | 47.98 | 36.30 |
| Enterprise Value/Revenue | 6.89 | 5.58 | 8.05 | 8.26 | 9.46 |
7.87 |
|
Price/Book |
10.40 | 8.95 | 14.80 | 15.56 | 17.29 | 14.71 |
| Price/Sales | 7.73 | 6.33 | 9.02 | 9.25 | 10.57 |
8.85 |
|
PEG Ratio (5yr expected) |
3.74 | 2.07 | 2.91 | 2.13 | 2.89 | 1.89 |
| Forward P/E | 84.75 | 56.82 | 70.92 | 55.25 | 76.34 |
54.05 |
|
Trailing P/E |
53.67 | 40.88 | 80.15 | 71.29 | 76.99 | 57.31 |
| Enterprise Value | 652.33B | 540.33B | 772.01B | 776.93B | 814.03B |
641.00B |
|
Market Cap |
669.28B | 559.85B | 789.90B | 794.20B | 830.86B |
657.44B |
- Stock Price History
|
200-Day Moving Average |
205.92 |
| 50-Day Moving Average |
177.66 |
|
52 Week Low |
138.80 |
| 52 Week High |
299.29 |
|
S&P 500 52-Week Change |
23.12% |
| 52 Week Range |
-25.71% |
|
Beta (5Y Monthly) |
2.32 |
- Share Statistics
|
Shares Short (prior month 5/15/2024) |
104.79 M |
| Short % of Shares Outstanding (6/14/2024) |
3.30% |
|
Short % of Float (6/14/2024) |
3.80% |
| Short Ratio (6/14/2024) |
1.44 |
|
Shares Short (6/14/2024) |
105.38 M |
| % Held by Institutions |
45.96% |
|
% Held by Insiders |
12.99% |
| Float |
2.77B |
|
Implied Shares Outstanding |
3.19B |
| Shares Outstanding |
3.19B |
|
Avg Vol (10 days) |
82.26M |
| Avg Vol (3 months) |
88.56M |
- Dividend & Splits
|
Last Split Date 3 |
8/05/2022 |
| Last Split Factor 2 |
3:1 |
|
Ex-Dividend Date 4 |
— |
| Dividend Date 3 |
— |
|
Payout Ratio 4 |
0.00% |
| 5-Year Average Dividend Yield 4 |
— |
|
Trailing Annual Dividend Yield 3 |
0.00% |
| Trailing Annual Dividend Rate 3 |
0.00 |
|
Forward Annual Dividend Yield 4 |
— |
| Forward Annual Dividend Rate 4 |
— |
Tesla United States of America Statistics
- Tesla leads the electric vehicle market in the United States. In 2022, Tesla sold 354,822 vehicles in the US, a 53% increase from 234,000 vehicles in 2021. The Tesla Model Y was the top-selling electric vehicle, with 195,447 units sold, followed by the Model 3 with 143,728 units.
- As mentioned in Tesla Statistics, Tesla was the first electric vehicle manufacturer to surpass 190,000 sales in a year in the US, ahead of General Motors and others in the industry, according to Tesla Statistics.
- The Model Y is known for its practicality and stylish design, making it a popular choice among families and individuals looking for a dependable electric SUV.
- Its impressive performance also appeals to those who prioritize speed and agility.
- As Tesla’s best-selling model by a wide margin, the Model Y has become one of the most sought-after vehicles globally.
- Following, we can see the table that shows the sales of Tesla for the US automotive industry, but this time, it is divided by month:
| Year | Jan | Feb | Mar | Apr | May | Jun | Jul | Aug | Sep | Oct | Nov | Dec |
|
2024 |
51,809 | 51,809 | 53,881 | 0 | 0 | 0 | 0 | 0 | 0 | 0 | 0 | 0 |
| 2023 | 55,922 | 53,685 | 60,395 | 58,415 | 56,169 | 58,415 | 49,680 | 53,653 | 51,666 | 56,579 | 56,579 |
58,842 |
|
2022 |
37,594 | 36,202 | 89,575 | 40,568 | 39,066 | 39,066 | 37,518 | 38,962 | 37,518 | 46,667 | 44,800 | 48,533 |
| 2021 | 21,120 | 21,120 | 23,760 | 24,751 | 23,799 | 24,751 | 28,350 | 27,301 | 28,350 | 26,232 | 26,232 |
26,232 |
|
2020 |
22,350 | 20,450 | 10,000 | 6,624 | 14,720 | 15,456 | 48,846 | 43,418 | 47,036 | 21,591 | 17,736 | 24,675 |
| 2019 | 8,325 | 7,650 | 14,625 | 11,925 | 16,350 | 25,025 | 15,650 | 16,025 | 23,025 | 18,612 | 19,301 |
18,612 |
|
2018 |
6,875 | 7,485 | 8,820 | 6,150 | 11,250 | 11,062 | 16,675 | 21,700 | 29,975 | 20,325 | 24,600 | 32,600 |
| 2017 | 2,800 | 3,000 | 3,000 | 4,400 | 4,400 | 4,400 | 4,400 | 4,400 | 4,517 | 4,545 | 4,745 |
5,460 |
|
2016 |
2,075 | 2,150 | 2,250 | 2,250 | 2,250 | 2,250 | 2,250 | 2,250 | 2,250 | 2,250 | 2,250 | 2,250 |
| 2015 | 0 | 2,000 | 1,200 | 1,700 | 1,700 | 1,700 | 1,700 | 1,700 | 1,700 | 1,730 | 1,712 |
1,900 |
- Tesla’s yearly sales, growth, and market share in the United States of America:
|
Year |
Sales | YOY change | US Market Share |
Market share change |
|
2024 |
157,499 | – | 2.96 | 0.00 |
| 2023 | 670,000 | 24.98 | 4.31 |
9.18 |
|
2022 |
536,069 | 77.51 | 3.92 | 48.43 |
| 2021 | 301,998 | 3.11 | 2.02 |
1.40 |
|
2020 |
292,902 | 50.11 | 1.99 | 42.53 |
| 2019 | 195,125 | -1.21 | 1.14 |
0.67 |
|
2018 |
197,517 | 294.51 | 1.14 | 74.51 |
| 2017 | 50,067 | 87.34 | 0.29 |
47.5 |
|
2016 |
26,725 | 42.59 | 0.15 | 29.49 |
| 2015 | 18,742 | – | 0.11 |
0.00 |
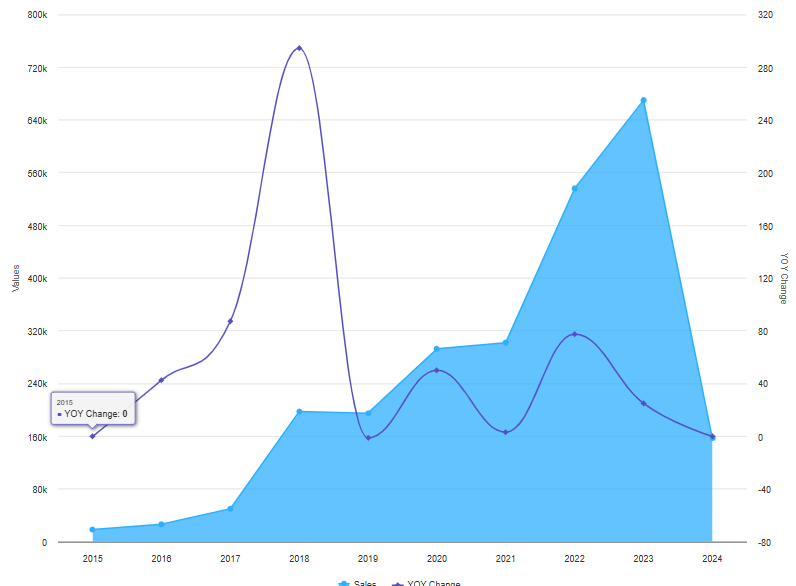
(Source: goodcarbadcar.net)
- The above chart visually represents Tesla’s US sales units over the years.
- Tesla offers a range of vehicles, including a small sedan, a crossover, a premium executive car, a large people carrier, and the distinctive CyberTracker pickup. This lineup provides options for different consumer needs.
- As per Tesla Statistics, the Tesla Model Y is a midsize SUV powered by an electric motor. It can travel up to 330 miles on a single charge and accelerates from 0 to 60 mph in 4.8 seconds.
- The Model Y comes with all-wheel drive, which ensures strong traction in all weather conditions.
- The Tesla market capital will be almost USD 789.89 billion in 2024, as per Tesla Statistics.
- The organization experienced a 783.42% growth in its market cap in 2020. The market capital grew from USD 75.71 billion in 2019 to USD 668.90 billion in 2020.
- Tesla’s market cap was USD 789.89 in January 2024.
- In 2023, the market capital grew by 95.56%, according to Tesla Statistics.
| Year | Tesla Market Capital |
|
2017 |
USD 52.32 billion |
| 2018 |
USD 57.44 billion |
|
2019 |
USD 75.71 billion |
| 2020 |
USD 668.90 billion |
|
2021 |
USD 1.061 trillion |
| 2022 |
USD 388.97 billion |
|
2023 |
USD 760.68 billion |
| 2024 |
USD 789.89 billion |
- There was a decrease of 3% and 5% in the last quarter compared to Q1 2023.
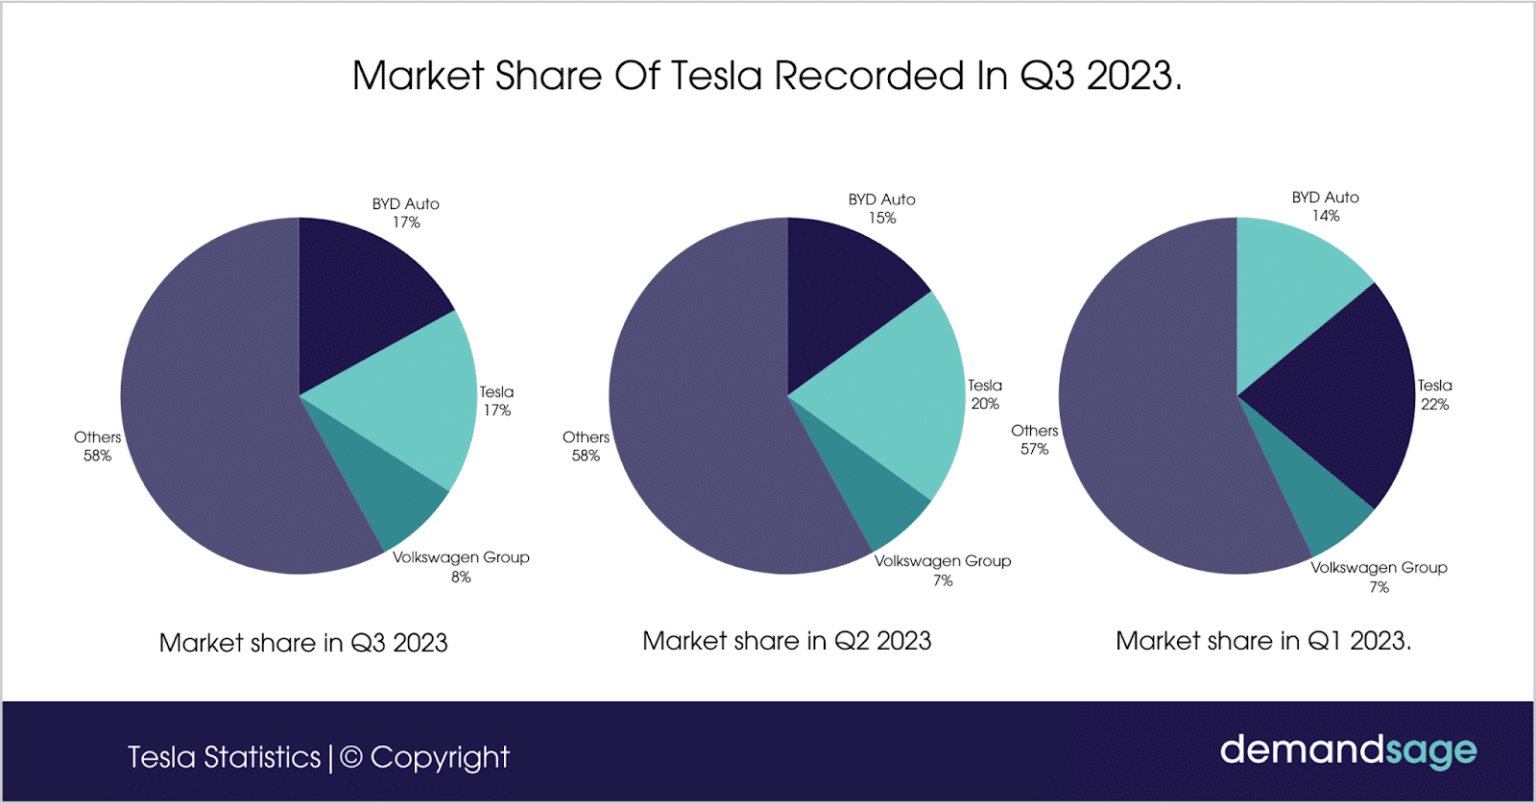
- In Q1 2023, Tesla had an almost 22% share of the worldwide electric vehicle market. This share decreased to almost 20% in Q2 2023 and 17% in Q3 2023.
(Source: demandsage.com)
- In the table below, we can see further details about the market share of Tesla in the third quarter of 2023:
| Electric Vehicle Group | Market share in Q3 2023 | Market share in Q2 2023 | Market share in Q1 2023 |
|
Volkswagen Group |
8% | 7% | 7% |
| Tesla | 17% | 20% |
22% |
|
BYD Auto |
17% | 15% | 14% |
| Others | 58% | 58% |
57% |
- Tesla’s share of the Electric Vehicle Market has dropped down to almost 50% in Q3 of 2023 in the United States.
- Tesla Statistics elaborated that Tesla holds about 4.04% of the U.S. automobile market.
- In comparison, BMW has a 2.72% share, while Volkswagen stands at 3.6%. Subaru is slightly ahead of Tesla with 4.19%, and Nissan holds 6.14%.
- Honda has a 7.35% market share, while Hyundai Kia controls 10.94%.
- Stellantis – FCA follows with 11.66%, and Ford owns 13.92% of the market.
- Toyota’s is even higher at 15.17%, while General Motors leads with the largest share of 17.09%.
Tesla Vehicles Delivered Statistics
(Reference: statista.com)
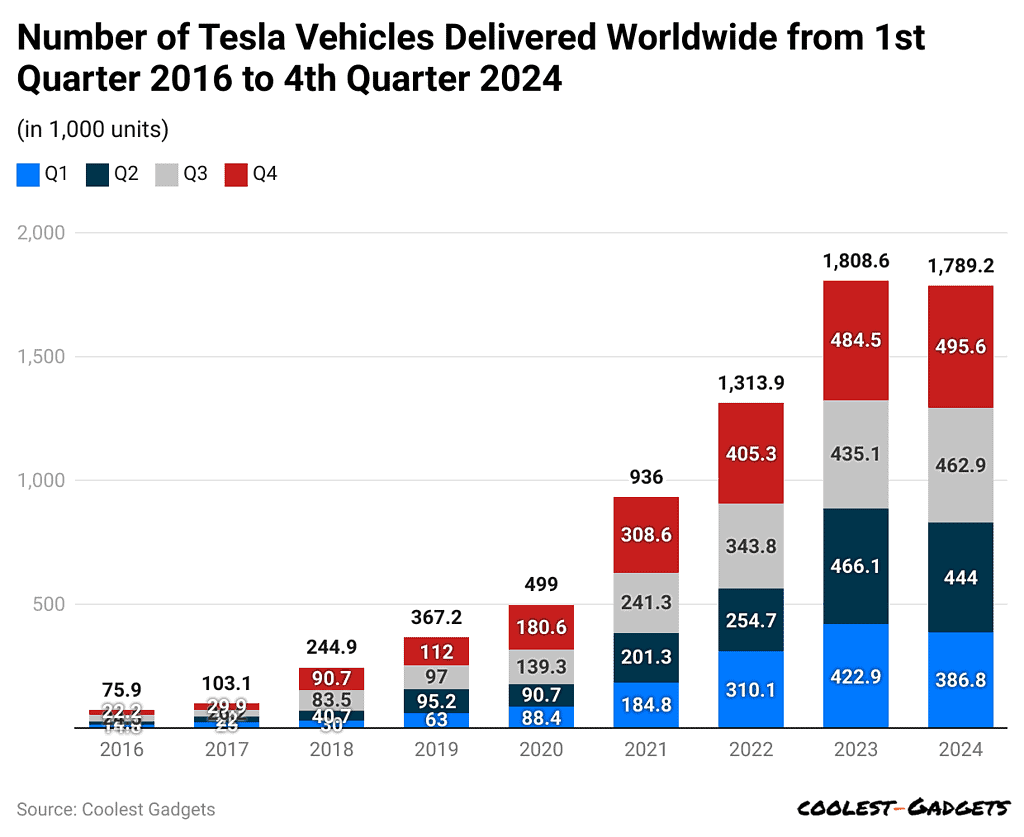
- Q1 2024: Delivered over 386,800 vehicles, marking a 20.2% decrease from the previous quarter.
- Q2 2024: Deliveries declined to approximately 369,800 units, indicating a continued downward trend.
- Q3 2024: Deliveries rose to about 439,800 vehicles, showing a recovery from earlier declines.
- Q4 2024: Tesla delivered around 495,600 vehicles globally, a 7.1% increase from the previous quarter.
- For the Full Year 2024, Total deliveries reached approximately 1,789,226 vehicles, a slight decrease of 1.07% compared to 2023.
- U.S. Market Share: In Q4 2024, Tesla’s share of the U.S. electric vehicle market fell to 44%, reflecting increased competition.
| Automobile Brand | Market share |
|
BMW Group |
2.72% |
| Volkswagen Group |
3.6% |
|
Tesla |
4.04% |
| Subaru Corporation |
4.19% |
|
Nissan Motor Co |
6.14% |
| Honda Motor Company |
7.35% |
|
Hyundai Kia Auto Group |
10.94% |
| Stellantis – FCA |
11.66% |
|
Ford Motor Company |
13.92% |
| Toyota Motor Corp |
15.17% |
|
General Motors |
17.09% |
Tesla Statistics By Region
- In 2024, Tesla produced 1,773,443 vehicles, of which 1.68 million were Model 3/Y units and 94,105 were other models, such as Model X/S, Cybertruck, and Semi.
- In January 2025, Tesla’s sales in Europe declined by nearly 50%, and its market share dropped to 1% from 1.8% the previous year.
- In 2024, Tesla produced approximately 480,309 vehicles in China.
- In 2023, Tesla sold 16,416 vehicles in Australia.
- China comes in second globally for Tesla sales, right after the United States.
- The most popular Tesla model in China was the Model Y, with 456,394 units sold, making it the second-best-selling EV in the country. BYD’s Song, particularly its plugin hybrid electric vehicle (PHEV) version, topped the EV sales charts with 627,731 units sold.
- Tesla’s sales were led by 34,495 Model Y and 12,944 Model 3 vehicles. As per Tesla statistics, The less popular Model X and Model S saw only 55 and 67 units sold respectively as per Tesla Statistics.
- Additionally, 278 Tesla EVs were registered under an “Unknown” category.
- The pure electric version of the BYD Song sold 92,983 units in 2023.
- Tesla also had strong sales with its Model 3, selling 146,910 units in China during the year.
- China has shown a quick embrace of Tesla vehicles despite Tesla’s recent entry into the market there. This highlights China’s substantial role in the worldwide electric vehicle market as per Tesla Statistics.
- In 2023, Tesla sold 47,840 electric vehicles (EVs) in the UK, making it the leading automaker with a 15.2% share of the EV market. MG, Tesla’s closest competitor at number two, sold 28,992 EVs, capturing a 9.2% market share.
- In the first five months of 2024, Tesla sold 16,272 cars in the UK. This represents a 12.55% decrease compared to the 18,607 cars sold in the same period in 2023.
Tesla 2023 sales in the United Kingdom by model:
| Model S | Model X | Model 3 | Model Y | Unknown |
|
67 |
55 | 12,944 | 34,495 |
278 |
- In 2023, Tesla sold 25,376 electric vehicles (EVs) in Norway, leading with a 23.6% share of the EV market. Volkswagen came in second, selling 15,363 EVs and holding a 14.3% market share.
- The best-selling Tesla model in Norway was the Model Y, with 23,058 units sold in 2023. The Model 3 followed with 2,081 new registrations during the year.
| Model Y | Model X | Model 3 | Model S |
|
23,058 |
138 | 2081 |
99 |
- In 2023, Tesla had a 12% share of the German EV market, selling 63,682 vehicles. Volkswagen sold more EVs than Tesla in Germany, with 70,624 vehicles sold and a 13.5% market share.
| Model Y | Model X | Model 3 | Model S |
|
45,818 |
759 | 15,865 |
1,240 |
- In 2023, the Model Y was the most popular vehicle in France, with 37,127 units sold, and the Model 3 was the second most popular, with 24,539 units sold. In total, Tesla registered 62,711 new EVs in the country that year.
| Model Y | Model X | Model 3 | Model S |
|
37,127 |
138 | 2081 |
99 |
- In 2023, Tesla became the top-selling automaker in Italy, capturing a 24.9% share of the market by selling 16,633 vehicles.
| Model Y | Model X | Model 3 | Model S |
|
8,587 |
260 | 7,385 |
401 |
- In 2023, Tesla sold 20,501 vehicles in Sweden, making it the top-selling EV automaker with a 17.4% market share.
- Volkswagen was Tesla’s closest competitor at number two, selling 17,760 EVs and holding a 15.1% market share for the year.
| Model Y | Model X | Model S | Model 3 |
|
16,576 |
367 | 548 |
3,010 |
- In 2023, Tesla accounted for 17.6% of the Belgian EV market, selling 12,065 vehicles.
| Model Y | Model X | Model S | Model 3 |
|
8,980 |
315 | 299 |
2,471 |
- In 2023, Tesla captured a 22% share of Spain’s EV market by selling 13,260 vehicles. Of these, 6,843 were Tesla Model Ys, and 6,123 were Model 3s.
- In Spain, MG was the nearest competitor to Tesla, selling 4,070 vehicles and securing a 6.7% market share, according to Tesla Statistics.
- In 2023, Tesla sold 603,304 electric vehicles (EVs) in China. Despite this achievement, they faced tough competition from BYD, which sold 1,262,065 battery electric vehicles (BEVs).
- In 2023, Tesla reached the second position in EV sales in China, holding a 7.5% market share. BYD led with a 33.8% market share. Tesla had previously held the third position for three consecutive years.
You May Also Like To Read
- Audi Statistics
- Alfa Romeo Statistics
- Aston Martin Statistics
- Bentley Statistics
- BMW Statistics
- Bugatti Statistics
- Chevrolet Statistics
- Citroën Statistics
- Daihatsu Statistics
Tesla Charging Station Market Size Statistics
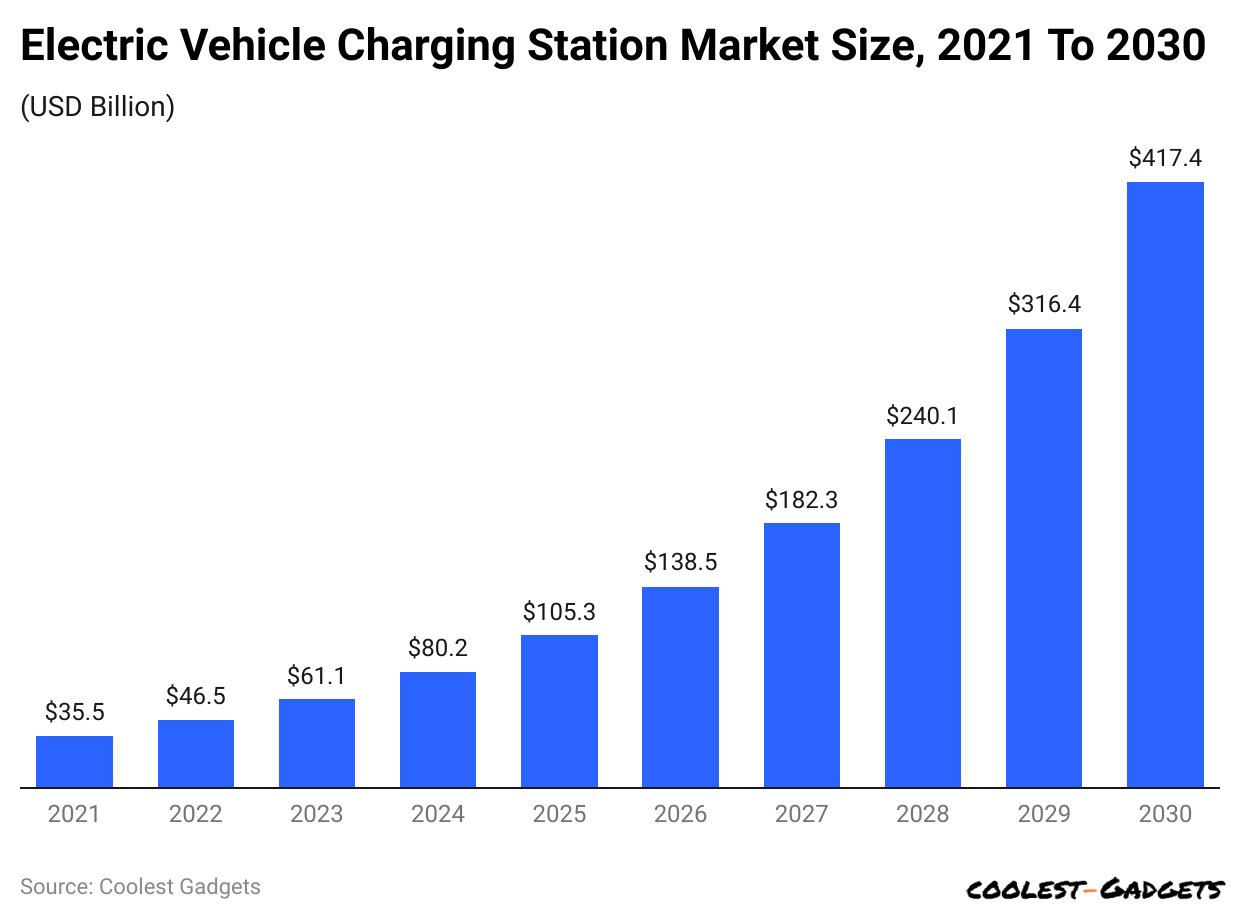
- The electric vehicle charging station market is rapidly expanding. In 2021, it was valued at $35.50 billion.
- By 2022, it had grown to $46.54 billion. Growth is expected to accelerate in the coming years: in 2023, it is projected to reach $61.06 billion, marking an increase of approximately 31%.
- This growth trend continues with further increases forecasted: $80.17 billion in 2024, $105.34 billion in 2025, and $417.35 billion by 2030. These figures highlight the substantial growth and investment in infrastructure to support electric vehicles globally.
(Reference: enterpriseappstoday.com)
- In 2021, Tesla’s electric vehicles, Model Y and Model 3, led the US market.
- Model Y sold 185,994 units, holding a 29.5% share, while Model 3 sold 147,460 units, capturing a 23.4% share.
- As stated by Tesla Statistics, Ford’s Mustang Mach E followed with 27,140 units sold, representing 4.3% of total electric vehicle (EV) sales.
- The Chevy Bolt EV/EUV had 24,828 sales, accounting for 3.9% of the market. Volkswagen’s ID.4 sold 16,742 units, making up 2.7% of total EV sales.
- Tesla’s Model S sold 15,545 units, with a 2.5% market share as per Tesla Statistics.
- Other notable EVs included the Nissan Leaf with 14,239 units (2.3%), the Porsche Taycan with 9,419 units (1.5%), the Tesla Model X with 7,985 units (1.3%), and the Audi e-Tron with 7,429 units (1.2%).
- These figures highlight the distribution of sales and market shares among leading electric vehicle models in the US for 2021.
| EV Model | Sales in 2021 | % of 2021 US EV Sales |
|
Aude e-tron |
7,429 | 1.2% |
| Tesla Model X | 7,985 |
1.3% |
|
Porsche Taycan |
9,419 | 1.5% |
| Nissan Leaf | 14,239 |
2.3% |
|
Tesla Model S |
15,545 | 2.5% |
| Volkswagen ID.4 | 16,742 |
2.7% |
|
Chevy Bolt EV/EUV |
24,828 | 3.9% |
| Ford Mustang Mach | 27,140 |
4.3% |
|
Tesla Model 3 |
147,460 | 23.4% |
| Tesla Model Y | 185,994 |
29.5% |
Recent Developments of Tesla
- As of March 10, 2025, Tesla’s stock has fallen nearly 50% over the past three months, primarily due to declining vehicle sales and profits, as well as investor concerns over CEO Elon Musk’s political activities.
- Market Position: Tesla’s market share is shrinking, especially in China and Europe, leading to a 40% drop in stock value from its post-U.S. election high.
- Vehicle Deliveries: Analysts anticipate Tesla’s first-quarter deliveries to be around 369,400 vehicles, which is 16% below Wall Street’s estimate of 437,500.
- Product Development: Tesla is developing a next-generation vehicle platform, often referred to as the “USD 25,000 Tesla,” with production expected to begin by mid-2025.
- Autonomous Driving: As of January 2025, Tesla customers have driven 3 billion miles using the Full Self-Driving (FSD) feature, and AI training capacity increased 400% in 2024.
- Model Y Update: In January 2025, Tesla introduced a redesigned Model Y in China. It features a full-width light bar, extended range, and a rear-seat touchscreen, and deliveries start in March.
Conclusion
Tesla continues to shape the future of electric vehicles with its innovative technology, ambitious goals, and industry-leading advancements. Despite facing challenges such as production delays, regulatory scrutiny, and increasing competition, the company remains a dominant force in the EV market. Tesla’s commitment to sustainable energy, cutting-edge autonomous driving features, and expanding global presence reinforce its position as a pioneer in the automotive industry.
As the demand for electric mobility grows, Tesla’s ability to innovate and adapt will be key to its long-term success, making it a crucial player in the transition toward a more sustainable transportation landscape.
Sources
Pramod Pawar brings over a decade of SEO expertise to his role as the co-founder of 11Press and Prudour Market Research firm. A B.E. IT graduate from Shivaji University, Pramod has honed his skills in analyzing and writing about statistics pertinent to technology and science. His deep understanding of digital strategies enhances the impactful insights he provides through his work. Outside of his professional endeavors, Pramod enjoys playing cricket and delving into books across various genres, enriching his knowledge and staying inspired. His diverse experiences and interests fuel his innovative approach to statistical research and content creation.