Powerball Statistics By Countries, Demographics, Device And Website

Updated · Apr 14, 2025


TABLE OF CONTENTS
- Introduction
- Editor’s Choice
- General Powerball Statistics
- Powerball Statistics by Number Draw Frequencies
- Common Powerball Numbers and Pairs Statistics, 2025
- The Most Powerball Winners Statistics by States
- Powerball Statistics by Players Demographics
- Powerball Sales Statistics by U.S. States between January and February 2025
- Powerball Website Statistics
- powerball.com Website Traffic Statistics by Country
- By Demographics
- By Traffic Sources
- By Device
- Conclusion
Introduction
Powerball Statistics: Powerball is a favorite lottery game across the U.S., with millions of people playing for a shot at huge prizes each week. While luck plays a big role, there’s more to it as some patterns and stats appear in the numbers.
By checking old results, we can spot which numbers are picked often or rarely appear and how often jackpots are hit. In this article, we’ll break down Powerball stats simply. Whether you’re just curious or want to boost your chances, these tips will help you see how the game works. Remember, it’s all still chance—but knowing a few facts might help.
Editor’s Choice
- Powerball Statistics states that on March 29, 2025, a single ticket in California won a USD 526.5 million jackpot.
- On January 18, 2025, a player in Oregon secured a USD 328.5 million jackpot.
- As of April 9, 2025, the numbers 21 and 61 have appeared 108 times since October 7, 2015.
- The number 24 has been drawn 45 times as the Powerball since October 7, 2015.
- From January 1 to April 9, 2025, there were 42 Powerball drawings, and the jackpot rolled over 40 times.
- Powerball Statistics also show that the jackpot rolled over 40 times between January 1 and April 9, 2025.
- In the same period, the combined total of all advertised jackpots was approximately USD 4.5 billion.
- The average advertised jackpot during this period was around USD 107 million.
- As of April 2025, almost USD 100,000 in Winneticketsket purchased in Minnesota remains unclaimed.
- Over 10 million winning tickets have been sold across all prize tiers in 2025.
General Powerball Statistics
- Powerball began in 1992 and is available in 45 U.S. states, the District of Columbia, Puerto Rico, and the U.S. Virgin Islands.
- The biggest Powerball win ever was USD 2.04 billion in California on November 8, 2022.
- Powerball started in 1992 and has kept growing in sales every year since.
- You can buy Powerball tickets in 45 U.S. states, Washington, D.C., Puerto Rico, and the U.S. Virgin Islands.
- There are five U.S. states where you can’t play Powerball: Alabama, Alaska, Hawaii, Nevada, and Utah.
- Each Powerball ticket costs just USD 2, which makes it affordable and popular.
- The probability of winning the Powerball jackpot is approximately 1 in 292.2 million.
- Only half the money from ticket sales goes toward the prize pool and jackpots.
- About 35% of sales help support good causes and charities nationwide.
- According to Powerball Statistics, around 6% of ticket money pays the stores that sell them, and 9% goes toward running the Powerball system.
- If you win the jackpot, you can receive your money in one lump sum or 30 payments over 29 years.
- Your chance of winning any prize in Powerball is about 1 in 25.
- Approximately 56% of Powerball revenue is paid out as prizes to players.
- In 2023, New York led U.S. states with lottery sales totaling approximately USD 10.36 billion, followed by Florida with USD 9.32 billion and California with USD 8.86 billion.
- Surveys indicate that 44% of individuals are more inclined to play the lottery when jackpots are larger.
Powerball Statistics by Number Draw Frequencies
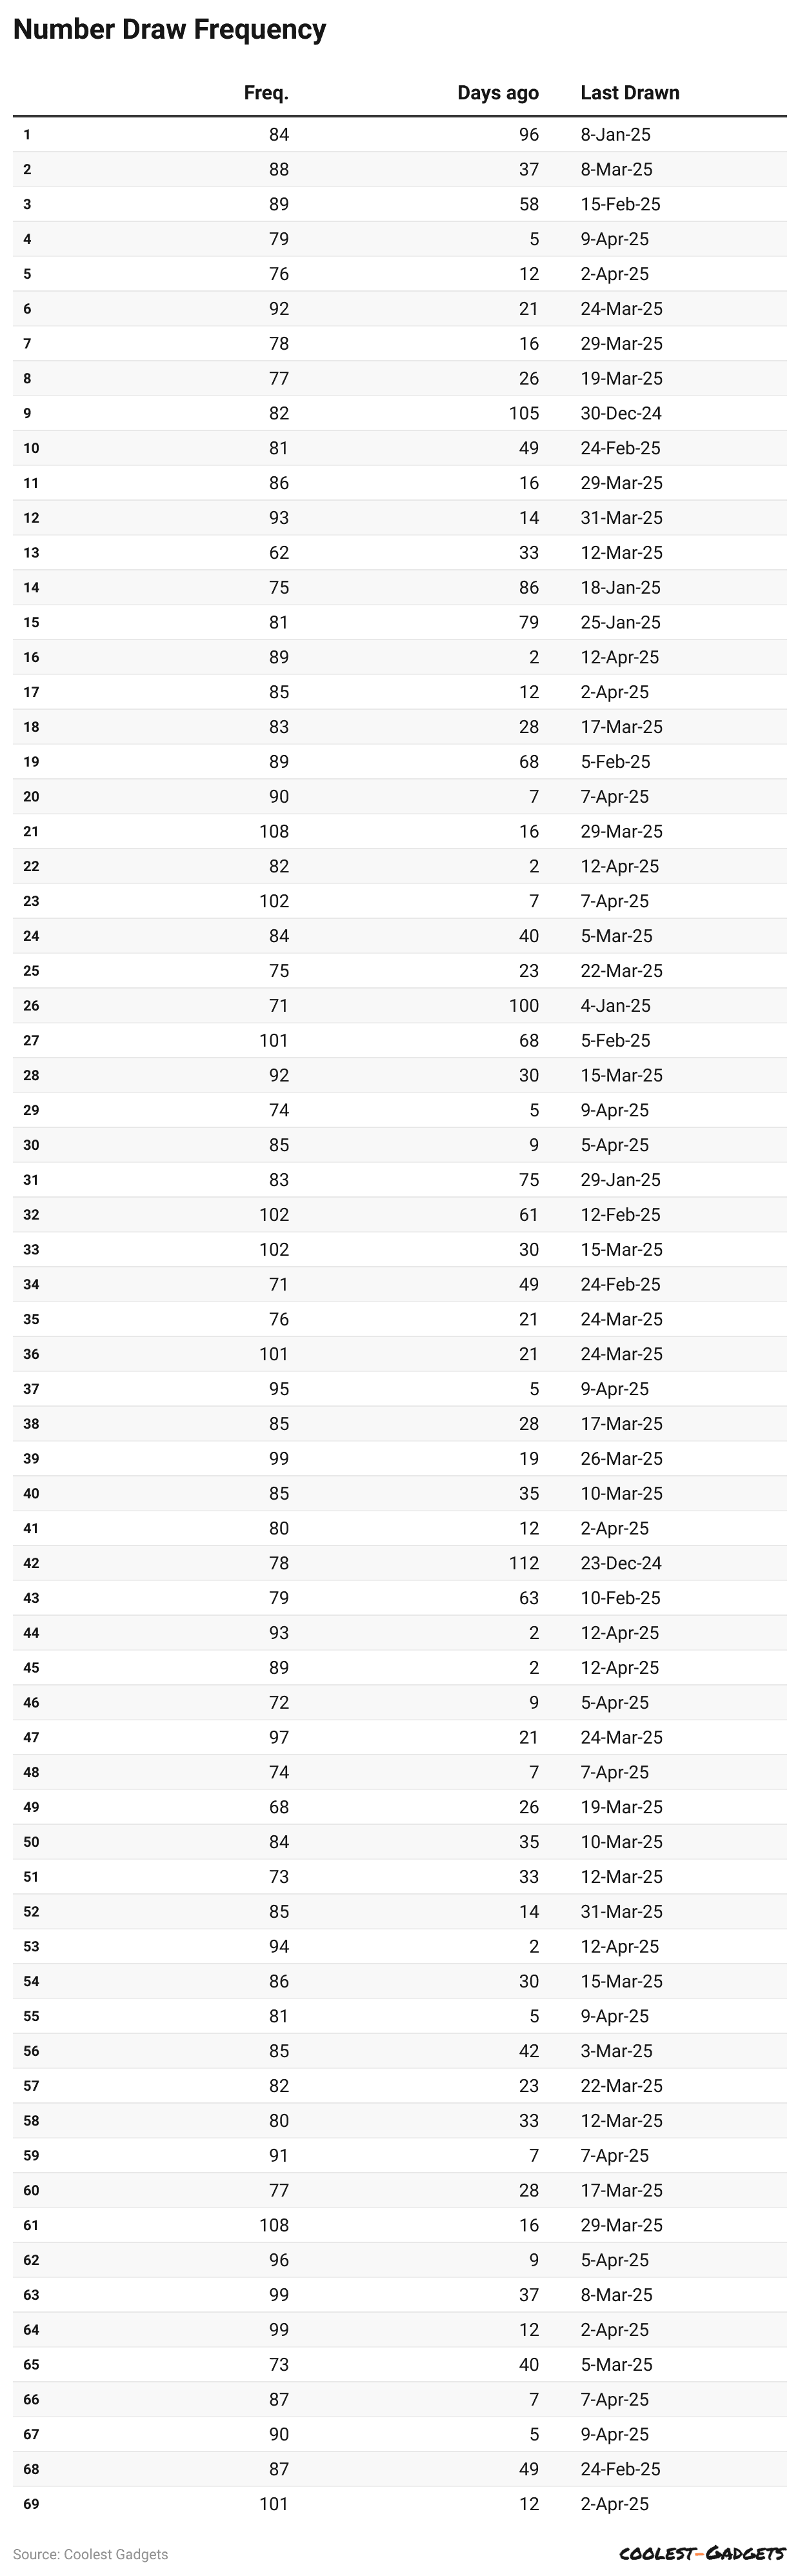
(Reference: lottoamerica.com)
Common Powerball Numbers and Pairs Statistics, 2025
|
Powerball Lottery |
|
| Main Ball Number |
Times Drawn |
|
39 |
348 |
| 32 |
342 |
|
36 |
339 |
| 23 |
315 |
|
16 |
336 |
| 26 |
336 |
|
Powerball Number |
Times Drawn |
| 18 |
120 |
|
20 |
117 |
| 6 |
115 |
|
9 |
115 |
| 24 |
115 |
|
Common Pairs |
Times Drawn |
| 21 + 32 |
14 |
|
37 + 44 |
14 |
| 12 + 21 |
12 |
|
8 + 27 |
12 |
| 27 + 44 |
10 |
|
51 + 61 |
12 |
| Consecutive Pairs |
Times Drawn |
|
21 + 22 |
10 |
| 1 + 2 |
10 |
|
61 + 62 |
9 |
| 62 + 63 |
9 |
|
66 + 67 |
8 |
| 58 + 59 |
8 |
The Most Powerball Winners Statistics by States
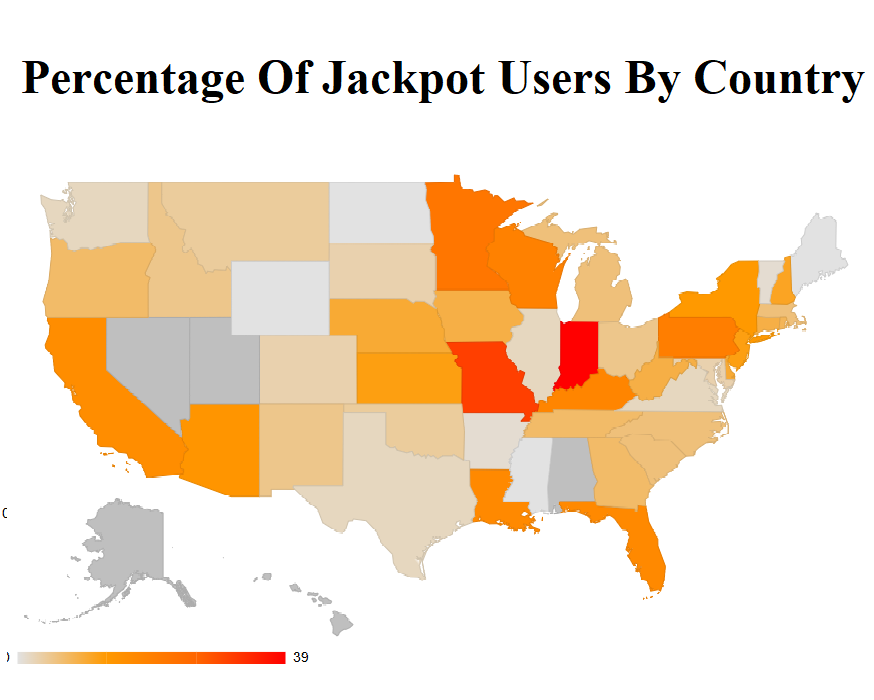 (Source: powerball.net)
| State | Jackpot Winners | Share of Total Jackpot Winners |
| Indiana | 39 |
9.4% |
|
Missouri |
31 | 7.5% |
| Minnesota | 22 |
5.3% |
|
Pennsylvania |
20 | 4.8% |
| Wisconsin | 19 |
4.6% |
|
Kentucky |
18 | 4.3% |
| Florida | 17 |
4.1% |
|
Louisiana |
17 | 4.1% |
| California | 16 |
3.8% |
|
Arizona |
14 | 3.4% |
| New York | 13 |
3.1% |
|
Kansas |
12 | 2.9% |
| New Jersey | 12 |
2.9% |
|
New Hampshire |
11 | 2.6% |
| Washington, D.C. | 11 |
2.6% |
|
Delaware |
10 | 2.4% |
| Nebraska | 10 |
2.4% |
|
Connecticut |
9 | 2.2% |
| Iowa | 9 |
2.2% |
|
West Virginia |
9 | 2.2% |
| Rhode Island | 8 |
1.9% |
|
Georgia |
7 | 1.7% |
| Oregon | 7 |
1.7% |
|
Tennessee |
7 | 1.7% |
| Massachusetts | 6 |
1.4% |
|
Michigan |
6 | 1.4% |
| North Carolina | 6 |
1.4% |
|
South Carolina |
6 | 1.4% |
| Idaho | 5 |
1.2% |
|
New Mexico |
5 | 1.2% |
| Ohio | 5 |
1.2% |
|
Montana |
4 | 1% |
| Oklahoma | 4 |
1% |
|
Colorado |
3 | 0.7% |
| Maryland | 3 |
0.7% |
|
South Dakota |
3 | 0.7% |
| Illinois | 2 |
0.5% |
|
Puerto Rico |
2 | 0.5% |
| Texas | 2 |
0.5% |
|
Virginia |
2 | 0.5% |
| Washington | 2 |
0.5% |
|
Arkansas |
1 | 0.2% |
| Vermont | 1 |
0.2% |
Powerball Statistics by Players Demographics
 (Source: searchlogistics.com)
- Around 57% of Americans, or about 181 million people, buy one or more lottery tickets yearly.
- A Journal of Gambling Studies study showed that 69% of people aged 31 to 40 buy lottery tickets.
- Next were 18 to 29-year-olds, with 66% of them buying tickets.
- So, 2 out of every 3 Americans between 18 and 40 play the lottery.
- People 61 or older are less likely to play; only about 54% buy tickets yearly.
- That’s around 13% fewer than younger adults aged 18 to 40.
- About 56% of people who earn between USD 36,000 and USD 89,999 per year play the lottery.
- For those earning over USD 90,000 a year, about 53% buy lottery tickets
- People who make less than USD 36,000 are less likely to play; only 40% of them do.
- On average, Americans spend USD 433 yearly on lottery tickets, but the highest earners spend about USD 193 per year.
Powerball Sales Statistics by U.S. States between January and February 2025
| State | Jackpot Amount | Powerball Sales (USD) |
|
Arkansas (AR) |
USD 220 million |
104,712 |
| Arizona (AZ) |
586,682 |
|
|
California (CA) |
2,911,834 | |
| Colorado (CO) |
308,278 |
|
|
Connecticut (CT) |
267,940 | |
| Florida (FL) |
1,216,646 |
|
|
Georgia (GA) |
615,328 | |
| Illinois (IL) |
577,372 |
|
|
Indiana (IN) |
263,774 | |
| Maryland (MD) |
406,458 |
|
|
Michigan (MI) |
538,606 | |
| Missouri (MO) |
267,644 |
|
|
New Jersey (NJ) |
1,216,646 | |
| New York (NY) |
2,911,834 |
|
|
Ohio (OH) |
615,328 | |
| Pennsylvania (PA) |
1,216,646 |
|
|
Texas (TX) |
2,911,834 |
Powerball Website Statistics
- According to Powerball Statistics, the site is ranked #14,460 among all websites worldwide.
- Meanwhile, in the United States, it holds the #2,742 position.
- Within the Lottery/Gambling category, it’s #5 in the U.S.
 (Reference: similarweb.com)
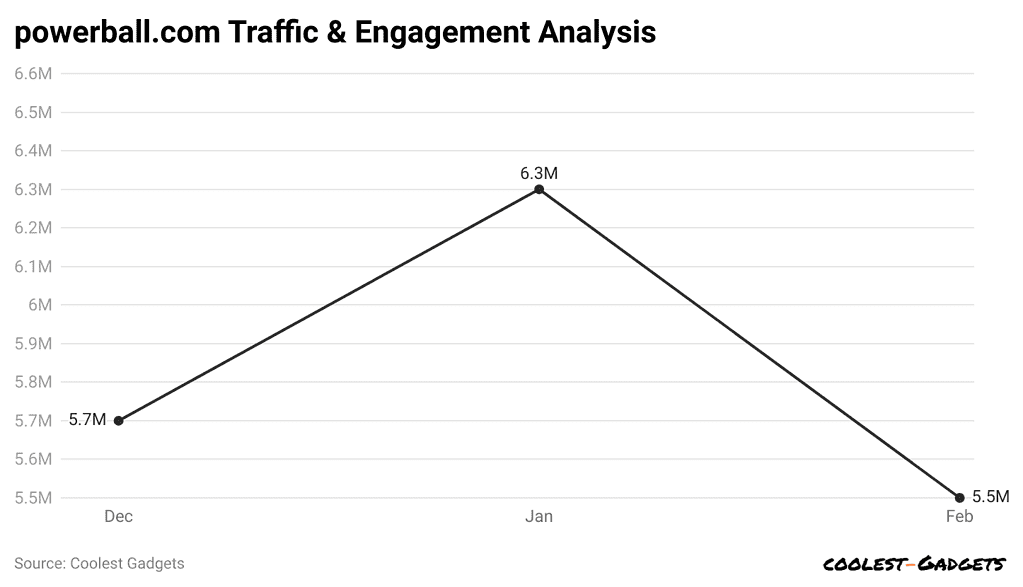
- As of February 2025, around 5.5 million people have visited the website, a decrease of 12.99% from last month.
- The bounce rate is 66.52%, which means many users leave the site quickly after visiting.
- On average, each visitor looks at 1.79 pages during one visit.
- Most people spend about 1 minute and 8 seconds on the site per visit.
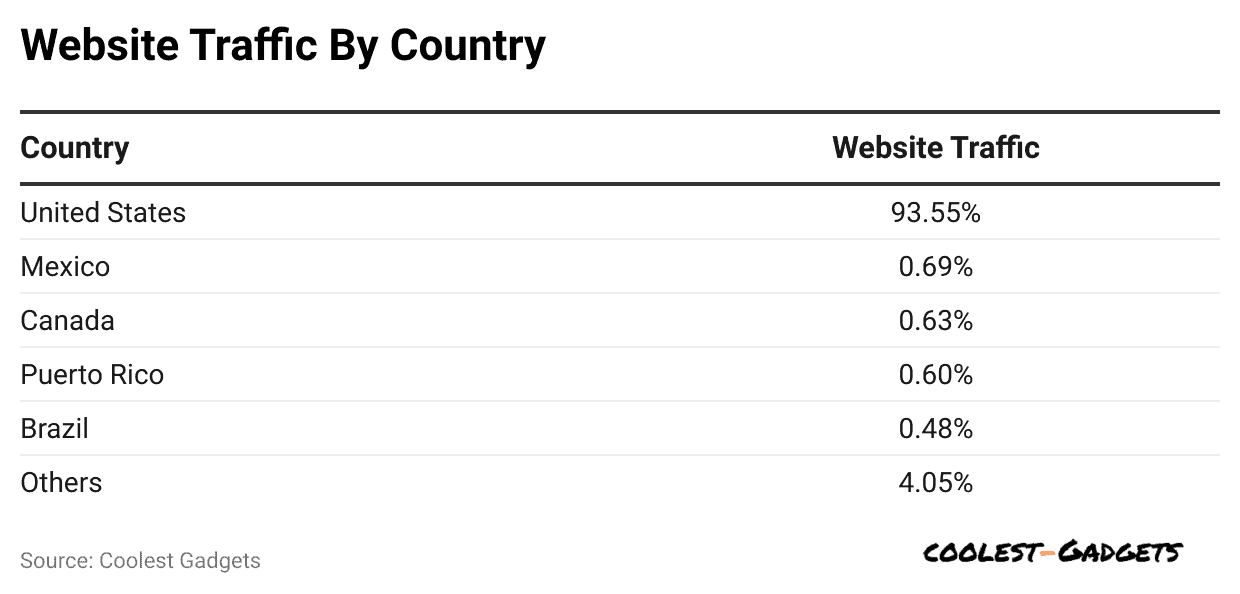
powerball.com Website Traffic Statistics by Country
 (Reference: similarweb.com)
- Powerball Statistics further state that in February 2025, most website visitors were from the United States (93.55% of all desktop traffic).
- Mexico was the second biggest source of visitors, sending 0.69% of the traffic.
- Visitors from Canada made up 0.63% of the traffic.
- Puerto Rico users sent around 0.60% of the site’s traffic.
- Brazil had about 0.48% of the total visitors.
- All other countries together made up 4.05% of the traffic.
By Demographics
 (Reference: similarweb.com)
- Most people visiting powerball.com are men; about 61 out of 100 visitors are male.
- Moreover, around 39 out of 100 visitors are female.
- That means men comprise 61.22% of the audience, and women comprise 38.78% of the total visitors.
- The gap between male and female visitors is over 22%.
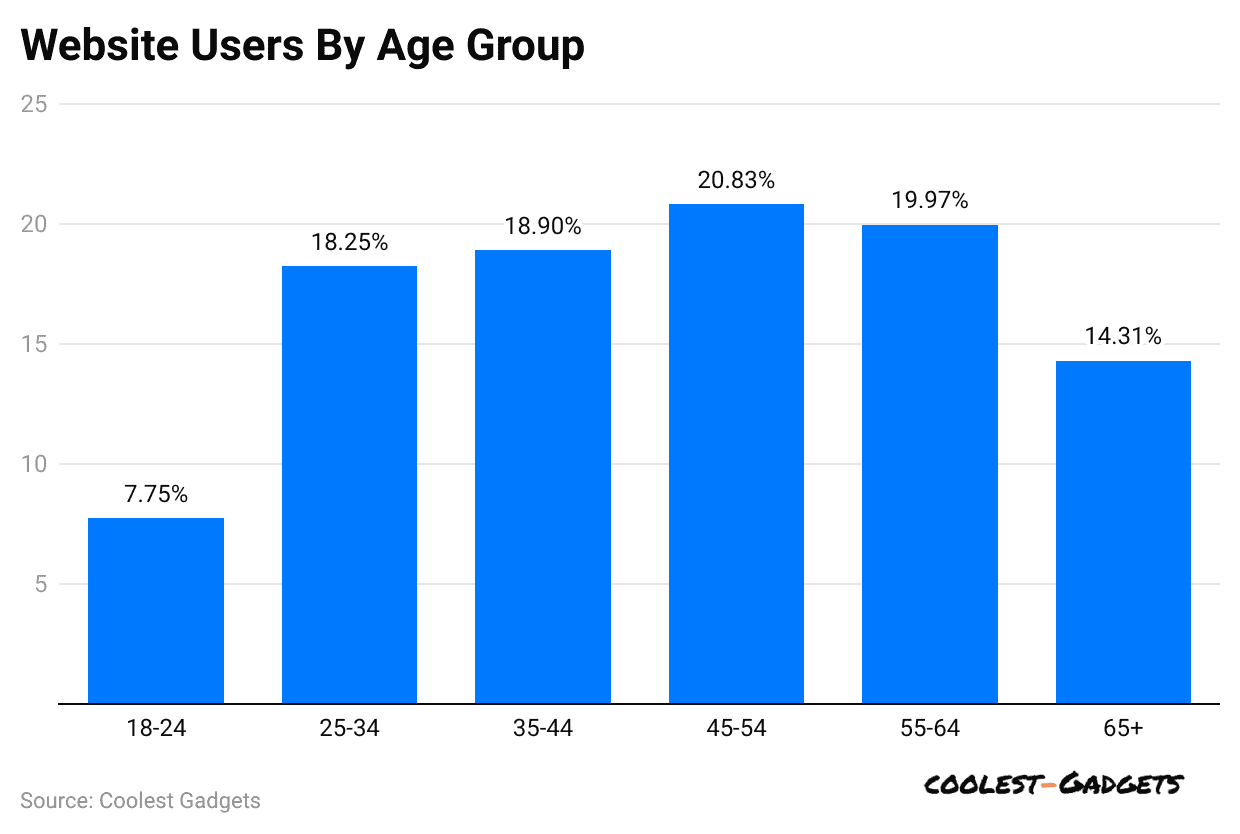
- Among Powerball website users, 20.83% are aged 45 to 54.
- In comparison, 19.97% are between 55 and 64 years old, while 18.9% are aged 35 to 44.
- Besides, only 18.25% of users are between 25 and 34 years old, followed by 14.31% above 65 years old and 7.75% between 18 and 24 years old on powerball.com.
By Traffic Sources
 (Reference: similarweb.com)
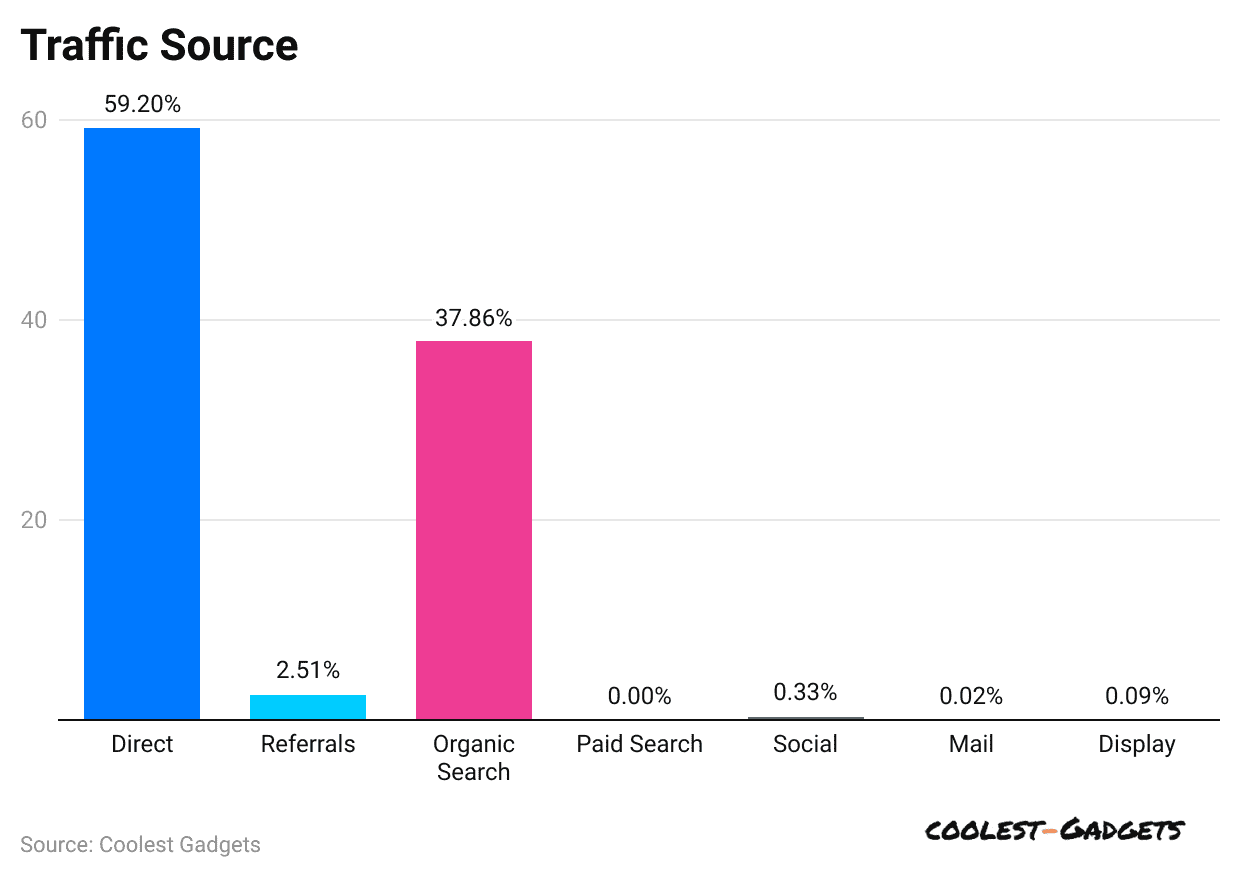
- Based on Powerball Statistics, as of February 2025, 59.2% of people visited powerball.com by typing the website directly (compared to 37.86% who came from search engines).
- The website also gets traffic from other sources: 2.51% from referrals, followed by 0.33% (social), 0.02% (mail), and 0.09% (display).
By Device
 (Source: semrush.com)
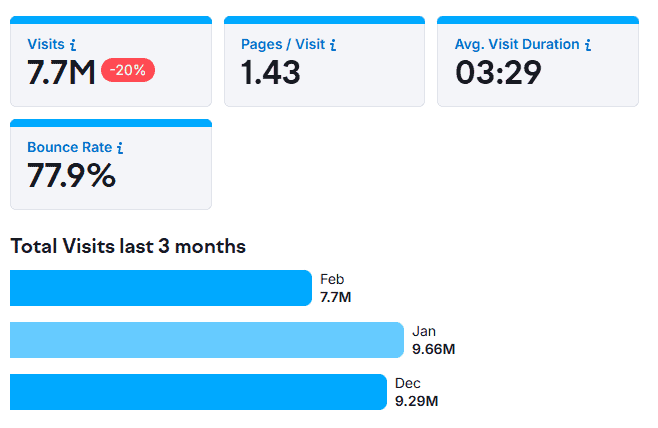
- Powerball Statistics for February 2025 show that visits to powerball.com dropped to 7.7 million, down from 9.66 million in January.
- Visitors spent an average of 3 minutes and 29 seconds per visit.
- Each person looked at about 1.43 pages before leaving the site.
- The bounce rate was 77.9%, meaning many people didn’t click to another page.
#1. Most people who visit Powerball.com are from the United States, making up 89.16% of the traffic.
- About 6.86 million visitors come from the U.S.
- Mobile phones are used by 80.86%, while 19.14% use a computer.
#2. Chile has the second highest number of visits, with 2.82% of all visitors.
- Nearly 217,110 users are from Chile.
- Mobile users make up 98.54%, and only 1.46% use a desktop.
#3. Mexico brings in 2.54% of the visitors.
- That’s around 195,520 people.
- 13% use phones, while 2.87% use computers.
#4. From Colombia, 1.34% of the traffic comes in.
- Close to 102,900 users visit from there.
- Mobile devices are used by 95.73%, and 4.27% go on a desktop.
#5. Brazil contributes 0.75% of the visitors.
- Around 57,980 people visit from Brazil.
- 28% are on mobile, and 4.72% use a computer.
Conclusion
Powerball gives people hope to win big money despite the small chance. Many people enjoy playing because it’s exciting and fun to dream. But it’s important to play responsibly and not spend too much. Winning the jackpot can change a life but also brings new challenges.
In the end, Powerball is a game of luck. If you choose to play, do it for fun, not as a way to get rich. Remember that the odds are low, so play smart and stay safe.
FAQ.
Pick five numbers from 1 to 69 and 1 Powerball number from 1 to 26; match numbers to win prizes.
A ticket usually costs between $10 and $50, depending on the event, location, and seating choice.
Powerball drawings occur every Monday, Wednesday, and Saturday at 10:59 p.m. Eastern Time.
The game rules state that you must be old enough, usually 18 or older, depending on the country.
The odds of winning the jackpot are low, about 1 in millions, like finding one special coin in a stadium.
You must claim your prize within the given time limit, or you might lose your chance.
Non-U.S. citizens can play Powerball if they buy tickets from a licensed seller in the United States.
Pramod Pawar brings over a decade of SEO expertise to his role as the co-founder of 11Press and Prudour Market Research firm. A B.E. IT graduate from Shivaji University, Pramod has honed his skills in analyzing and writing about statistics pertinent to technology and science. His deep understanding of digital strategies enhances the impactful insights he provides through his work. Outside of his professional endeavors, Pramod enjoys playing cricket and delving into books across various genres, enriching his knowledge and staying inspired. His diverse experiences and interests fuel his innovative approach to statistical research and content creation.