Panasonic Statistics By Segments, Market Capitalization, Country, Net Promoter Score/NPS and Demographics

Updated · Mar 12, 2025


TABLE OF CONTENTS
- Introduction
- Editor’s Choice
- Facts About Panasonic
- General Panasonic Statistics
- Panasonic’s Financial Result Statistics
- Panasonic Financial Statistics by Segments
- Panasonic’s Net Sales from FY 2009 to FY 2024
- By Region
- Panasonic Statistics by Market Capitalization
- Panasonic Statistics by Country
- Digital Camera Statistics
- Panasonic Green Impact Plan 2024
- Panasonic Statistics by Net Promoter Score/NPS
- Panasonic NPS statistics by Demographics
- Panasonic’s Battery Statistics
- Panasonic Solar Industry Statistics
- Panasonic Website Traffic Statistics by Country
- Panasonic Avionics Statistics
- Panasonic’s Best-selling Beauty Devices
- Best Panasonic Lenses of 2024
- Best Panasonic Camera of 2024
- Top Panasonic Washing Machines of 2024
- Conclusion
Introduction
Panasonic Statistics: Panasonic is a well-known Japanese company that makes electronics, home appliances, and industrial equipment. Founded in 1918, it has grown into a global brand. The company focuses on innovation, technology, and sustainability. Panasonic has grown into many fields, such as cars, energy, and digital technology. It is a strong company with high sales and earnings in the market.
To stay ahead, it spends a lot on research and new ideas. The company also cares about the environment, making eco-friendly products and using sustainable methods. With millions of customers worldwide, Panasonic keeps growing and improving. Its focus on quality and new technology helps it stay a top brand in the electronics industry.
Editor’s Choice
- By March 31, 2024, Panasonic had total assets of about USD 59.8 billion.
- From April to December 2024, the company made an operating profit of USD 2.45 billion (380 billion yen).
- For the same period, net sales reached 6,403.9 billion yen (USD 41.3 billion).
- In the third quarter of fiscal year 2025, the energy unit reported an operating profit of 42 billion yen (USD 270.46 million), a 39% increase over the previous year.
- Panasonic maintains its full-year profit forecast at 380 billion yen (USD 2.45 billion) for fiscal year ending March 31, 2025.
- The company raised its full-year earnings forecast for the energy unit by 14% to 124 billion yen (USD 798.35 million), driven by stronger sales of energy storage systems and improved profitability at its U.S. battery plant.
- In 2024, Panasonic’s R&D expenditure was approximately USD 3.12 billion, reflecting a steady investment in innovation.
- The number of employees stood at 228,420 in 2024, indicating a consistent reduction over the years.
- Starting April 2025, Panasonic plans to implement management reforms aiming to enhance group profitability by over 300 billion yen (USD 1.93 billion) by fiscal year ending March 2029.
- Panasonic operates in 120 countries across the Americas, Europe, Asia, Africa, and the Middle East.
- Panasonic has been in operation for 106 years, from 1918 to 2024.
- Panasonic collaborates with around 532 consolidated companies.
- In February 2024, Panasonic.com’s total website visits reached 15.4 million, with a bounce rate of 50.63%.
- Panasonic faces competition from Apple and Samsung, which recorded sales of over 380 billion USD and 200 billion USD, respectively, in 2023.
- In the lithium-ion battery market, Panasonic competes with LG Energy Solution, CATL, and BYD, where it holds a smaller market share compared to these three leaders.
You May Also Like To Read
- Anker Statistics
- Sennheiser Statistics
- Seagate Statistics
- Razer Statistics
- Motorola Statistics
- Samsung Statistics
- Garmin Statistics
- LG Statistics
- Huawei Statistics
- Oppo Statistics
- iPhone Statistics
Facts About Panasonic
Panasonic Corp. is a Japanese multinational company that was founded by Konosuke Matsushita in 1918 and is headquartered in Kadoma, Osaka. It operates in the following segments described below:
- Appliances: This company manufactures and develops household-related electronic products such as air conditioners, vacuum cleaners, refrigerators, washing machines, and other beauty products.
- The Eco Solutions: segment manufactures, develops, and sells interior furnishing materials, LED lighting, solar photovoltaic systems, wiring devices, air-conditioning equipment, air purifiers, and water-related products, among other things.
- The Connected Solutions: Allows in manufacturing, entertainment, retail, and logistics and offers system integration, maintenance services, support, and installation for aviation.
- The Automotive and Industrial System: Manufactures, develops, sells, and provides services for electrical components, car-use multimedia-related equipment, storage batteries, dry batteries, lithium-ion batteries, semiconductors, automation controls, optical devices, electronic mounting machines, welding equipment, bicycles, etc.
- Others: This segment mainly deals with sales of housing, rental apartments, lands and buildings, home remodeling, material imports, components, etc.
General Panasonic Statistics
- Panasonic’s net sales for fiscal year 2024 amounted to approximately USD 54 billion, or 8.5 trillion Japanese yen.
(Source: panasonic.com)
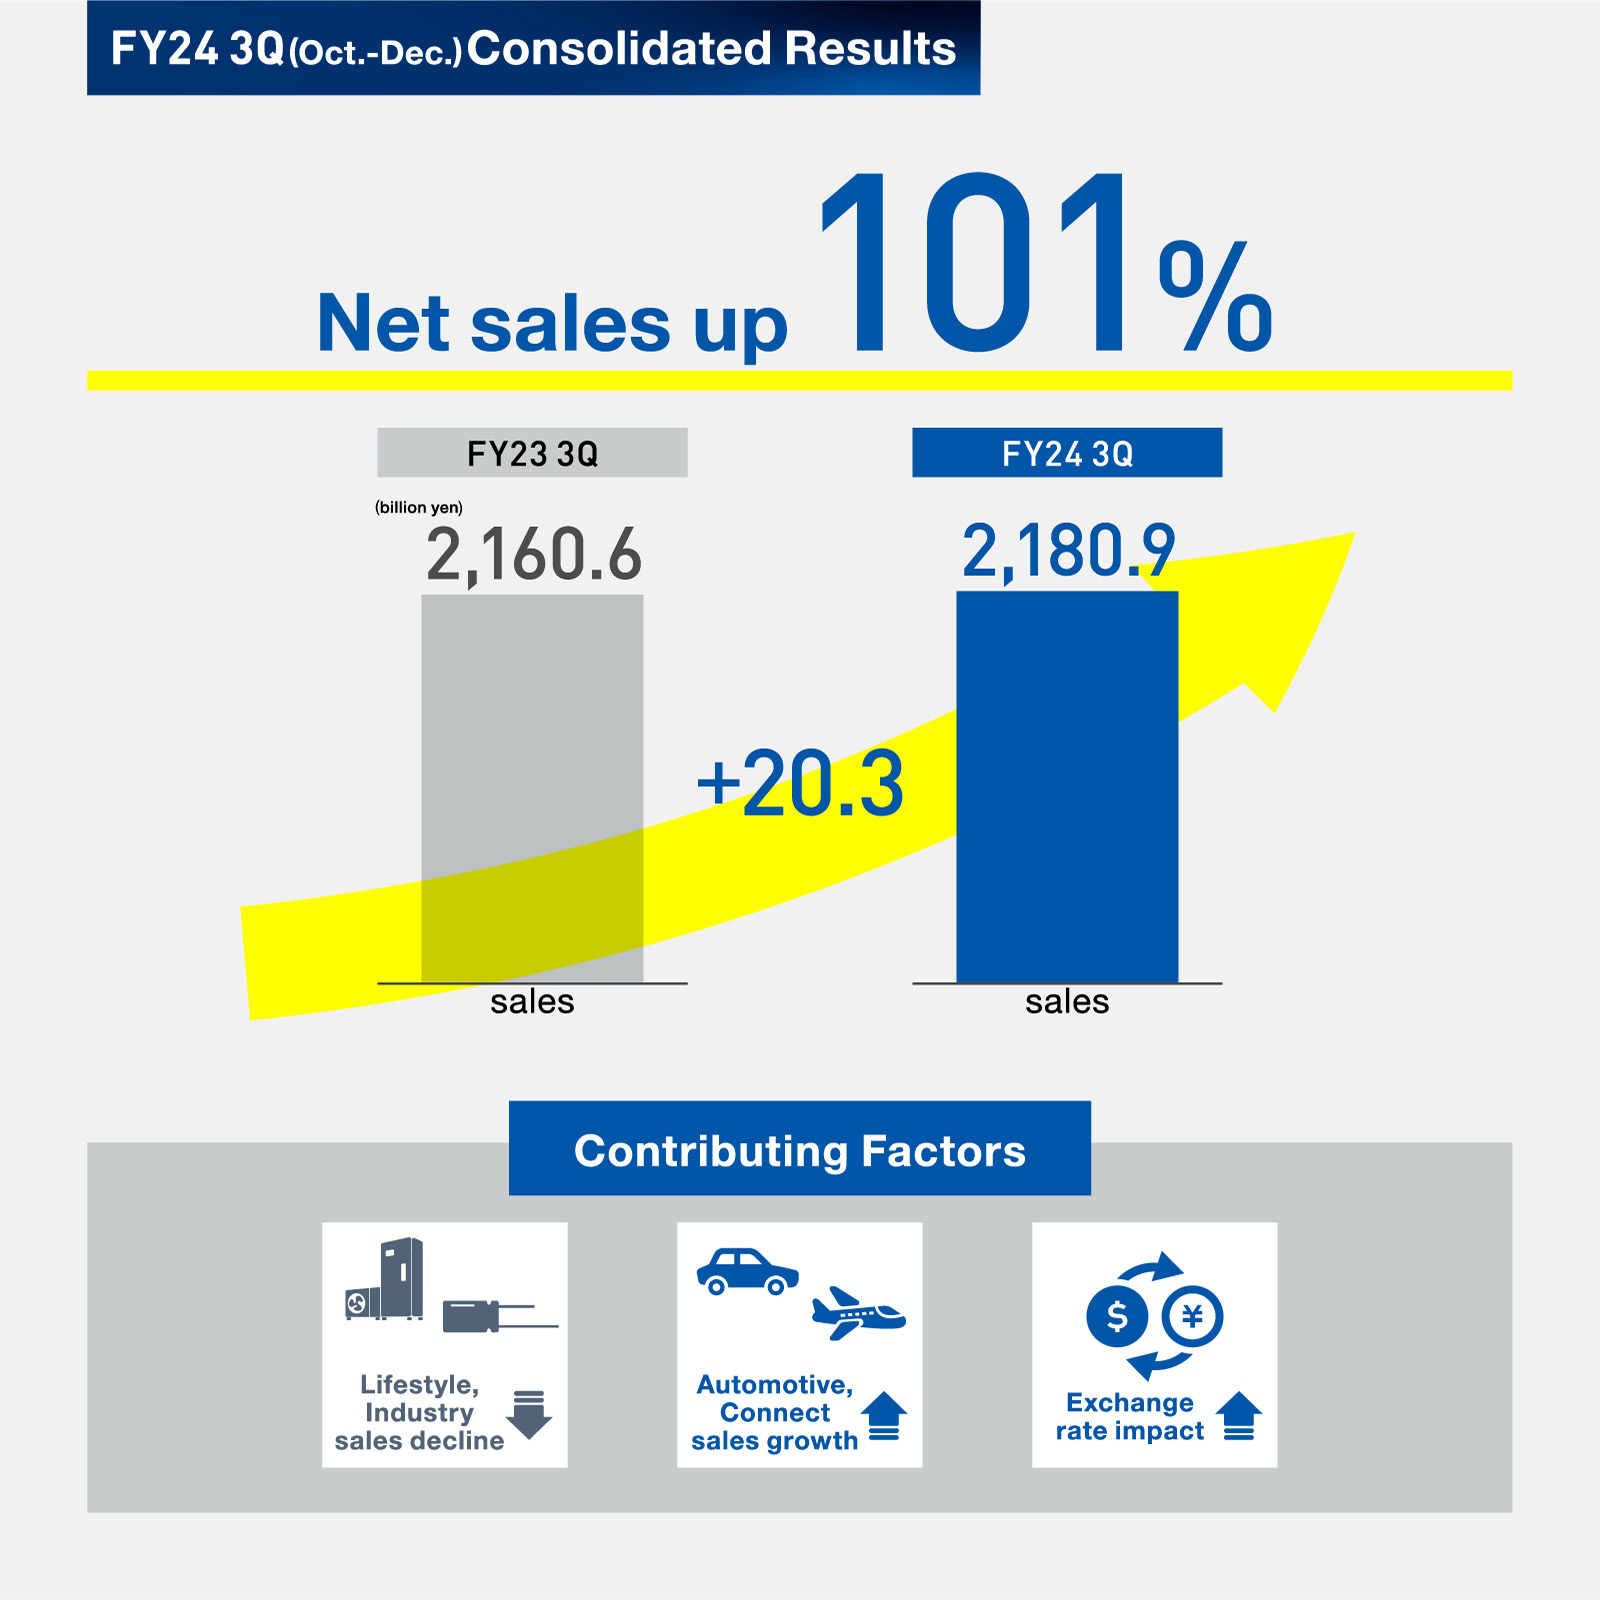
- Net sales revenues in the third quarter of 2023 were $14.26 billion. They are anticipated to rise to USD 14.40 billion in the third quarter of 2024.
- Panasonic’s first product, which was manufactured and introduced to markets, was an upgraded plug with a resin-made, uniquely designed connector attached.
- The consumer appliance segment of Panasonic is referred to as the most efficient solution.
- Garment Steamer Garment Steamer markets of Panasonic are responsible for 148% of the growth.
- Other products’ growth rates include the Nanoe Hair Dryer and Hair Care Products (147%), the Healthy Air-Frying Microwave Ovens (194%), the brand new Bagless Canister, the first detachable world-class Extreme Series Tank vacuum cleaner models (145%), and The Nanoe-X and R32 refrigerant ranges for the Residential Air Conditioner range (201%).
Panasonic’s Financial Result Statistics
1st Quarter of 2024
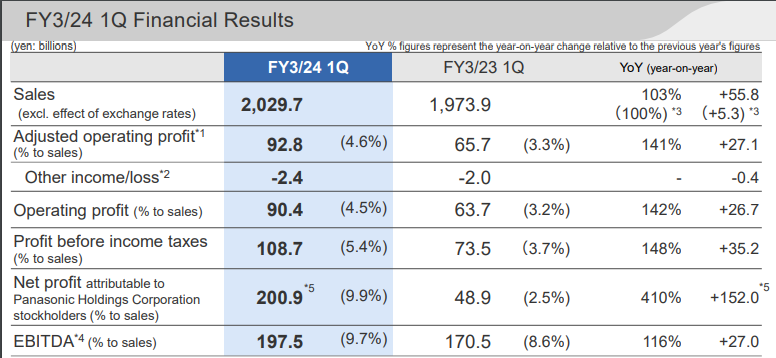
- The expected sales revenue turned out to be USD 13.41 billion, with an adjusted operating profit of USD 0.61 billion (4.6%).
- Overall operating profit will reach USD 0.59 billion, with a 4.5% increase in sales from Q1 2023.
- Profit to be earned before income taxes was USD 0.72 billion, which is 5.4% of sales.
- Net profit attributable to Panasonic Holdings Corporation stockholders will be USD 1.32 billion with 9.9% sales.
- Revenue estimated by EBITDA will be USD 1.30 billion (9.7% to sales).
2nd Quarter of 2024
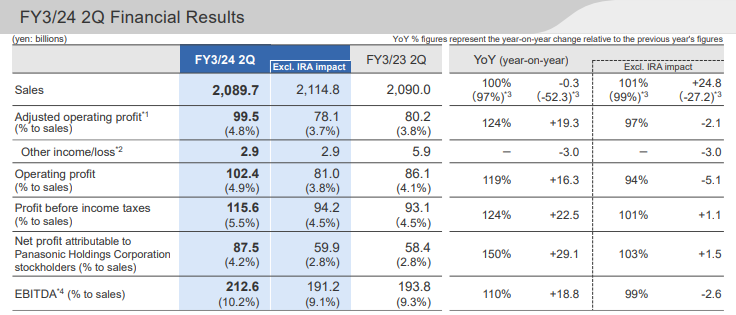
- It is estimated that the overall revenue shares will increase from the previous quarter in the second quarter of 2024.
- Total revenue approached by Panasonic will be USD 13.80 billion, with an adjusted operating profit of USD 0.66 billion.
- Furthermore, other financial results are followed by operating profit (USD 0.67 billion), profit before income taxes (USD 0.76 billion), net profit attributed to Panasonic Holdings Corporation stockholders (USD 0.58 billion), and EBITDA (USD 1.40 billion).
3rd Quarter of 2024
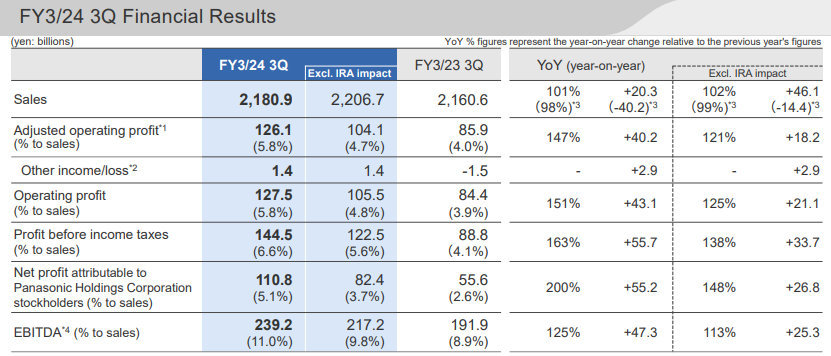
- Total revenue accounted by Panasonic will be USD 14.40 billion in the 3rd quarter of 2024, with an adjusted operating profit of USD 0.83 billion.
- Furthermore, other financial results are operating profit (USD 0.84 billion), profit before income taxes (USD 0.95 billion), net profit attributed to Panasonic Holdings Corporation stockholders (USD 0.73 billion), and EBITDA (USD 1.57 billion).
Panasonic Financial Statistics by Segments
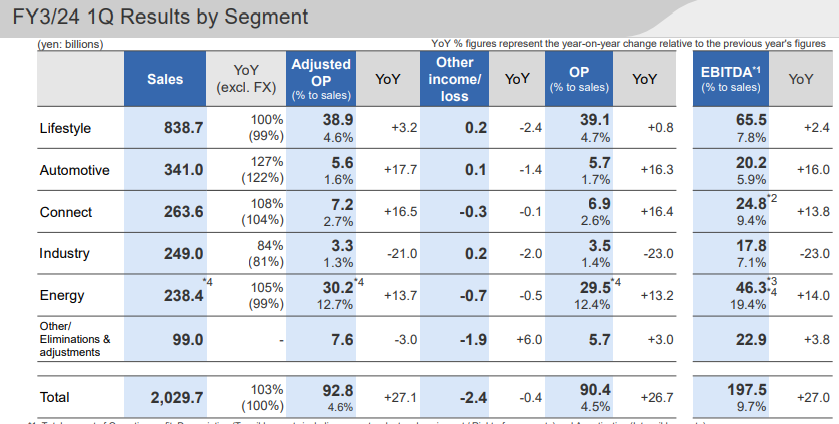
- According to Panasonic Statistics, Lifestyle’s sales revenue in the 1st quarter of 2024 will be USD 5.54 billion, with an adjusted operating profit of USD 0.25 billion.
- Moreover, sales revenue and adjusted operating profit by other segments are Automotive (USD 2.25 billion and USD 0.03 billion), Connect (USD 1.74 billion and USD 0.04 billion), Industry (USD 1.64 billion and USD 0.01 billion), and Energy (USD 1.57 billion and USD 0.19 billion), respectively.
- The rest of the segments make USD 0.65 billion in sales revenue and USD 0.05 billion in adjusted operating profit.
- The EBITDA analyses are based on segments: Lifestyle (USD 0.43 billion), Automotive (USD 0.13 billion), Connect (USD 0.16 billion), Industry (USD 0.11 billion), Energy (USD 0.30 billion), and Others (USD 0.15 billion).
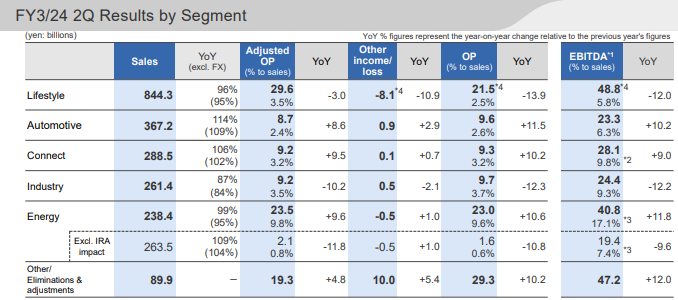
- The lifestyle segment generated the highest sales revenue (USD 5.57 billion) in the second quarter of 2024.
- Furthermore, other segments’ revenue are Automotive (USD 2.42 billion), Connect (USD 1.90 billion), Industry (USD 1.72 billion), Energy (USD 1.57 billion), and others (USD 0.59 billion).
- Operating profit earned by different segments is Lifestyle (USD 0.14 billion), Automotive (USD 0.06 billion), Connect (USD 0.05 billion), Industry (USD 0.06 billion), Energy (USD 0.15 billion), and others (USD 0.19 billion).
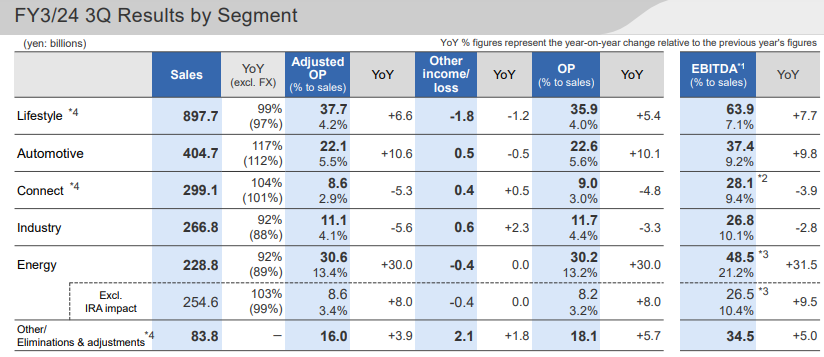
- In the 3rd quarter of 2024, the lifestyle segment generated the highest sales revenue, USD 5.93 billion.
- Furthermore, other segments’ revenue are Automotive (USD 2.67 billion), Connect (USD 1.97 billion), Industry (USD 1.75 billion), Energy (USD 1.51 billion), and others (USD 0.54 billion).
- Segmental operating profit earnings are Lifestyle (USD 0.23 billion), Automotive (USD 0.15 billion), Connect (USD 0.05 billion), Industry (USD 0.19 billion), Energy (USD 0.19 billion), and others (USD 0.11 billion).
Panasonic’s Net Sales from FY 2009 to FY 2024
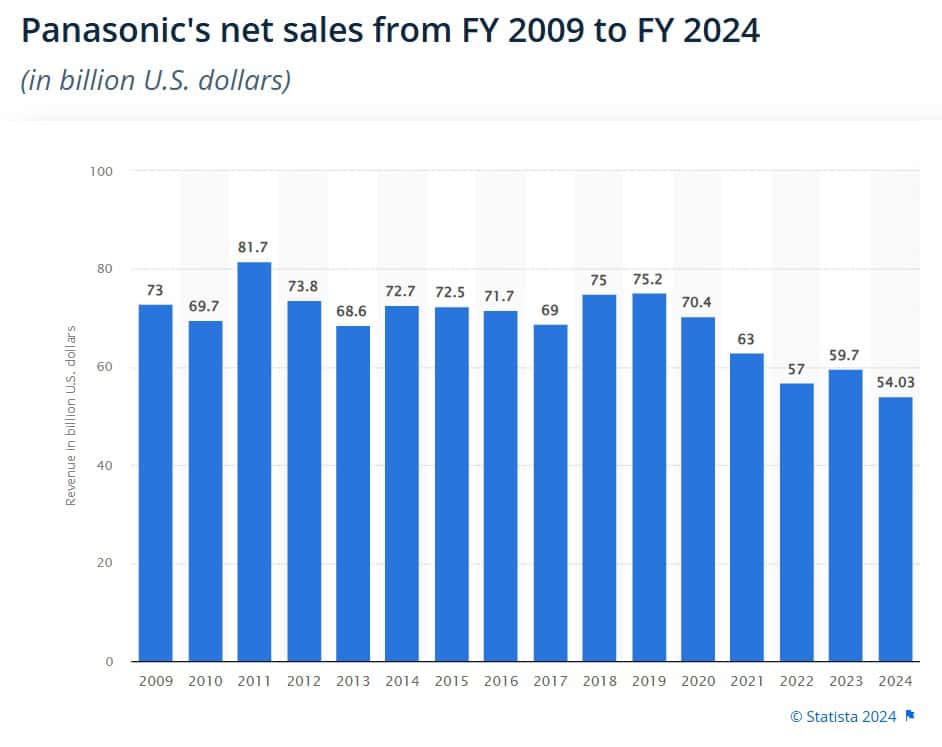
(Source: Statista)
- In the fiscal year 2024, Panasonic’s sales revenue came to around 54 billion USD (or 8.5 trillion Japanese yen).
- In 2009, Panasonic’s net sales were 73 billion USD.
- In 2011, Panasonic’s net sales were 81.7 billion USD.
- In 2013, Panasonic’s net sales were 68.6 billion USD.
- In 2015, Panasonic’s net sales were 72.5 billion USD.
- In 2017, Panasonic’s net sales were 69 billion USD.
- In 2019, Panasonic’s net sales were 75.2 billion USD.
- In 2021, Panasonic’s net sales were 63 billion USD.
By Region
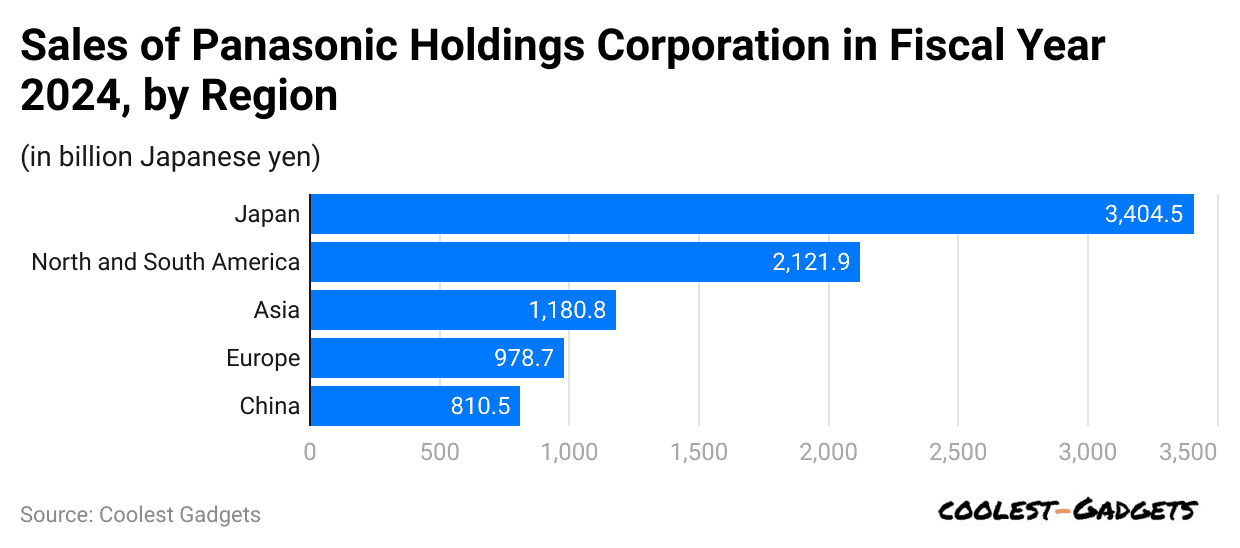 (Reference: statista.com)
- In the 2024 fiscal year, Panasonic Holdings Corporation earned over 3.4 trillion yen from its business in Japan.
- During the same period, net sales in other regions were as follows: North and South America reached 2,121.9 billion yen, while Asia generated 1,180.8 billion yen.
- Sales totaled 978.7 billion yen in Europe, and the company recorded USD 810.5 billion in revenue in China.
Panasonic Statistics by Market Capitalization
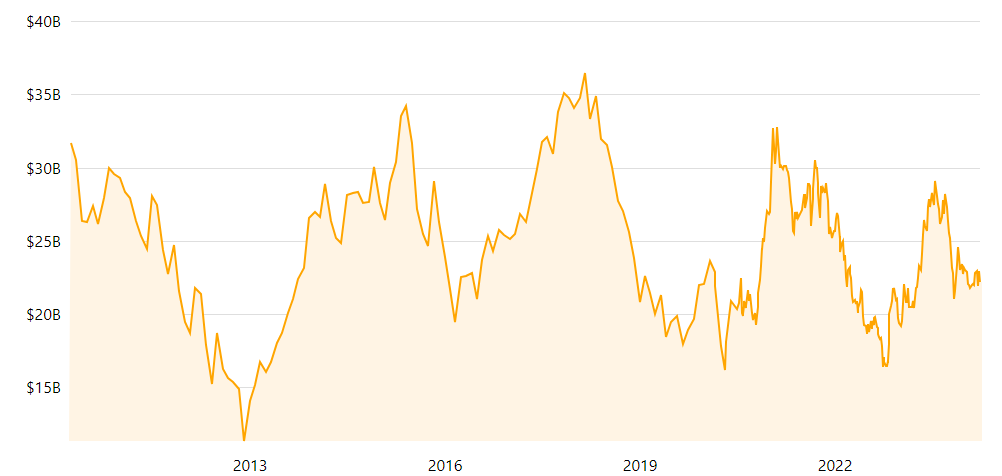
(Source: companiesmarketcap.com)
- According to Panasonic Statistics, Panasonic’s market cap in 2023 and 2024 will be USD 23.11 billion (+19.27%) and USD 22.18 billion (-4.03%), respectively.
- In 2023, the monthly market cap of the company was 28th January (USD 22.06 billion), 25th February (USD 20.5 billion), 25th March (USD 20.45 billion), 29th April (USD 23.01 billion), 27th May (USD 26.04 billion), 24th June (USD 27.28 billion), 29th July (USD 28.03 billion), 26th August (USD 26.64 billion), 23rd September (USD 27.34 billion), 28th October (USD 22.8 billion), 25th November (USD 24.55 billion), and 23rd December (USD 22.74 billion).
- Meanwhile, the monthly market cap in 2024, 13th January (USD 22.86 billion), 20th January (USD 22.05 billion), 10th February (USD 21.99 billion), 24th February (USD 21.98 billion), and 28th March (USD 22.19 billion).
Panasonic Statistics by Country
- As per Panasonic Holdings Corporation, on 27th March 2024, Japan captured the highest net sales share of 43.2%.
- Followed by other countries share are China (13.4%), Asia (14.7%), Americas (18.7%), and Europe (10%).
You May Also Like To Read
- Xiaomi Statistics
- Lenovo Statistics
- Asus Statistics
- Toshiba Statistics
- Intel Statistics
- Dell Statistics
- HP (Hewlett-Packard) Statistics
- Philips Statistics
- Apple Statistics
- Google Statistics
- Sony Statistics
- Microsoft Statistics
- Airbnb Statistics
- Google Revenue Statistics
- Amazon Statistics
- Tencent Statistics
Digital Camera Statistics
(Reference: statista.com)
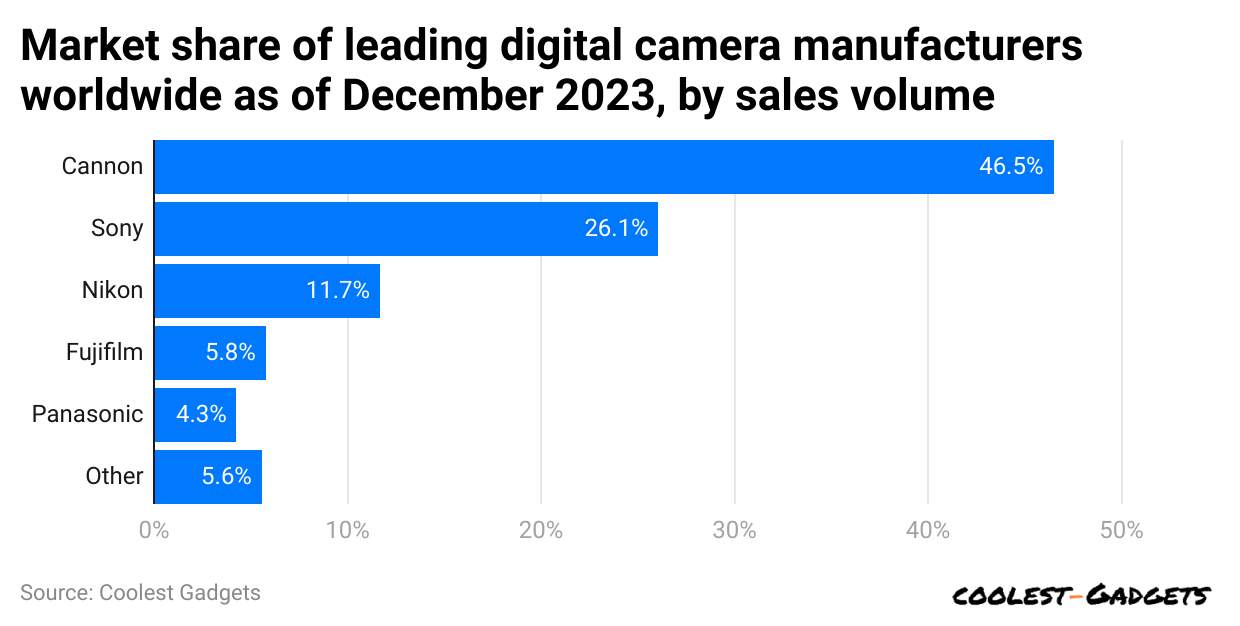
- As of 2023, Canon is the top-ranked camera brand, holding a market share of 46.5%.
- Furthermore, the next brand share is followed by Sony (26.1%), Nikon (11.7%), and Fujifilm ($5.8 billion).
- The Panasonic camera market holds the top five positions among others, accounting for a 4.3% share.
Panasonic Green Impact Plan 2024
(Source: panasonic.com)
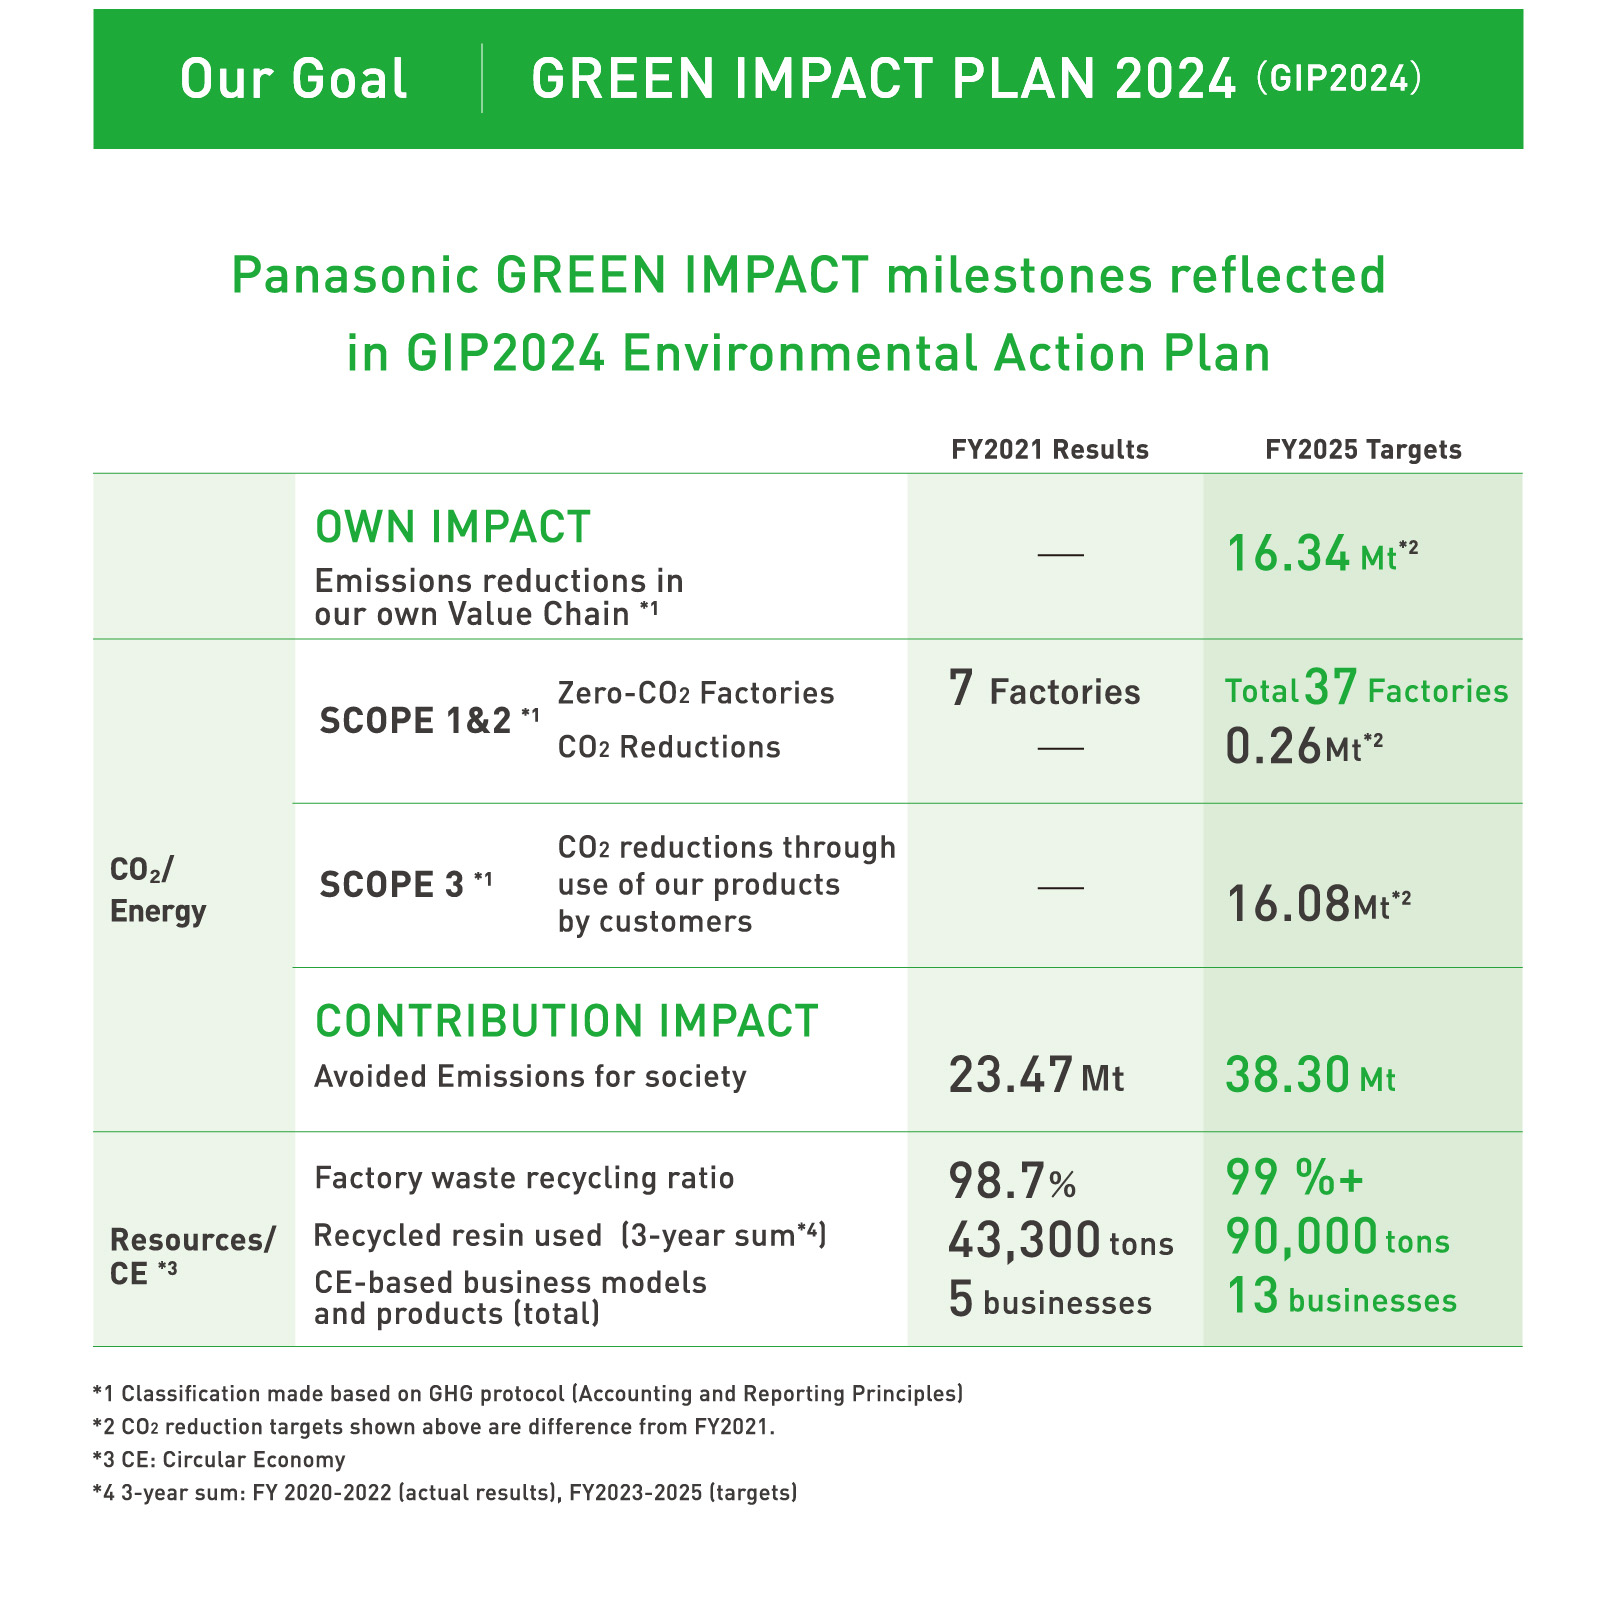
- Panasonic Group announced the Green Impact Plan in 2023 to solve several environmental issues. The main aim is to achieve “an ideal society offering material and spiritual affluence.”
- The targets of 2025 are to achieve net zero emissions, such as Own Impact (emission reductions in our value chain: 16.34 million tons/Mt), Scope 1 & 2 (total 37 Zero-CO2 factories and 0.26 Mt), and Scope 3 (CO2 reductions through customers’ use of our products: 16.08 Mt).
- Meanwhile, the contribution impact (38.30 Mt), factory waste recycling ratio (99%), recycled resin uses (90,000 tons), and CE-based business models and products (13 business).
Panasonic Statistics by Net Promoter Score/NPS
(Source: comparably.com)
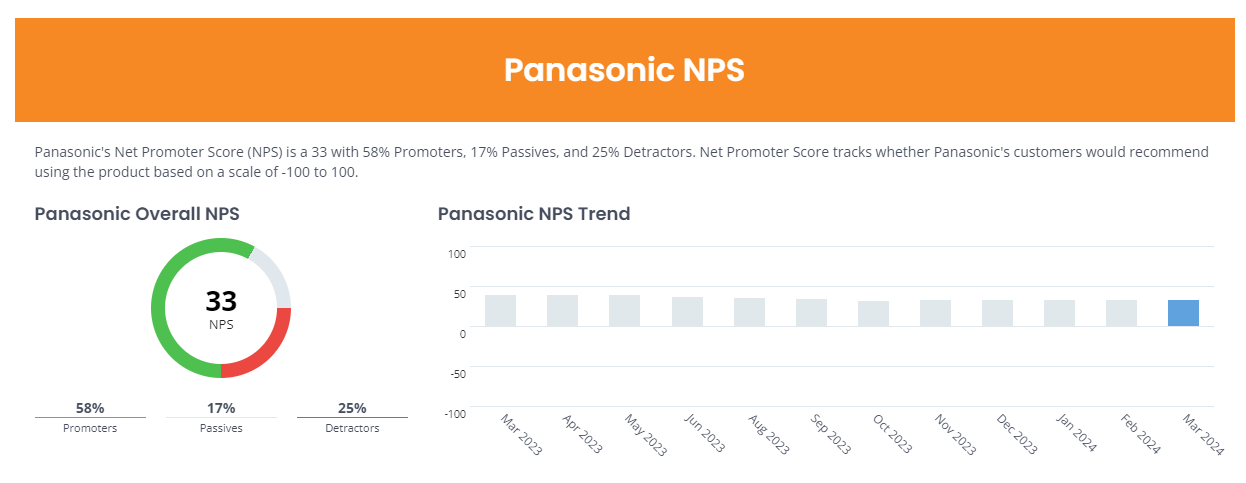
- Following Panasonic Statistics, Panasonic’s standard NPS is 33, with 58% promoters, 17% passives, and 25% detractors.
- In 2023, monthly NPS trends were March (38), April (38), May (38), June (36), July (35), September (33), October (31), November (32), and December (32).
- However, NPS trends in 2024 are January (32), February (32), and March (32).
Panasonic NPS statistics by Demographics
- Male and female customers rated Panasonic’s NPS at 41 and 46, respectively.
- 64% of males are promoters, 13% are passives, and 23% are detractors.
- 62% of females are promoters, 22% are passives, and 16% are detractors.
- Based on ethnicity, NPS rates in African American/Black was 50, followed by Asia or Pacific Islander (31), Caucasian (-33), and others (55).
- NPS rates by usage are less than one year (45), 1 to 2 years (22), 2 to 5 years (32), 5 to 10 years (39), and above ten years (62).
Panasonic’s Battery Statistics
(Source: financialexpress.com)
- As of 2024, Panasonic has planned to make upgraded EV batteries.
- The company has been working for a long time to boost the energy density of 2170 cells, which will reduce electric vehicle costs.
- In North America, Panasonic plans to expand and improve the production of batteries, with the main intention of providing 200 gigawatt hours of energy in electric vehicle batteries.
- The company is also developing the 4680 cells, a thicker and more voluminous battery type.
- By the end of 2025, the manufacturing of EV batteries will be raised by 10%.
- Panasonic is currently building another battery plant in Kansas.
- Panasonic’s EV battery and Lithium-ion battery production capacity will reach 200 GWh and 150 GWh, respectively, by 2030.
- In the United States, Panasonic’s battery cell operating income is estimated to be $587 million by March 2024.
Panasonic Solar Industry Statistics
- Panasonic Statistics further states that in the 3rd quarter of 2023, the average quoted solar loan APR will be doubled from last year, resulting in 6.1%.
- In California, Panasonic provided some of the best rebates and incentives, named ‘NEM 3.0,’ in which homeowners will receive 75% less money for every kilowatt-hour of electricity.
- In the United States of America, the battery storage attachment rates with Panasonic’s solar installation increased up to 13% in 2023.
Panasonic Website Traffic Statistics by Country
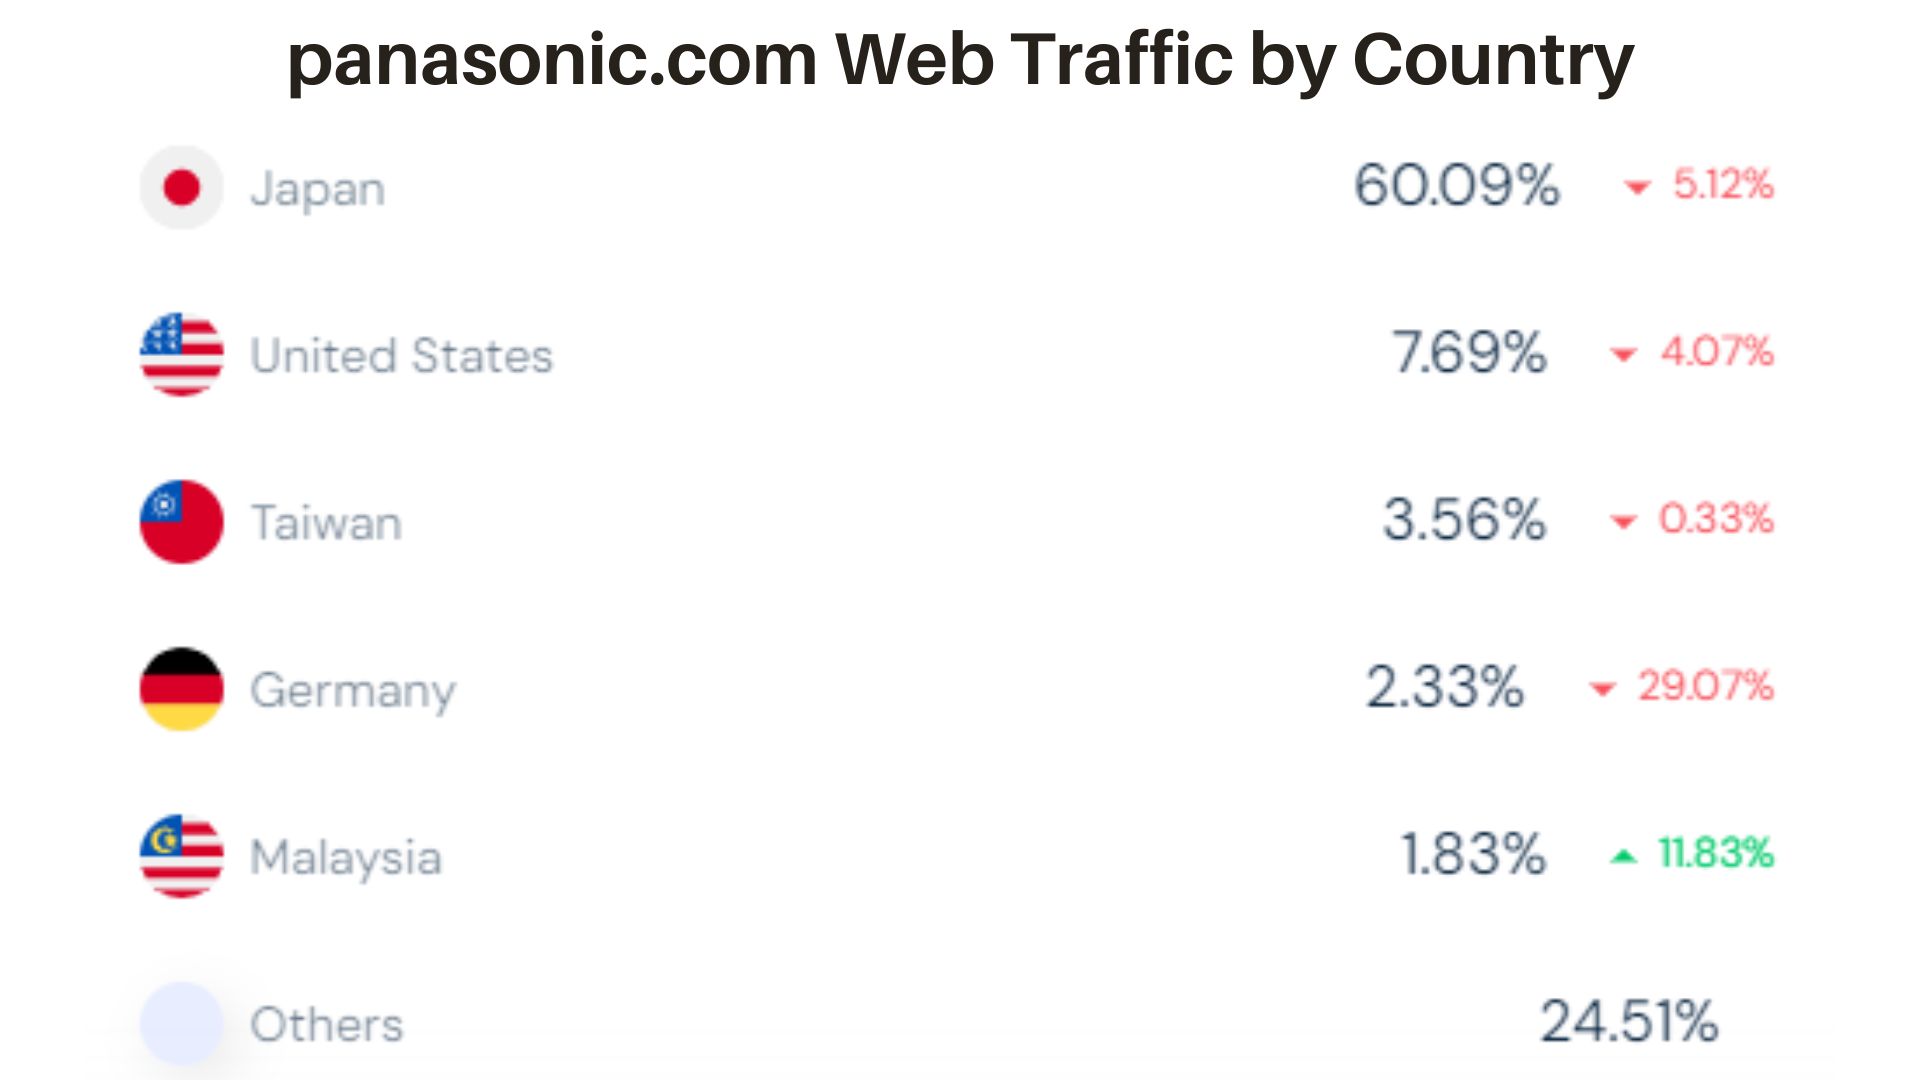
(Reference: similarweb.com)
- As Panasonic Statistics claimed in February 2024, Japan had 60.09% of the total traffic on panasonic.com, but it decreased by 5.12% in total website visitors.
- Moreover, other countries recorded the following contribution in total traffic: the United States: 7.69% (-4.07%), Taiwan: 3.56% (-0.33%), Germany: 2.33% (-29.07%), and Malaysia: 1.83% (+11.83%).
- Visitors share collectively, which is made up of other countries, was around 24.51%.
By Demographics
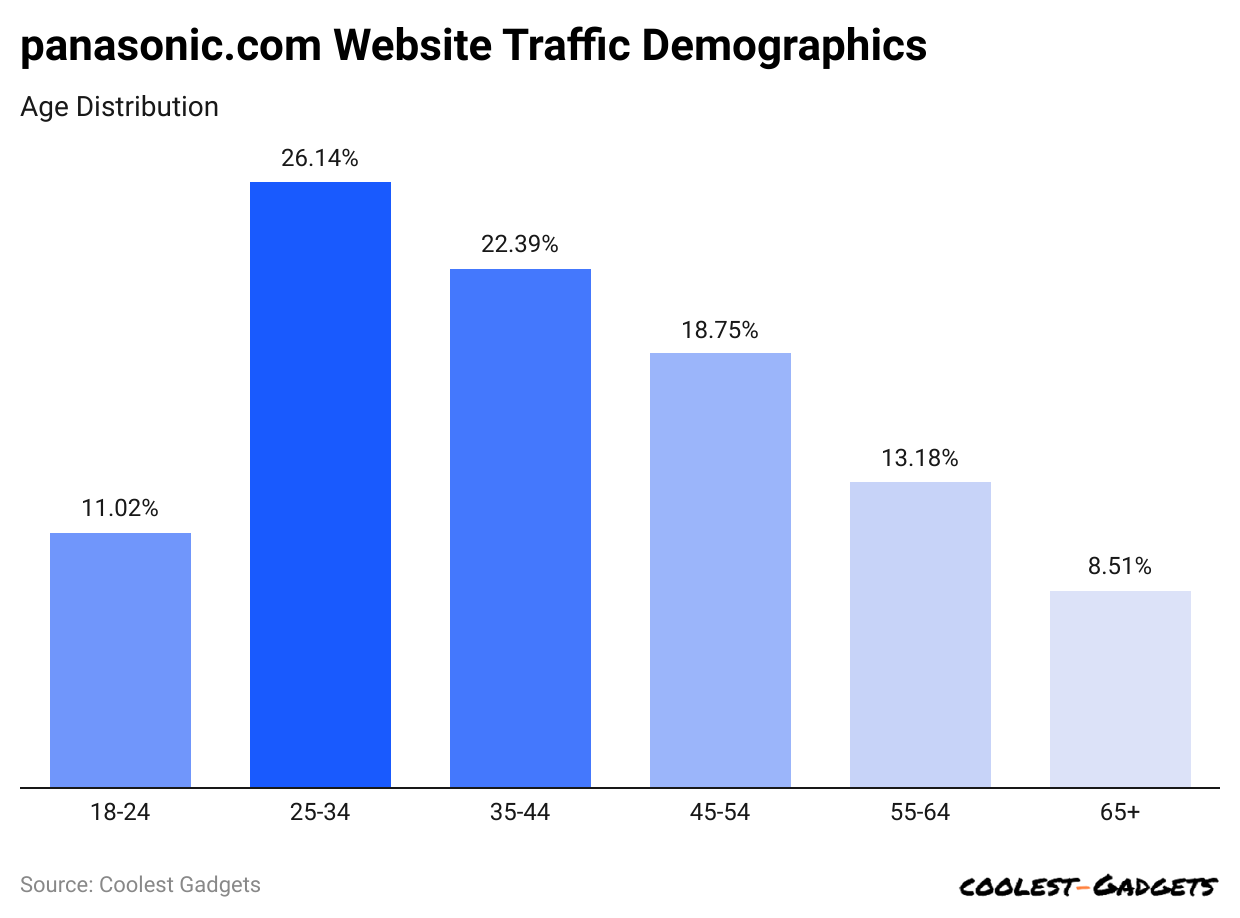
(Reference: similarweb.com)
- The highest number of website users observed on panasonic.com is between 25 and 34 years old, resulting in 26.14% user share.
- 39% and 18.75% of users are aged 35 to 44 and 45 to 54, respectively.
- 18% and 11.02% of traffic belong to people aged 18 to 24 and 55 to 64, respectively.
- 51% of user shares contributed from the age group above 65 years.
- Male and female user shares of panasonic.com are 70.28% and 29.72%, respectively.
By Traffic Source
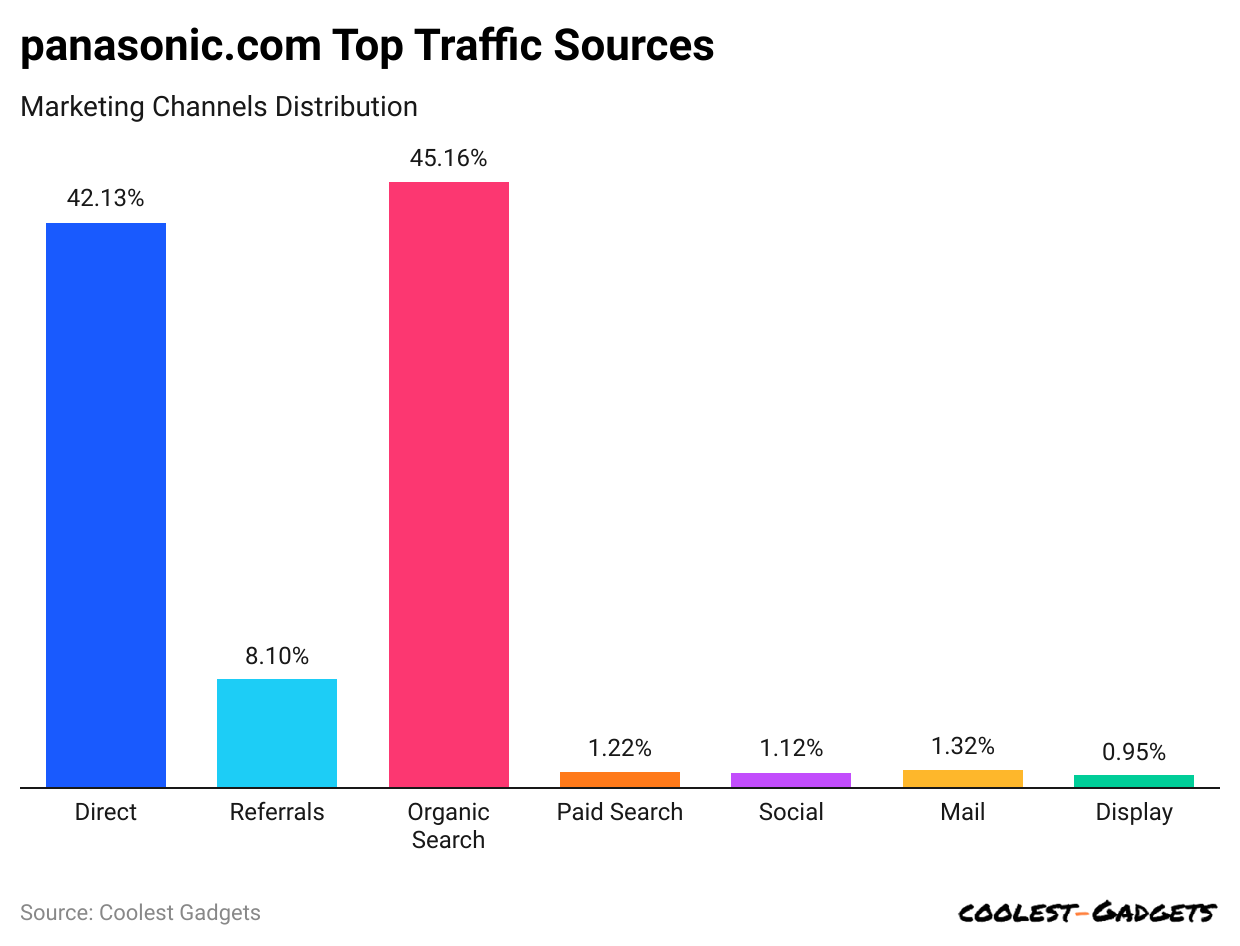
(Reference: similarweb.com)
- Panasonic Statistics by age group state that the highest traffic rate towards panasonic.com was by organic search, resulting in a 45.16% traffic share.
- Direct traffic searches generate 42.13% of the share, while 8.1% is from referrals.
- Other traffic sources that contribute to the website are paid (1.22%), social (1.12%), mail (1.32%), and display (0.95%)
By Social Media Referral Rate
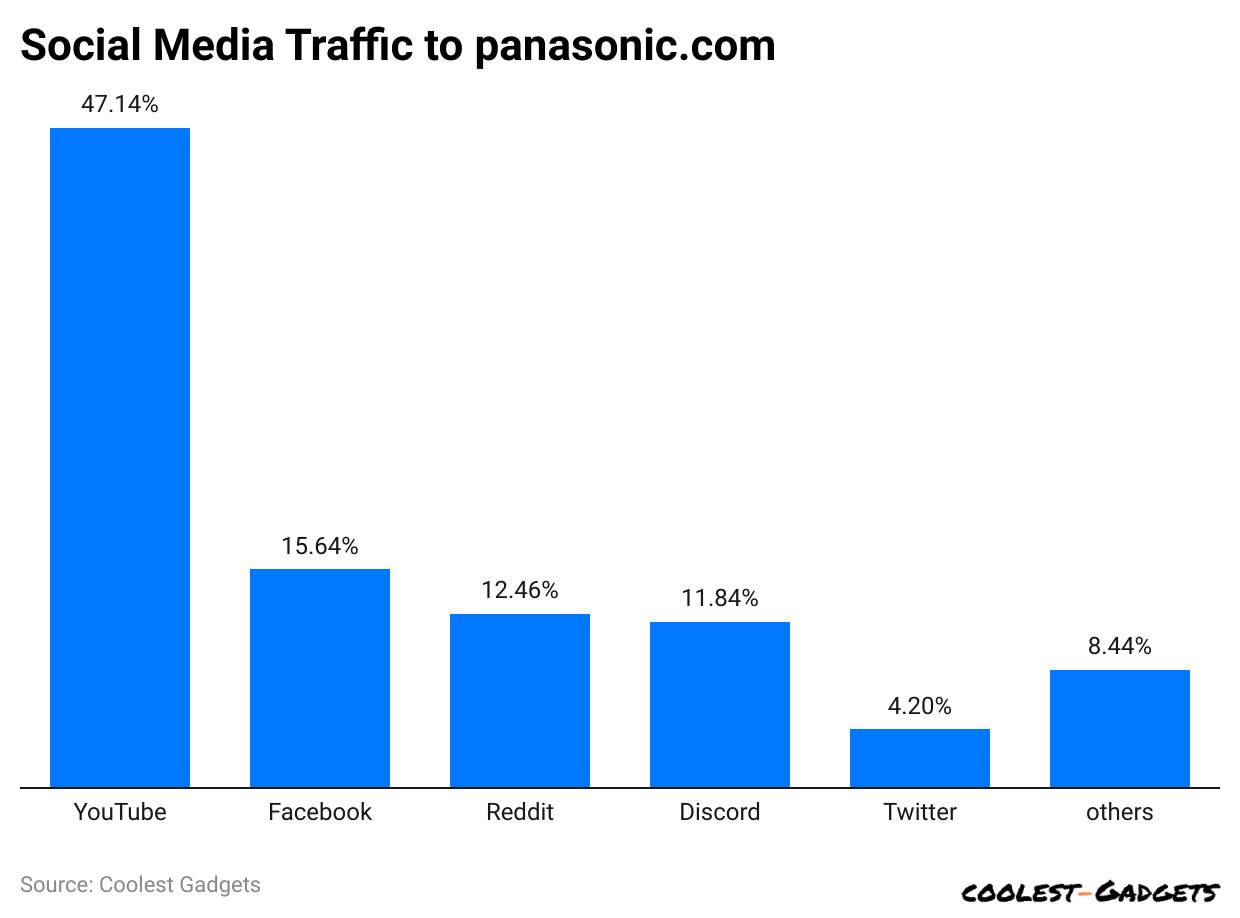
(Reference: similarweb.com)
- YouTube has the highest social media referral rate, with a 47.41% share compared to other social networks.
- Facebook and Reddit contribute by 15.64% and 12.46%, respectively.
- Traffic sent by Twitter is 11.39%, and Linkedin contributes 4.2%.
- Other social media networks make a nominal contribution, collectively making around 8.44% of the share.
Panasonic Avionics Statistics
- Panasonic Statistics further states that annual revenue generated by Panasonic Avionics turned out to be $1.1 billion in 2023.
- Per day, Panasonic Avionics makes around $3 million and $91.7 million in revenue monthly.
- Around 2,500 employees are currently employed in this Industry, and the estimated revenue per employee is $440,000.
- Men and women employees share 70% and 30% at Panasonic Avionics, respectively.
- Depending on ethnicity, 49% of employees are white, 18% (Asian), and 17% (Hispanic or Latino).
Panasonic’s Best-selling Beauty Devices
- Panasonic lift care beauty face device Vita lift RF black EH-SR85-K
- Panasonic lift care beauty face device Vita Lift Kassa black EH-SP85-K
- Panasonic lift care beauty face device vita lift brush Panasonic greige EH-SP60-H
- Panasonic ion beauty face device ion boost multi-gold-like EH-ST0A-N
- Panasonic ion beauty face device ion boost multi-gold-like EH-ST0A-N
- Panasonic ion beauty face device ion boost multi-EX white EH-SS85-W
- Panasonic lift care beauty face device sonic RF lift gold-like EH-SR75-N
Best Panasonic Lenses of 2024
(Source: dpreview.com)
- Panasonic Lumix S 28-200mm F4-7.1 Macro OIS, ($899.99).
- Panasonic Lumix S 100mm F2.8 Macro, ($997.99).
Best Panasonic Camera of 2024
- Panasonic LUMIX S5 II, which is available at Amazon, costs $1,697.
- Panasonic LUMIX G9 II, ($1,897)
- Panasonic LUMIX GH6, ($2,197)
- Panasonic LUMIX G100, ($547)
- Panasonic LUMIX FZ1000 II, ($747)
Top Panasonic Washing Machines of 2024
- Panasonic 6.5 Kg 5 Star Fully-Automatic
- Panasonic 6.7 kg Built-in Heater
- Panasonic 8 Kg Wi-Fi fully automatic
- Panasonic 6 kg 5 Star Fully Automatic Front
- Panasonic NA-F70C1CRB 7.0 Kg Fully Automatic
- Panasonic 8 Kg wifi built-in Heater Fully Automatic
- Panasonic 8 Kg wifi Fully-Automatic
Conclusion
Panasonic is a well-known company that makes electronics and home appliances. The article discusses how the company is growing and improving its products. It focuses on new technology, better quality, and eco-friendly solutions. Panasonic wants to make products that help people in daily life. It listens to customers and tries to be better than other companies. To stay successful, the company improves technology and creates new ideas. By focusing on quality and customer needs, Panasonic keeps growing and selling great products worldwide in exchange for USD.
Sources
Pramod Pawar brings over a decade of SEO expertise to his role as the co-founder of 11Press and Prudour Market Research firm. A B.E. IT graduate from Shivaji University, Pramod has honed his skills in analyzing and writing about statistics pertinent to technology and science. His deep understanding of digital strategies enhances the impactful insights he provides through his work. Outside of his professional endeavors, Pramod enjoys playing cricket and delving into books across various genres, enriching his knowledge and staying inspired. His diverse experiences and interests fuel his innovative approach to statistical research and content creation.