Sony Statistics By Revenue, Country, Demographics, Brands, Television and Users

Updated · Mar 10, 2025


TABLE OF CONTENTS
- Introduction
- Editor’s Choice
- What is Sony?
- History Of Sony
- General Sony Statistics
- Sony’s Total Revenue
- Sony Group Market Cap Statistics
- Sony Statistic by Region
- Net Sales of Sony’s Game and Network Services by Segment
- Sony’s Play Station Sales Statistics
- Sony’s Play Station Network Statistics by Users
- Sony Group Stock Forecast Statistics
- Sony Statistics by Sales Category
- Sony Statistics by Music Entertainment Statistics
- Sony Statistics by Business Segment Employees
- Sony Statistics by Digital Camera Market
- Sony Statistics by Television
- Sony Statistics by SonyLiv
- Consumer Electronics Statistics by Brands
- Sony Website Traffic Statistics by Country
- Sony Statistics by Demographics
- Sony Statistics by Traffic Source
- Sony Statistics by Social Media Referral Rate
- Sony Statistics by Device Traffic
- Best-selling Products of Sony
- Conclusion
Introduction
Sony Statistics: Sony is a well-known company in technology, entertainment, and gaming. It has a strong presence in consumer electronics, music, and movies. The company is famous for its PlayStation gaming consoles, Bravia TVs, and high-quality audio products. With billions of dollars in yearly revenue and a large global customer base, Sony continues to lead in many industries. It invests a lot in research and development to stay ahead of competitors.
The company is making progress in artificial intelligence, imaging sensors, and gaming technology. These innovations help Sony shape the future of entertainment. This article looks at Sony’s latest statistics, including sales numbers, market trends, and new technologies that keep the company successful.
Editor’s Choice
- As of 2024, total revenue: Approximately ¥13 trillion (around USD 90.2 billion).
- Operating Profit: Resulted in ¥1.21 trillion (around USD 8.4 billion).
- Market Cap: On March 12, 2024, Sony Group’s net worth or market cap was USD 107.66 billion, reflecting an 8.30% decrease from the previous year.
- Net Profit: Around ¥971 billion (around USD 6.7 billion).
- Total Assets (2024): ¥34.11 trillion (around USD 238 billion).
- Equity (2024): Approximately ¥7.59 trillion (around USD 53 billion).
- Game & Network Services Revenue (2024): ¥4.49 trillion (approximately USD 31.3 billion)/
- Music Segment Revenue (2024): ¥1.56 trillion (approximately USD 10.9 billion).
- Imaging & Sensing Solutions Revenue (2024): ¥1.56 trillion (approximately USD 10.9 billion).
- Financial Services Revenue (2024): ¥1.82 trillion (approximately USD 12.7 billion).
- Console Sales: As of February 2024, Sony PlayStation 2 achieved the highest sales of home video game consoles worldwide, with 158.7 million units sold.
You May Also Like To Read
- Xiaomi Statistics
- Lenovo Statistics
- Asus Statistics
- Toshiba Statistics
- Intel Statistics
- Dell Statistics
- HP (Hewlett-Packard) Statistics
- Philips Statistics
- Apple Statistics
- Google Statistics
- Microsoft Statistics
- Airbnb Statistics
- Google Revenue Statistics
- Amazon Statistics
- Tencent Statistics
What is Sony?
SONY is a major manufacturer of consumer electronic products. The Company was established in 1946; it was formerly known as Tokyo Tsushin Kogyo K.K. The Company is headquartered in Minato City, Tokyo, Japan. It operates in different segments, such as games and network services, mobile communications, Music, pictures, home entertainment, sound, semiconductors, imaging products and solutions, financial services, etc.
History Of Sony
- Founded in 1946: Sony was founded by Masaru Ibuka and Akio Morita as Tokyo Tsushin Kogyo (Tokyo Telecommunications Engineering Corporation) with just 20 employees and a capital of 190,000 yen (about USD 530).
- First Product: Sony’s first product was a rice cooker, but it was unsuccessful. They later found success with their TR-63 transistor radio, which became a global hit in the 1950s.
- Name Origin: The name “Sony” is derived from the Latin word “sonus,” meaning sound, and “sonny,” a colloquial term used in America to refer to a young boy, symbolizing the company’s youthful and innovative spirit.
- Innovations: Sony has a history of pioneering products, including the first portable music player (Walkman), the first CD player, and the PlayStation gaming console.
- Acquisition of Columbia Pictures: In 1989, Sony acquired Columbia Pictures for $3.4 billion, marking its significant entry into the Hollywood movie industry.
- Largest Music Publisher: Sony Music Entertainment is one of the world’s largest music publishers, managing the rights of many famous artists and songs.
- PlayStation Success: The PlayStation 2, released in 2000, is the best-selling home console of all time, with over 158 million units sold worldwide.
- Sony Pictures: Sony Pictures is known for producing blockbuster films such as the Spider-Man series, Men in Black, and Jumanji.
- Environmental Initiatives: Sony has committed to achieving a zero environmental footprint by 2050 through its “Road to Zero” initiative.
- Robotics and AI: Sony has been at the forefront of robotics with products like AIBO, the robotic dog, and has significant investments in artificial intelligence.
General Sony Statistics
- The United States has 35.52% of the traffic rate directed towards sony.com, but this has shown an increase in the number of visitors by 19.52%.
- Sony Statistics further states that in 2024, Sony’s market shares are expected to be PlayStation (66.6%), an image sensor (55%), and Sony Music Entertainment (20%).
- In 2024, the Game and network Services (G&NS) segment, which includes PlayStation consoles and related services, generated approximately ¥4.49 trillion (USD 31.06 billion) in revenue.
- Sony’s music segment saw a 14% year-on-year increase in the last quarter, reaching ¥482 billion (USD 3.15 billion).
- Lastly, the pictures segment reported a 9% increase in sales, amounting to ¥1.493 trillion (USD 10.3 billion).
(Source: statista.com)
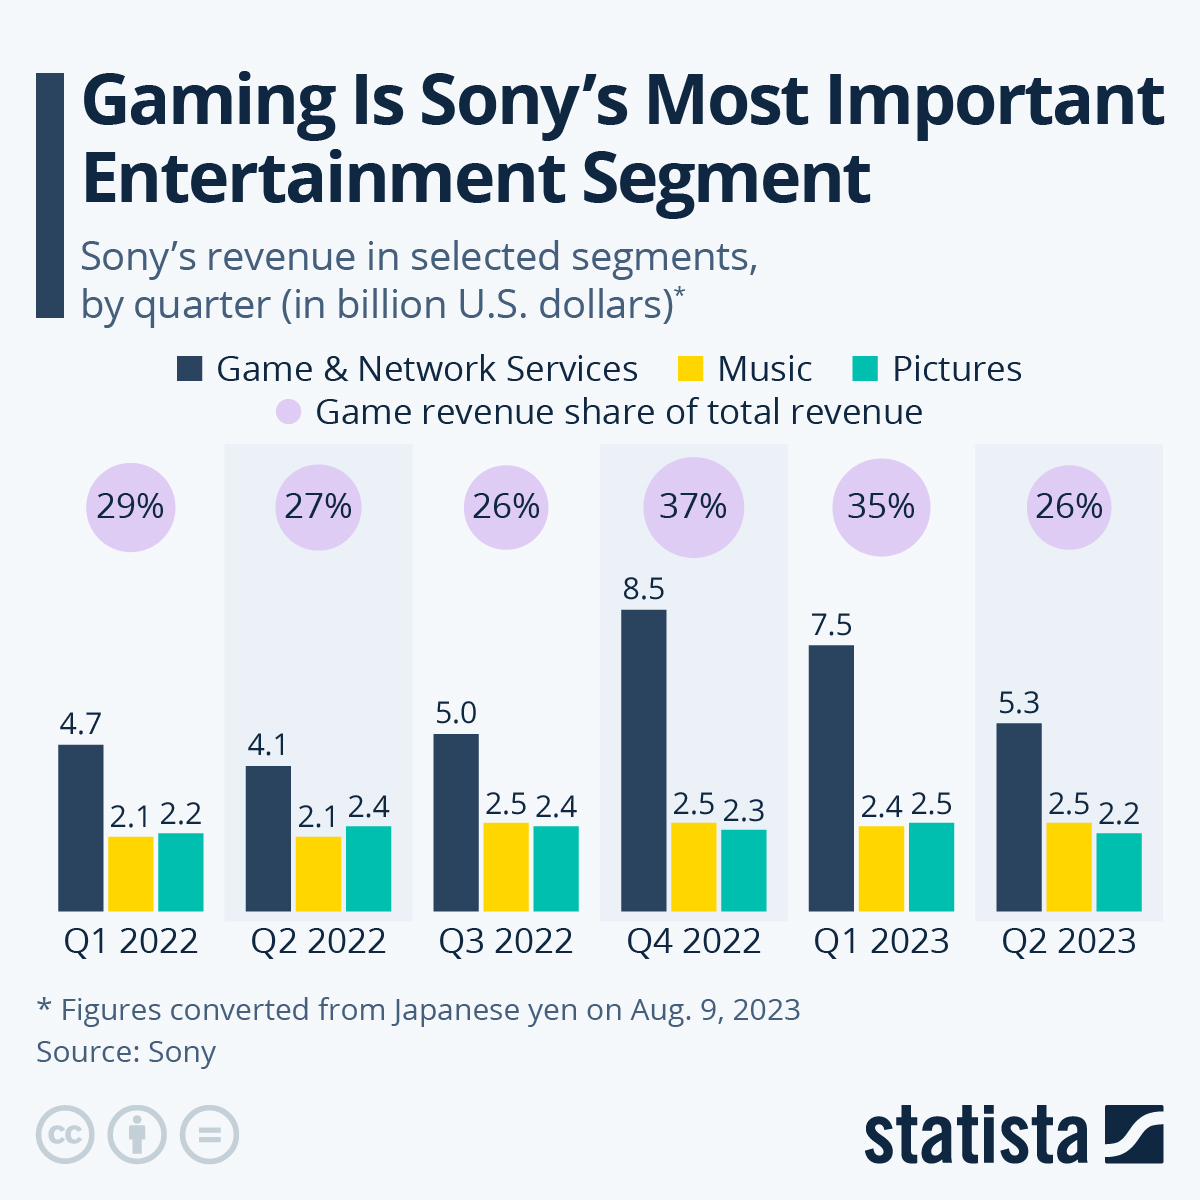
- As stated by Sony Statistics, in 2023, the gaming segment remains Sony’s most important entertainment.
- Quarterly revenue earned by different segments in Q1 is followed by Game and network services (USD 7.5 billion), Music (USD 2.4 billion), and pictures (USD 2.5 billion), resulting in a 35% revenue share.
- Meanwhile, in Q2, segmental revenue analyses were conducted by Game and network services (USD 5.3 billion), Music (USD 2.5 billion), and pictures (USD 2.2 billion), resulting in a 26% revenue share.
- In January and February 2024, the website sony.com received 32.9 million and 32.1 million traffic from global visitors respectively.
Sony’s Total Revenue
 (Source: macrotrends.net)
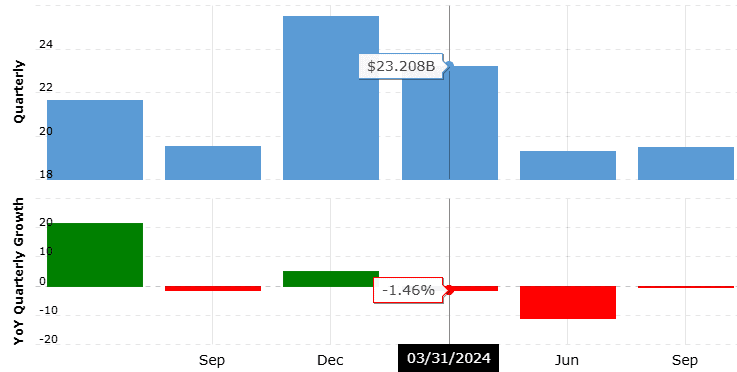
- In fiscal year 2024, Sony Group reported total annual revenue of approximately USD 89.843 billion, marking a 5.21% increase from the previous year.
- Q1 (April – June): USD 20.344 billion
- Q2 (July – September): USD 19.514 billion
- Q3 (October – December): USD 29.787 billion
- Q4 (January – March): USD 23.514 billion
Sony’s Total Revenue From Fiscal year 2007 to 2023
(in billion Japanese yen / billion U.S. dollars)
| Fiscal years | Billion Japanese yen | Billion U.S. dollars* |
| 2007 | 8,871 | 88.71 |
| 2008 | 7,729 | 78.88 |
| 2009 | 7,209 | 77.57 |
| 2010 | 7,177 | 86.52 |
| 2011 | 6,493 | 79.19 |
| 2012 | 6,796 | 72.35 |
| 2013 | 7,767 | 75.41 |
| 2014 | 8,216 | 68.47 |
| 2015 | 8,106 | 71.73 |
| 2016 | 7,603 | 67.89 |
| 2017 | 8,544 | 77.04 |
| 2018 | 8,665.70 | 78.14 |
| 2019 | 8,259.90 | 75.99 |
| 2020 | 8,999.40 | 84.82 |
| 2021 | 9,921.51 | 88.35 |
| 2022 | 10,974.37 | 73.27 |
| 2023 | 13,020.77 | 86.84 |
(Source: Statista)
- In FY2007, Sony’s revenue was 8,871 billion yen, equivalent to 88.71 billion U.S. dollars.
- In FY2008, the revenue dropped to 7,729 billion yen, which is 78.88 billion U.S. dollars.
- Sony’s revenue continued to decrease in FY2009 to 7,209 billion yen, or 77.57 billion U.S. dollars.
- In FY2010, revenue slightly decreased to 7,177 billion yen, translating to 86.52 billion U.S. dollars.
- FY2011 saw further decline in revenue to 6,493 billion yen, equivalent to 79.19 billion U.S. dollars.
- In FY2012, revenue was 6,796 billion yen, amounting to 72.35 billion U.S. dollars.
- Revenue increased in FY2013 to 7,767 billion yen, or 75.41 billion U.S. dollars.
- Sony’s revenue in FY2014 was 8,216 billion yen, equivalent to 68.47 billion U.S. dollars.
- In FY2015, revenue was 8,106 billion yen, amounting to 71.73 billion U.S. dollars.
- FY2016 saw revenue of 7,603 billion yen, which is 67.89 billion U.S. dollars.
- Revenue increased again in FY2017 to 8,544 billion yen, translating to 77.04 billion U.S. dollars.
- In FY2018, Sony’s revenue was 8,665.7 billion yen, or 78.14 billion U.S. dollars.
- FY2019 revenue was 8,259.9 billion yen, amounting to 75.99 billion U.S. dollars.
- Sony’s revenue in FY2020 increased to 8,999.4 billion yen, equivalent to 84.82 billion U.S. dollars.
- In FY2023, Sony recorded its highest revenue in this period at 13,020.77 billion yen, or 86.84 billion U.S. dollars.
- The net income of Sony in FY2023 was approximately 6.5 billion U.S. dollars.
- The most profitable segment for Sony is Game and Network Services.
- Over 32% of Sony’s sales in FY2023 were achieved through mobile communications.
- Sony has been a key market player in the television industry, though Samsung leads the market, followed by LG and TCL.
Sony Group Market Cap Statistics
 (Source: statmuse.com)
| Month | Closing Price (USD) | Shares Outstanding (billion) | Market Cap (USD billion) |
| December 2024 | 21.16 | 6.072 |
128.48 |
|
January 2025 |
22.01 | 6.024 | 132.60 |
| February 2025 | 25.04 | 6.024 |
150.85 |
|
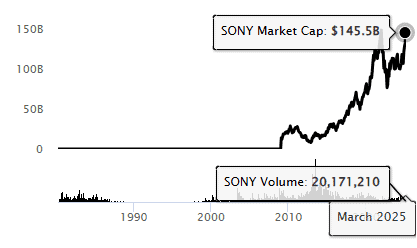
March 2025 |
24.15 | 6.024 |
145.49 |
(Source: stockanalysis.com)
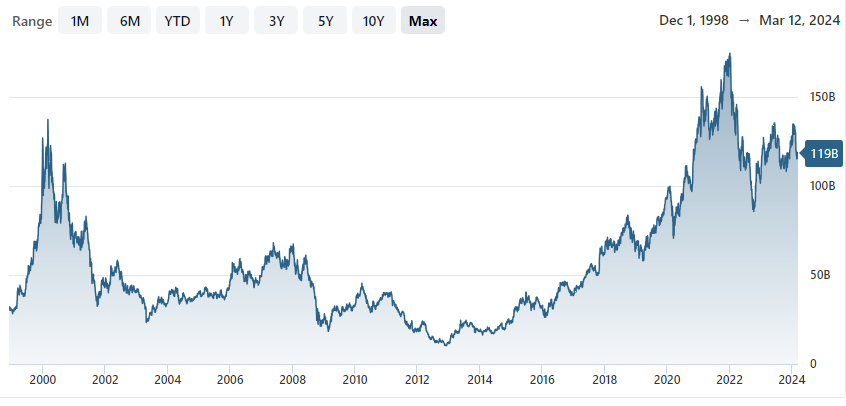
- As mentioned in Sony’s stock analysis on 12 March 2024, Sony Group’s net worth or market cap was USD 118.67 billion, which increased by 1.14% from the previous year.
- The Sony group’s enterprise value and stock price were USD 123.15 billion and USD 87.75, respectively.
- Monthly market cap of the group in 2023 are 6th January (USD 110.43 billion), 28th February (USD 113.4 billion), 27th March (USD 117.5 billion), 21st April (USD 124.89 billion), 17th May (USD 128.90 billion), 26th June (USD 122.21 billion), 21st July (USD 126.29 billion), 17th August (USD 111.43 billion), 25th September (USD 112.61 billion), 20th October (USD 112.50 billion), 29th November (USD 116.43 billion), and 26th December (USD 126.40 billion).
- Furthermore, market cap in 2024 are 8th January (USD 124.95 billion), 19th January (USD 133.91 billion), 2nd February (USD 133.28 billion), 15th February (USD 124.40 billion), 1st March (USD 119.04 billion), and 8th March (USD 117.94 billion).
Sony Statistic by Region
(Reference: wallstreetzen.com)
- Sony Statistics further states that the United States has generated the highest revenue in the Company, with ¥3.4 trillion in 2023.
- Furthermore, revenue accounted for by other regions in Japan (¥2.69 trillion), Europe (¥2.19 trillion), Asia Pacific (¥1.56 trillion), China (¥855.44 billion), and Others (¥837.3 billion).
- As of 2024, Japan: 23%, equating to about 3.03 trillion yen (USD 21 billion).
- United States: 29%, approximately 3.75 trillion yen (USD 26 billion).
- Europe: 20%, around 2.63 trillion yen (USD 18 billion).
- China: 8%, totaling 1 trillion yen (USD 6.9 billion).
- Asia-Pacific: 13%, about 1.66 trillion yen (USD 11.5 billion).
- Other Regions: 7%, roughly 948 billion yen (USD 6.5 billion).
You May Also Like To Read
- Anker Statistics
- Sennheiser Statistics
- Seagate Statistics
- Razer Statistics
- Motorola Statistics
- Samsung Statistics
- Garmin Statistics
- Panasonic Statistics
- LG Statistics
- Huawei Statistics
- Oppo Statistics
- iPhone Statistics
Net Sales of Sony’s Game and Network Services by Segment
- In the first quarter of 2023, Sony’s Game and network services net sales by segment were Hardware (186.99 billion yen), game software (406.22 billion yen), physical software (24.4 billion yen), digital software (153.39 billion yen), add-on content (211.95 billion yen), other software (16.47 billion yen), network services (124.5 billion yen), and others (54.18 billion yen).
- In Q2 of 2023, segmental analysis is followed by Hardware (287.51 billion yen), game software (479.33 billion yen), physical software (35.52 billion yen), digital software (200.98 billion yen), add-on content (211.11 billion yen), other software (20.71 billion yen), network services (133.89 billion yen), and others (53.37 billion yen).
- In Q3 of 2023, segmental analysis is followed by Hardware (474.26 billion yen), game software (733.06 billion yen), physical software (87.36 billion yen), digital software (2082.82 billion yen), add-on content (349.16 billion yen), other software (13.72 billion yen), network services (137.18 billion yen), and others (99.92 billion yen).
Sony’s Play Station Sales Statistics
(Reference: statista.com)
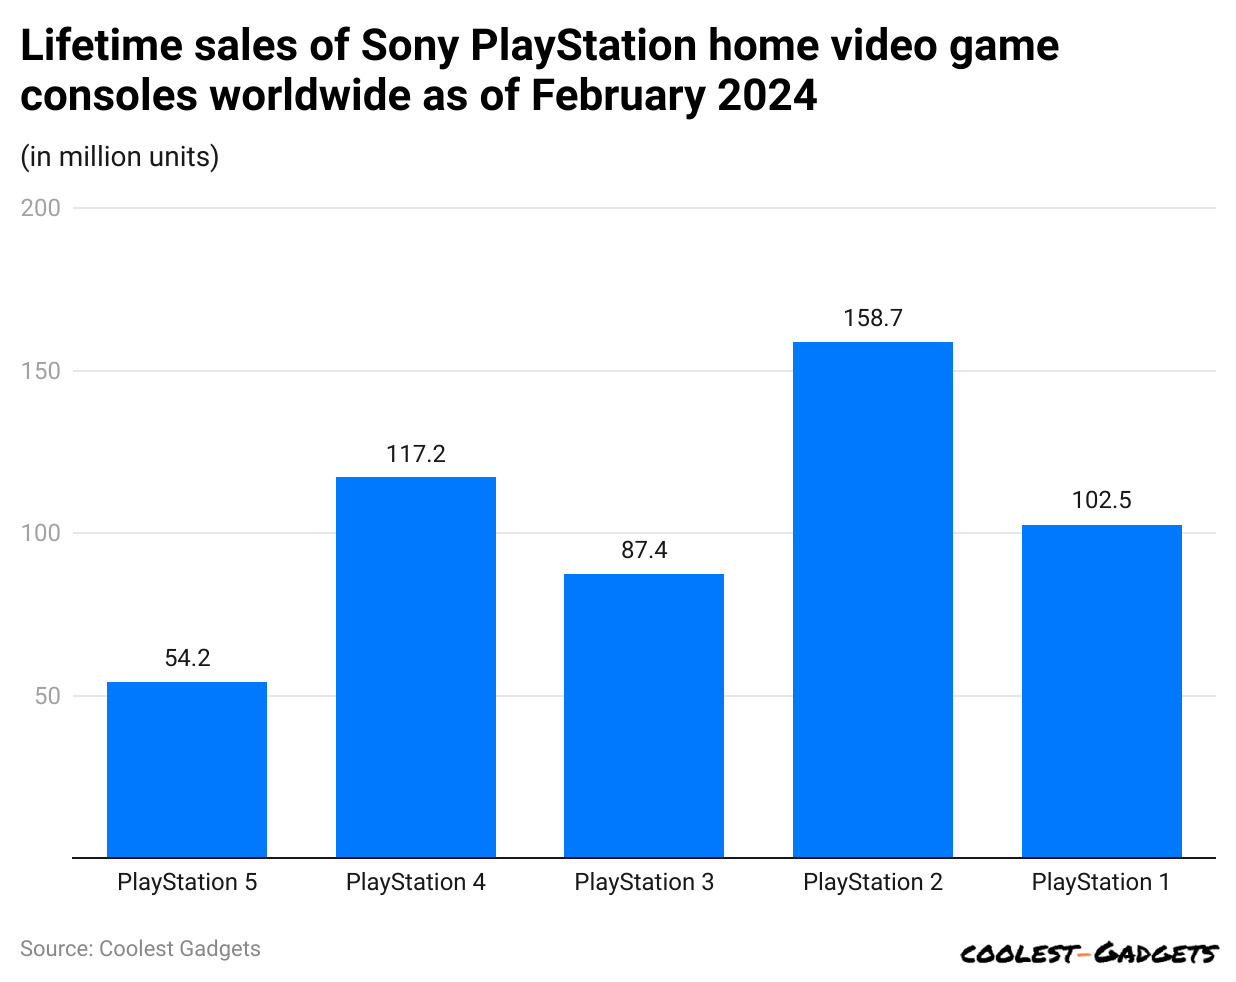
- As per a report of Sony statistics in February 2024, Sony Play Station 2 recorded the highest sales of home video game consoles worldwide with 158.7 million units.
- The next highest sold-out game consoles are Play Station 4 (117.16 million units) and Play Station 1 (102.49 million units).
- Moreover, other video game consoles sales are Play Station 3 (87.4 million units) and Play Station 5 (54.17 million units).
Sony’s Play Station Network Statistics by Users
(Reference: statista.com)
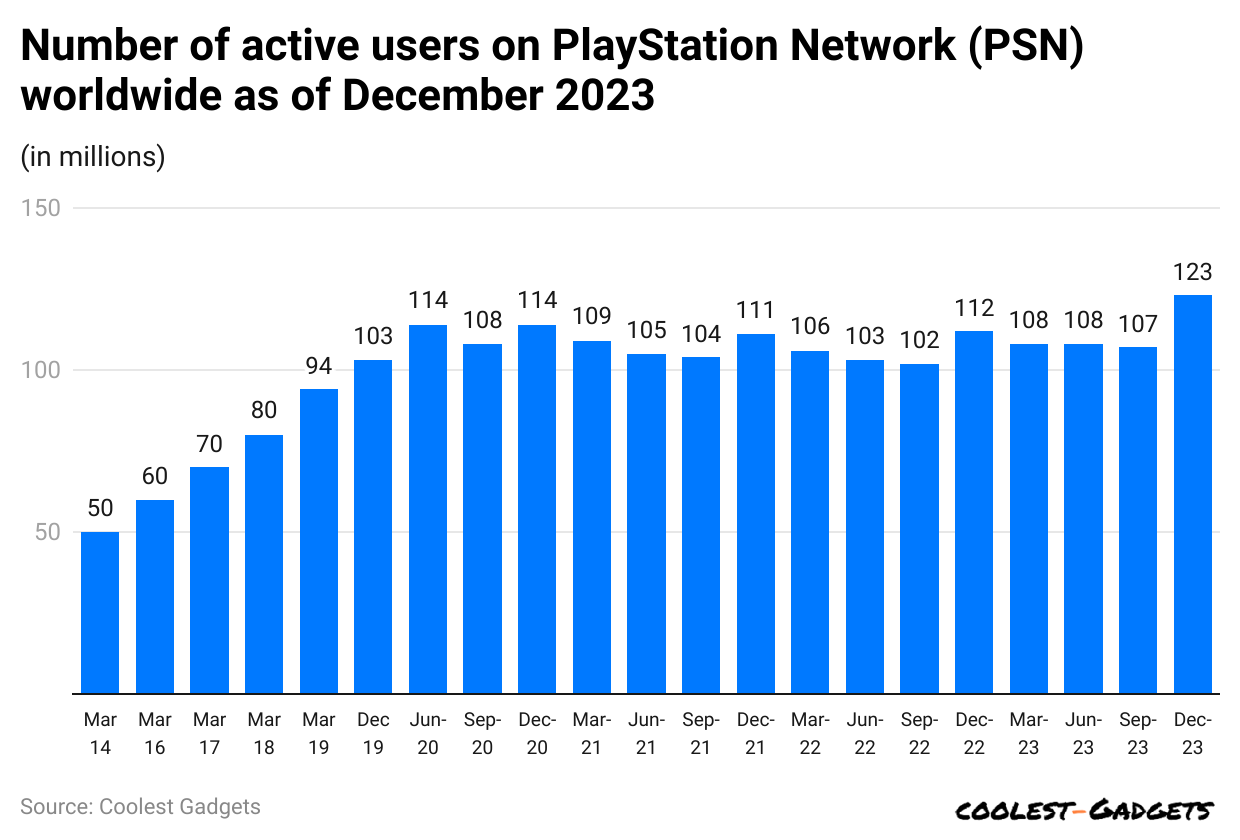
- Sony Statistics of 2023 states, the total number of active users on PlayStation Network worldwide by the end of March was 108 million.
- Furthermore, other numbers of active users by monthly end in 2023 are June (108 million), September (107 million), and December (12 million).
Sony Group Stock Forecast Statistics
- Sony Group Corporation saw major financial changes in 2024. On October 1, the company introduced a five-for-one stock split to make shares more affordable and easier to trade.
- TipRanks suggests an average 12-month target of USD 30.50, ranging from USD 28.00 to USD 33.00. MarketBeat estimates an average price of USD 28.00, expecting a 16.06% rise from the current USD 24.13.
- com also forecasts USD 28.00 on average, with a range between USD 23.00 and USD 33.00, indicating a possible 15.94% increase in Sony’s stock price.
(Source: stockanalysis.com)
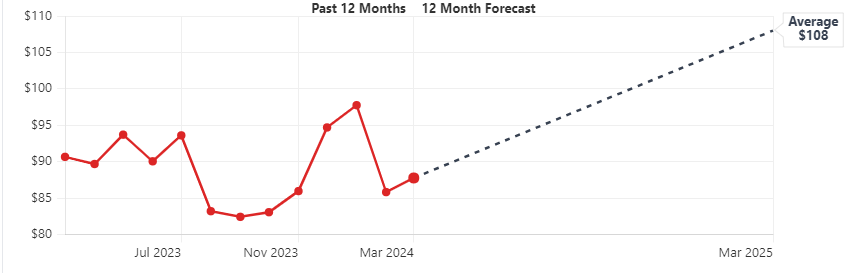
- As of 2023, Sony Group’s month-end stock price is followed by March (USD 90.65), April (USD 89.67), May (USD 93.7), June (USD 90.04), July (USD 93.6), August (USD 83.19), September (USD 82.41), October (USD 83.05), November (USD 85.95), and December (USD 94.69).
- January (USD 97.75), February (USD 85.81), and March (USD 87.75) follow with monthly forecasts for 2024.
- The average stock price of Sony Group is expected to be USD 108 by March 2025, with a 23.08% growth rate.
Sony Statistics by Sales Category
(Source: seekingalpha.com)
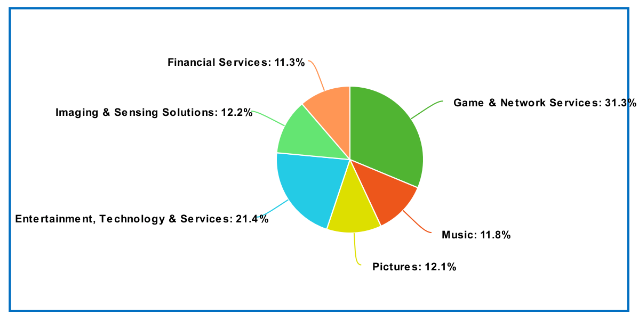
- According to Sony Statistics, the highest sales were accounted for by the Games and Network Services segment, which had a 31.3% share in 2023.
- Furthermore, Sony offers segment shares in Entertainment, Technology, and Services (21.4%), Imaging and Sensing Solutions (12.2%), Pictures (12.1%), Music (11.8%), and Financial Services (11.3%).
Sony Statistics by Music Entertainment Statistics
(Source: digitalmusicnews.com)
- The operating income of the music segment was 81 billion yen ($ 535.14 million) in 2023.
- Sony Corporation’s music segment’s annual sales and operating revenue was $10.35 billion.
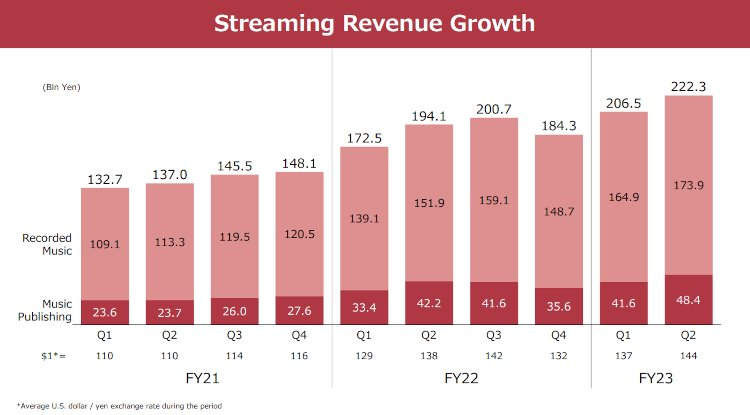
- Sony Statistics show that in the 3rd quarter of 2023, the global Music Entertainment market has recorded 13% Year-over-year growth from the last quarter.
- During the same period, Sony’s recorded music streaming generated 173 billion yen (USD 1.15 billion), with 14.43% growth.
- Based on Sony’s music publishing, revenue was 82.73 billion yen (USD 546.57 million), with 14.79% Year-on-Year growth.
- Sony Statistics also show that in Q4 2024, Sony’s music division earned approximately USD 2.07 billion from recorded music, a 6.9% increase over the previous year.
- Streaming revenue contributed USD 1.38 billion, up 9.2% from the previous year. Physical music sales declined by 6.8% to USD 198.6 million.
- Overall, Sony’s strong performance in its music and gaming sectors led to a 1% increase in operating profit for the third quarter, reaching 469.3 billion yen.
Sony Statistics by Business Segment Employees
 (Reference: statista.com)
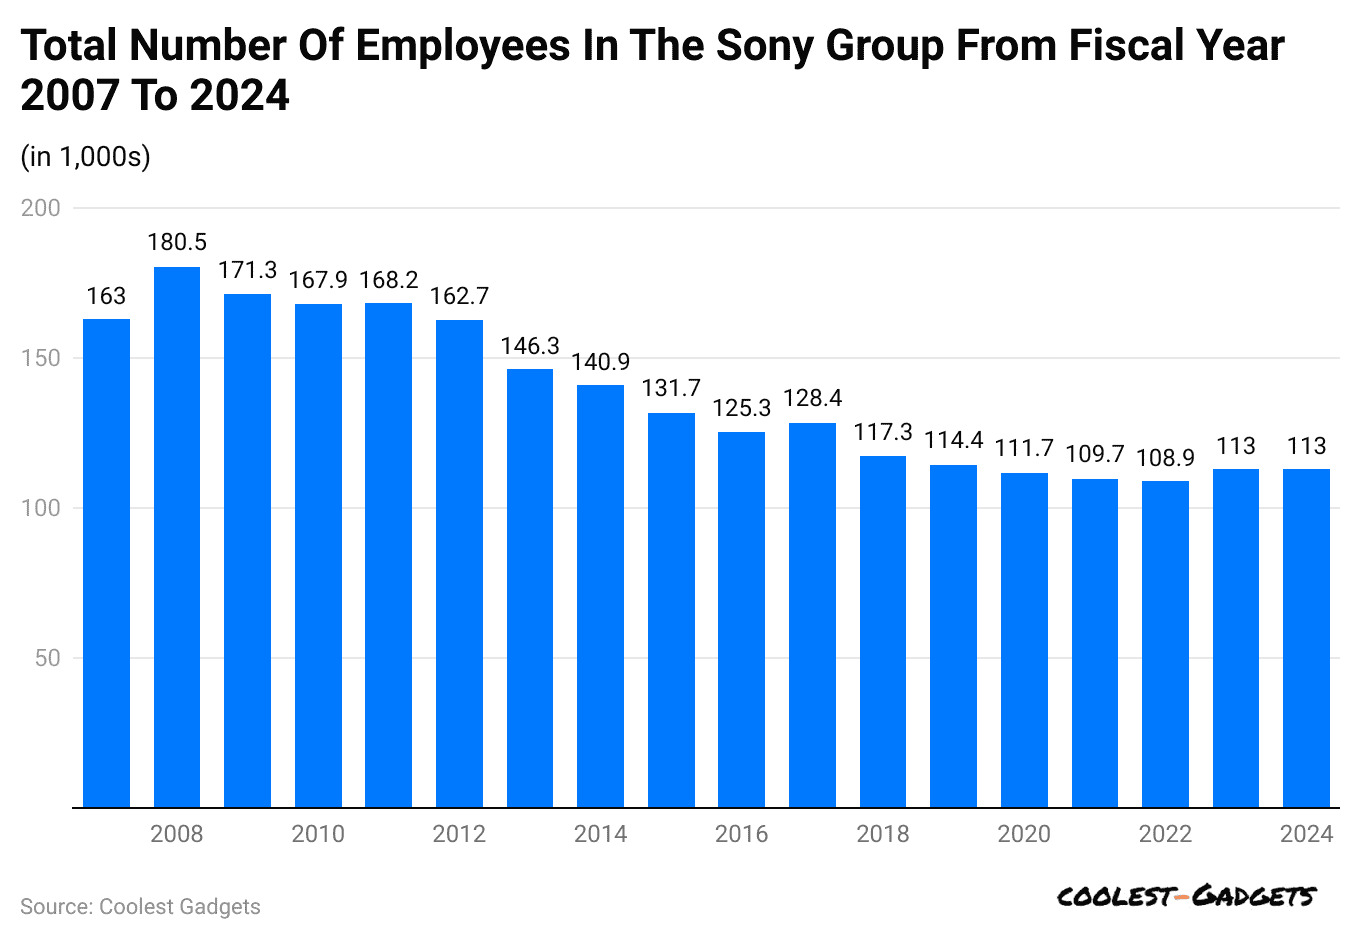
- As of fiscal year 2024, Sony employed approximately 113,000 individuals globally.
- In its electronics segment, there were over 71,000 employees.
- The financial services segment had around 13,600 employees, while the music segment employed about 11,300 individuals.
(Reference: statista.com)
- As per Sony Statistics, the total number of employees in the Sony electronic business segment was more than 71.4 thousand in 2023.
- Additionally, total employees in other business segments of the Company are financial services (71.4 thousand), Music (11.1 thousand), Pictures (9.1 thousand), Group companies in Japan (5.8 thousand), and others (2.1 thousand).
Sony Statistics by Digital Camera Market
- In 2024, Sony led Japan’s mirrorless camera market with a 35.8% share, up from 34% in 2023.
- Canon’s share decreased to 26% from 28.3%, while Nikon secured 14.5%, rising from the previous year’s 12.5%
- The global market for digital cameras was USD 5.14 billion in 2023 and is expected to reach USD 6.51 billion by 2028, with a 4.85% CAGR.
(Reference: Shopify.com)
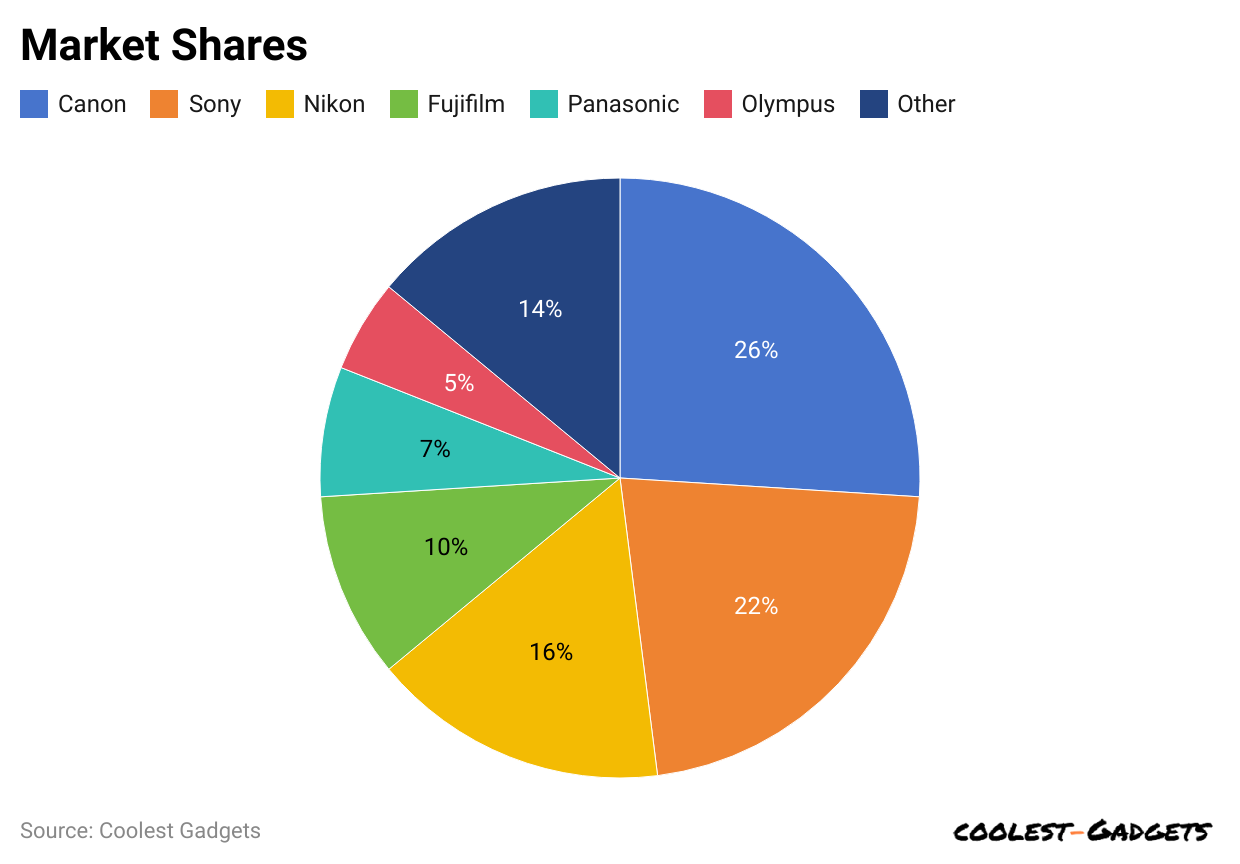
- As of April 2023, Sony was holding the second-highest market with a 22% share among other brands of digital cameras.
- Canon holds the top position with 26% market share, while other brand shares are followed by Nikon (16%), Fujifilm (10%), Panasonic (7%), Olympus (5%), and others (14%).
- Sony introduced a new Cyber-shot RX 100 VII compact camera in 2023, including features such as a 20.1-megapixel sensor, 24-200 mm zoon lens, hybrid autofocus, pop-up electronic viewfinder, and 180-degree tiltable LCD screen.
Sony Statistics by Television
- In the first quarter of fiscal year 2024, Sony’s Electronics Products & Solutions segment, which includes television sales, reported a 5% year-on-year increase in sales, reaching 600.9 billion yen (approximately USD 4.1 billion).
- Similarly, in the second quarter, sales decreased by 11% year-on-year to 355.8 billion yen (approximately USD 2.4 billion).
(Reference: jamiedonissony.weebly.com)
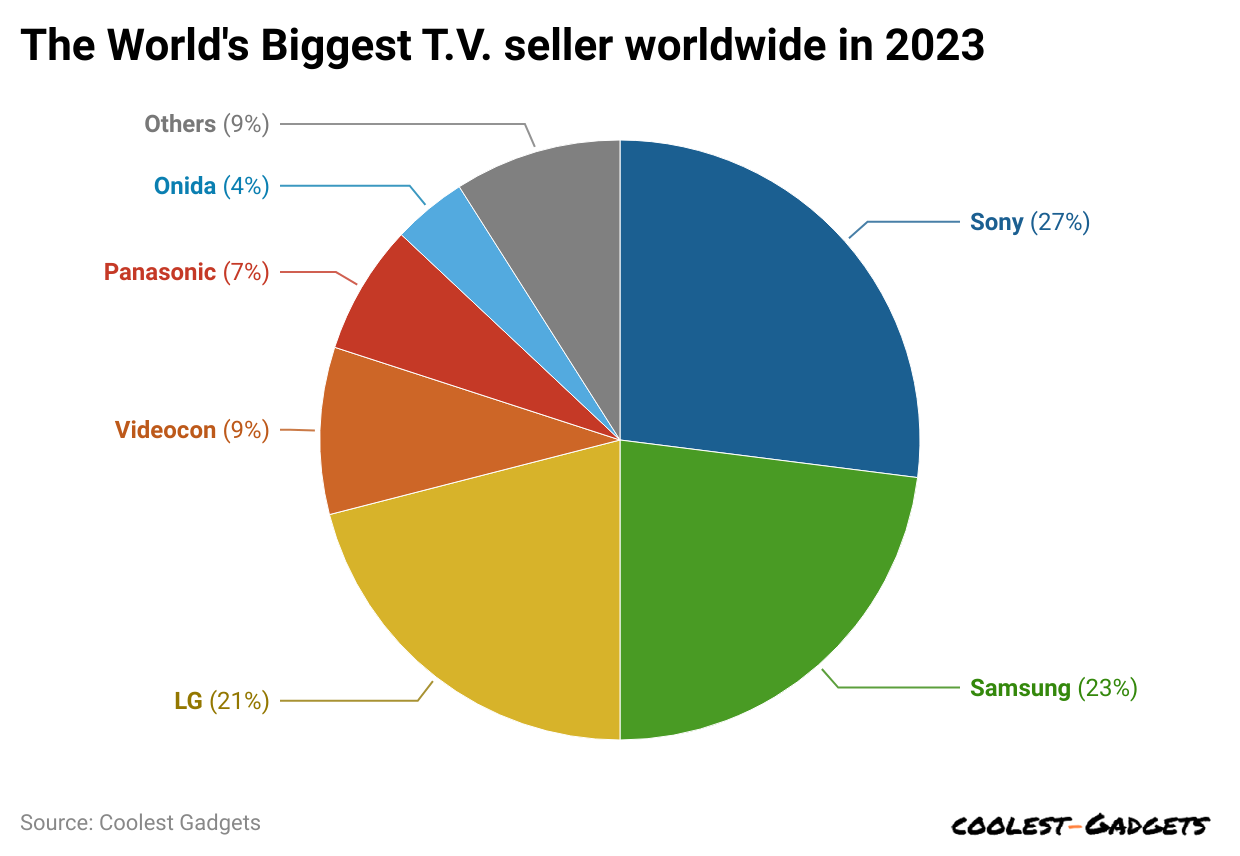
- Sony is the world’s biggest T.V. seller worldwide in 2023, with a market share of 27%.
- Per Sony Statistics’ survey reports, around 72% of Sony TV respondents are male users, and 28% are female users.
- Reasons for purchasing Sony TV are Appearance (28%), picture quality (34%), price (15%), and word of mouth (33%).
- Nearly 42% of people around the globe have been using Sony TV for the last 2 to 3 years.
- Meanwhile, other users’ share by period is 23% (1 to 2 years), 20% (more than years), and 15% (less than one year).
- The primary functions of TV use are live television (70%), streaming (18%), film (7%), and gaming (5%).
- The types of Sony TVs purchased by users share are smart Android TVs (36%), LED TVs (27%), Full HD TVs (21%), and Ultra HD TVs (16%).
Sony Statistics by SonyLiv
- According to Sony Statistics, SonlyLiv has downloaded more than 100 million apps both from Android and iOS.
- In India, the platform’s daily revenue is up to USD 15,057, followed by USD 458,278 (monthly) and USD 5,495,689 (yearly).
- In 2023, SonlyLiv gained nearly 33.3 million subscribers, and by 2023 end the platform is expected to achieve 50 million paid subscribers.
- Maximum users belong to the age group of 18 to 24 years, accounting for a 42.86% share.
- This OTT platform is available in 9 languages such as English, Hindi, Bengali, Marathi, Malayalam, Telugu, Tamil, Punjabi, and Kannada.
Consumer Electronics Statistics by Brands
(Source: traqline.com)
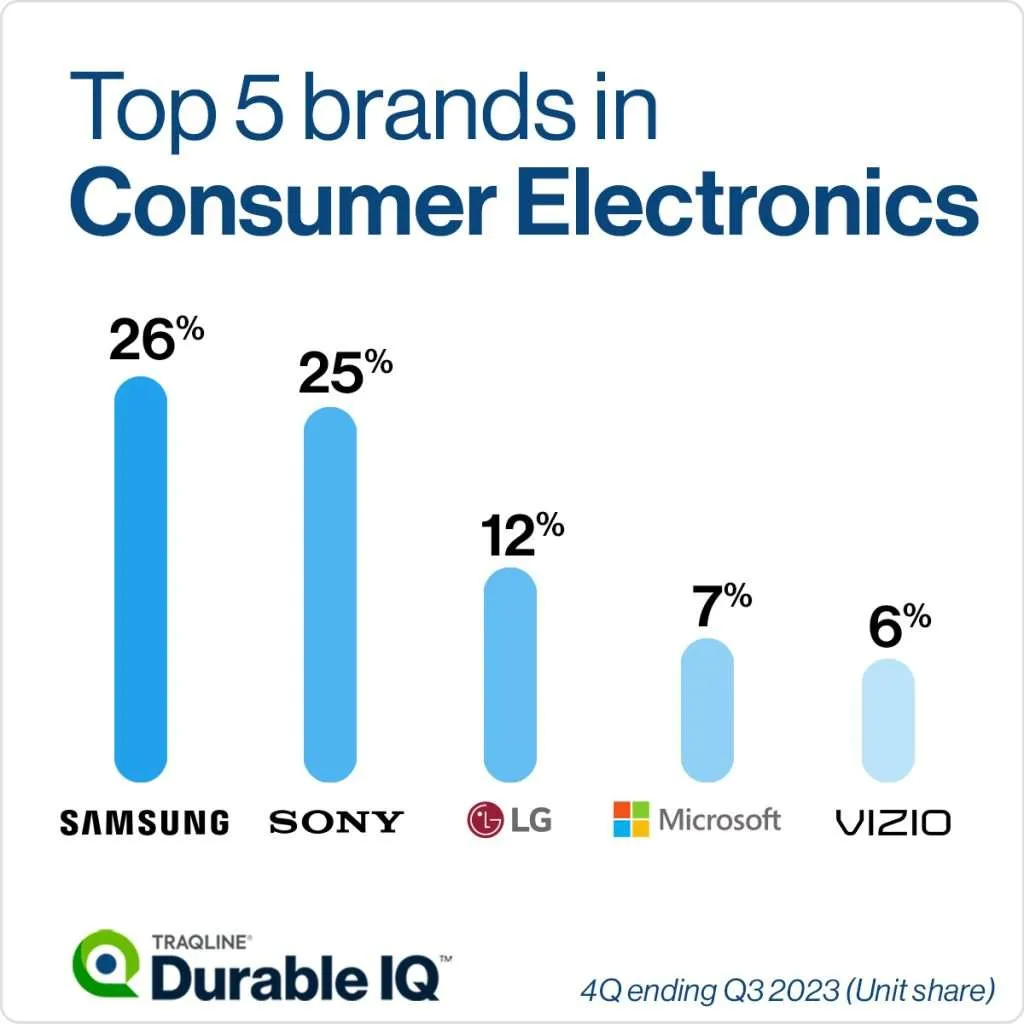
- As of September 2023, the most popular consumer electronics brand was Sony, which made a 21% share of the total unit shipments with a growth rate of 1.7%
- Similarly, in dollar shares purchased, the leading brands are Samsung and Sony, which hold 26% and 25% of shares, respectively.
Sony Website Traffic Statistics by Country
(Source: similarweb.com)
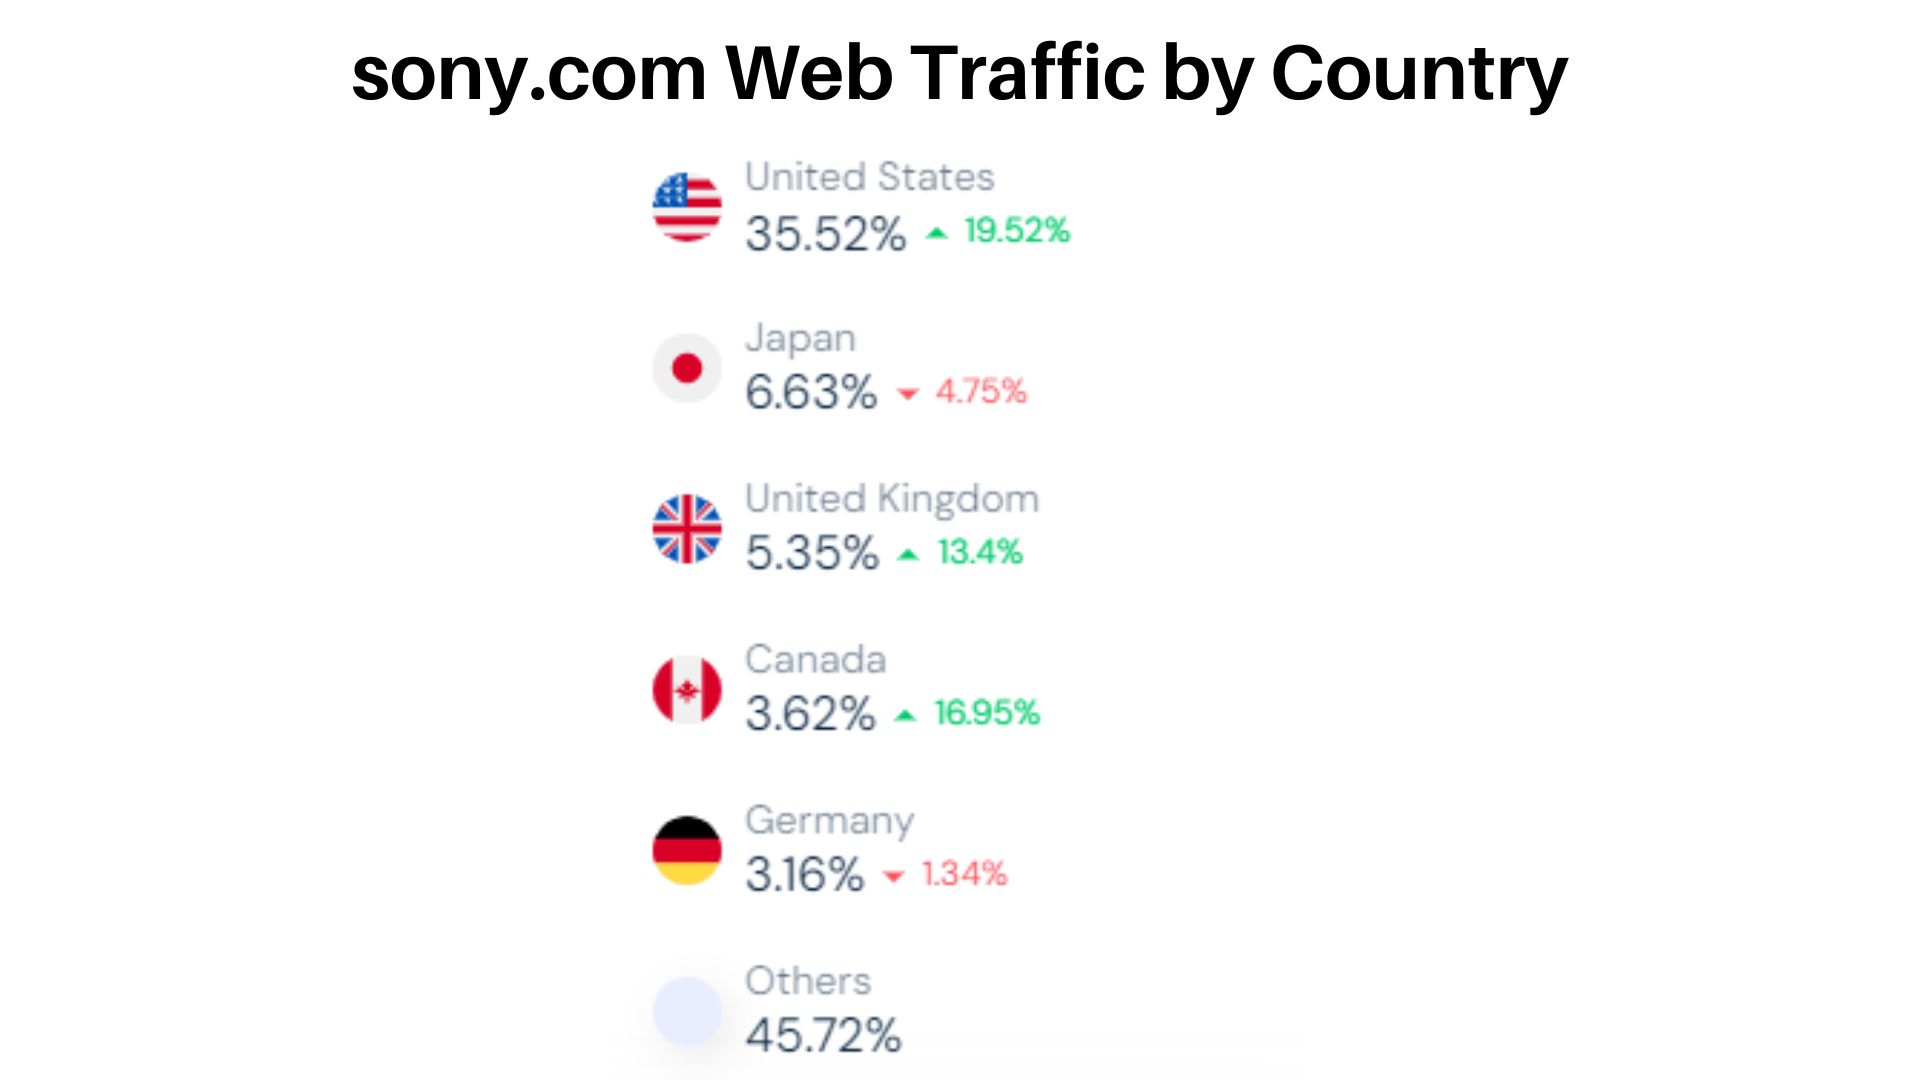
- The United States has 35.52% of the traffic rate directed towards sony.com, but this has shown an increase in the number of visitors by 19.52%.
- Japan and the United Kingdom account for around 6.63% and 5.35% of the traffic rate respectively, with a decreasing rate of 4.75% in Japan and an increasing rate of 13.4% in the U.K.
- From the point of view of Sony Statistics, Canada has 3.62% of the total traffic and an increasing visitor rate of 16.95%.
- Meanwhile, Germany has 3.16% of the traffic share with a decreasing rate of 1.34% visitors.
- Other countries collectively made up around 45.72% of website visitors.
You May Also Like To Read
- Apple Customer Loyalty Statistics
- Apple Smartphone Statistics
- Apple MacBook Statistics
- Google Smartphone Statistics
- (Advanced Micro Devices) AMD Statistics
- Xiaomi Smartphone Statistics
Sony Statistics by Demographics
- In 2023, most Sony Electronics employees are white, resulting in a 50% share, followed by Hispanic (22%) and Asian (15%).
- Male and female employees of the Company are 77.1% and 22.9% respectively.
- 66% of employees have a minimum bachelor’s degree.
- The salary of Sony Electronics employees is USD 67,875 per year in 2023, and the average employee span was around 1 to 2 years.
(Reference: similarweb.com)
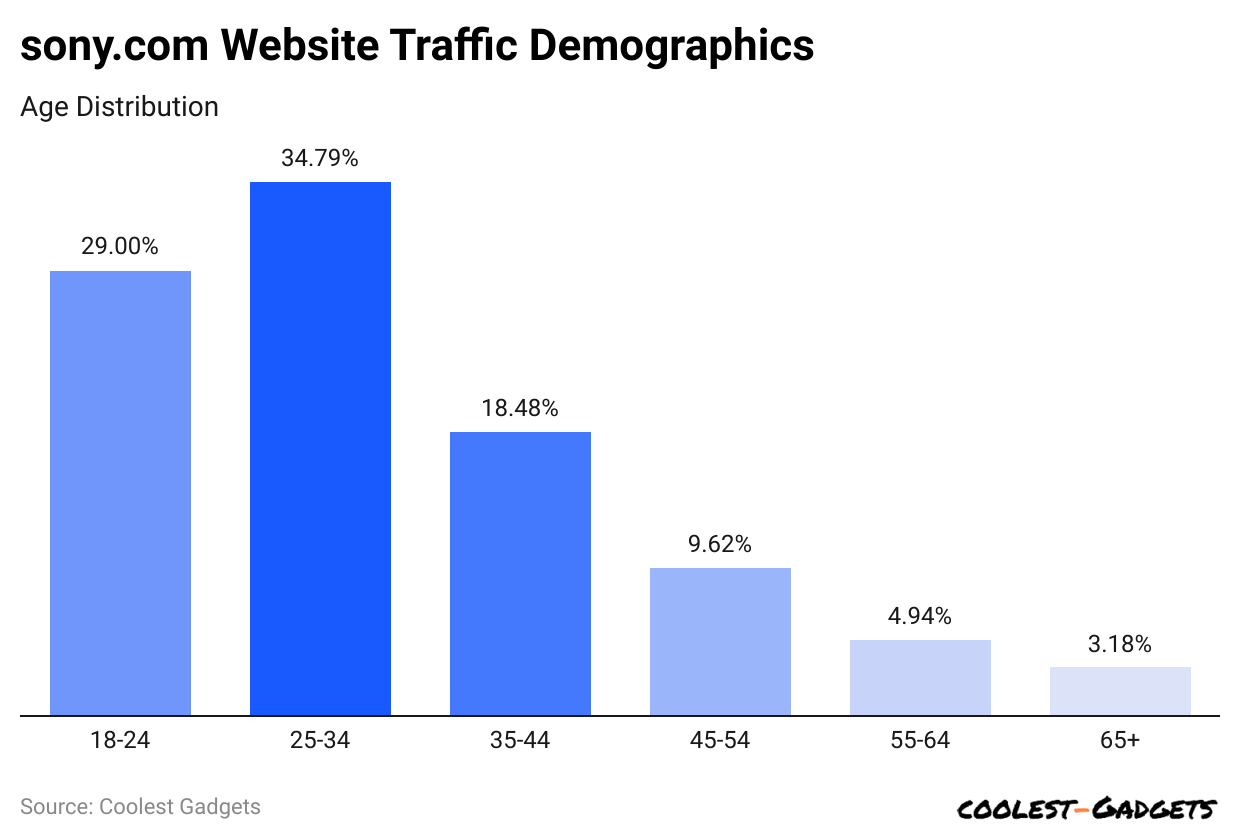
- The highest number of website visitors on sony.com are aged 25 to 34, resulting in a 34.79% share.
- Moreover, there are 29% of users aged 18 to 24 years.
- People aged 35 to 44 and 45 to 54 contribute 48% and 9.62% of website traffic, respectively.
- 4.94% of people are in the 55- to 64-year-old group, and 3.18% of website visitors are 65 years or older.
- Male and female users of sony.com hold 71.18% and 28.82% shares respectively.
Sony Statistics by Traffic Source
(Reference: similarweb.com)
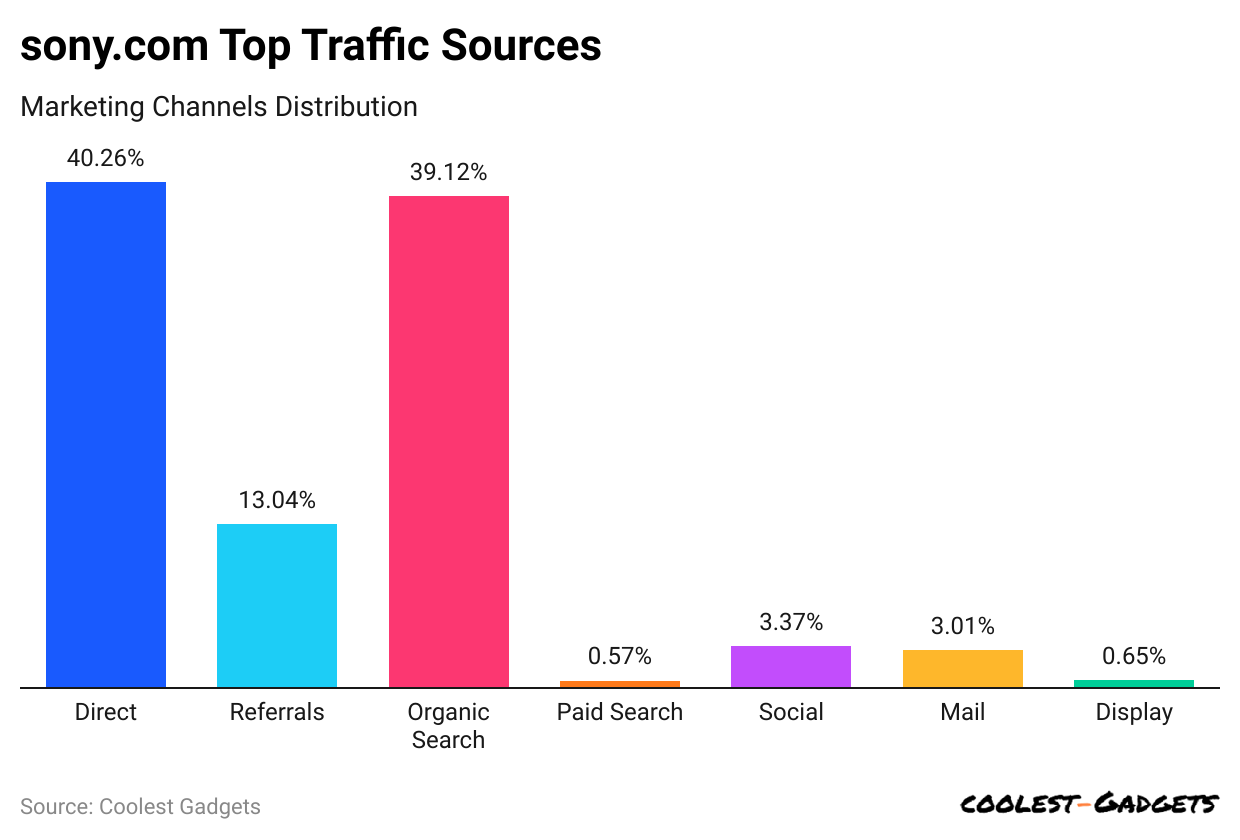
- Sony Statistics by website traffic source states that the highest traffic rate to sony.com in February 2024 was from direct searches, at 40.26%.
- Meanwhile, 39.12% of traffic is generated by organic search, and 13.04% is accounted for referral search.
- Furthermore, other traffic sources of sony.com are paid search (0.57%), social (3.37%), mail (3.01%), and display (0.65%).
Sony Statistics by Social Media Referral Rate
(Reference: similarweb.com)
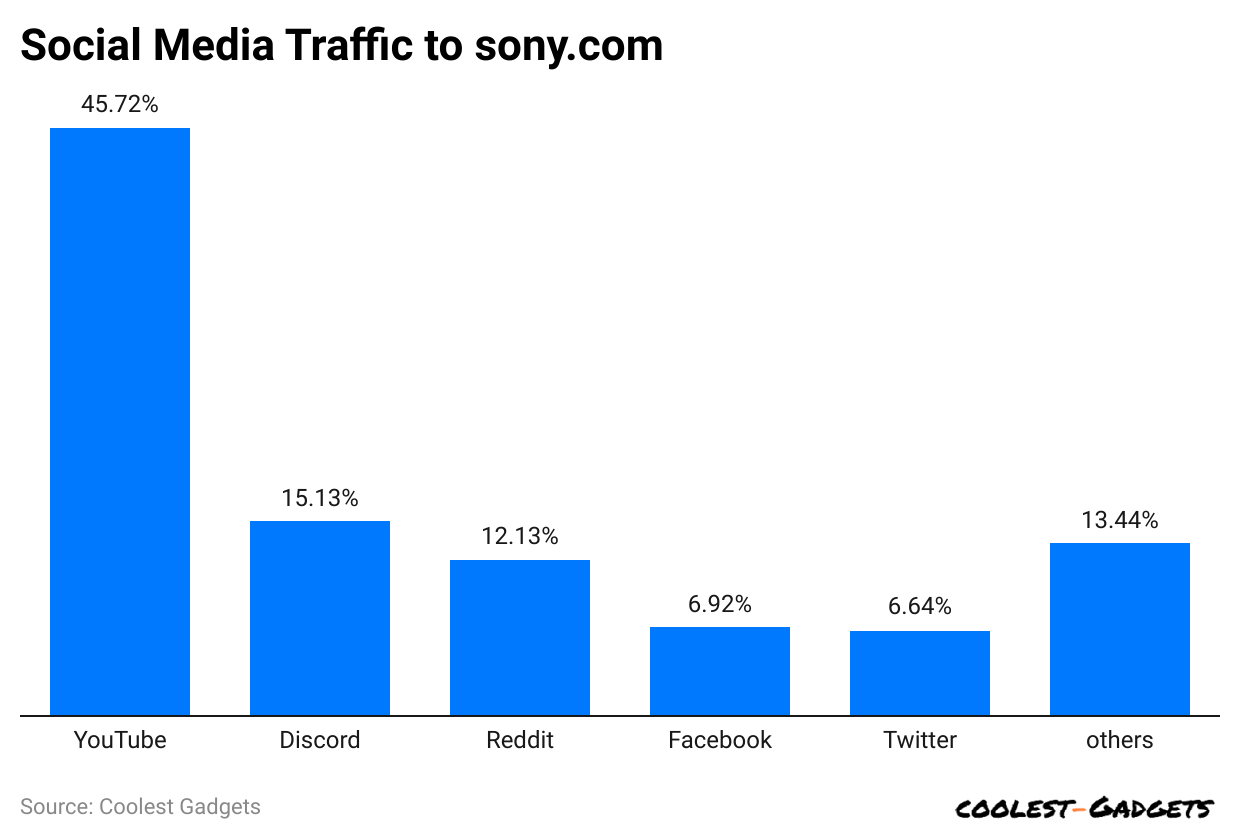
- YouTube and Discord account for higher referral traffic rates, resulting in 45.72% and 15.13% respectively.
- 13% of website traffic is sent by Reddit, while Facebook contributes around 6.92%.
- Twitter has a 6.64% referral rate, and other social media networks collectively make up 13.44% of referral traffic.
Sony Statistics by Device Traffic
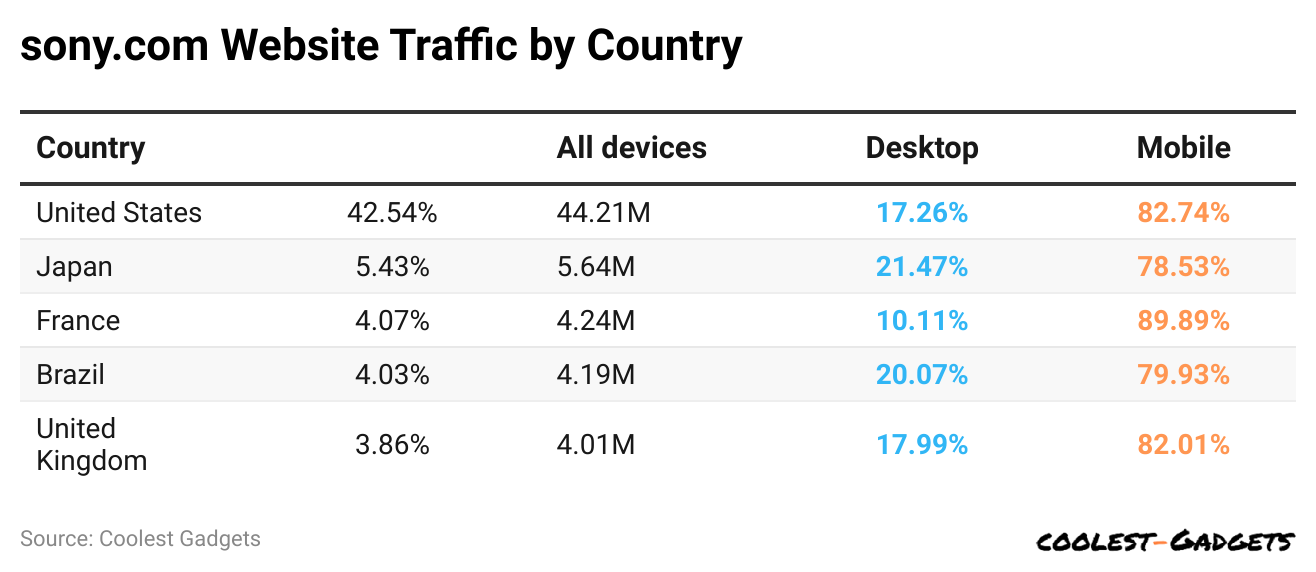
(Reference: semrush.com)
- As demonstrated by Sony Statistics, the website Sony.com has the highest number of traffic from the United States of America resulting in an overall 42.53% of total traffic. It has around 44.21 million visitors, of which 17.26% are desktop and 82.74% are mobile.
- Japan and France contribute around 5.43% and 4.07%, respectively, with a total of 5.64 million and 4.24 million devices.
- Japan has 21.47% of desktop and 78.53% mobile visitors, while France has 10.11% and 89.89% of desktop and mobile visitors.
- Brazil and the United Kingdom generate 4.03% and 3.86% of traffic, resulting in 4.19 million and 4.01 million total devices.
- Whereas Brazil contributes 20.07% (desktop) and 79.93% (mobile), and the U.K. has 17.99% (desktop) and 82.01% (mobile) visitors.
Best-selling Products of Sony
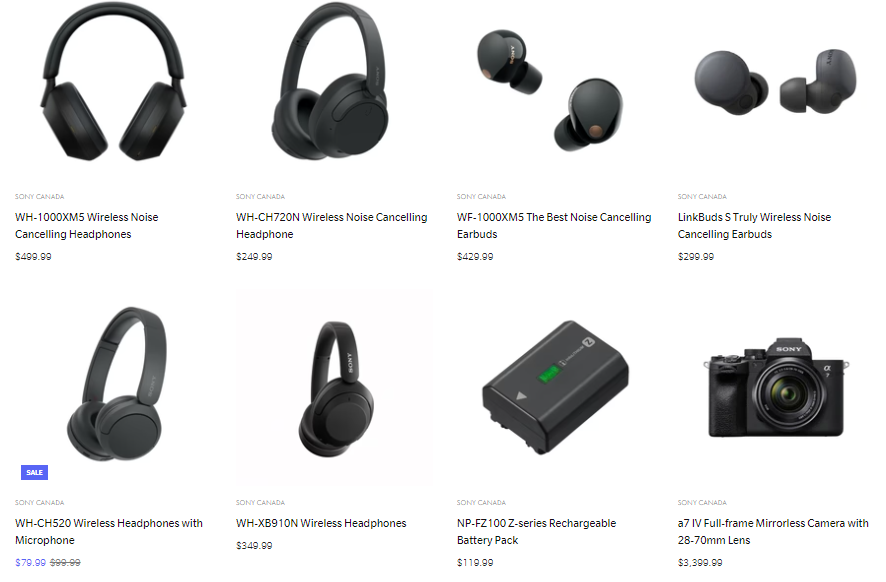
(Source: thesonyshop.ca)
Conclusion
After completing the article on Sony Statistics, the main focus of Sony is innovation, quality, design, reliability, customer interaction, and collaborations with diverse activities. In the global consumer electronics industry, the brand Sony continues to be the global market leader.
Sony has revolutionized and shaped the digital world in terms of accessing information and communication. Now, going through all the above statistical analyses thoroughly will help you understand the global market effectively.
Sources
Joseph D'Souza started Coolest Gadgets in 2005 to share his love for tech gadgets. It has since become a popular tech blog, famous for detailed gadget's reviews and companies statistics. Joseph is committed to providing clear, well-researched content, making tech easy to understand for everyone. Coolest Gadgets is a trusted source for tech news, loved by both tech fans and beginners.