Interactive Kiosk Statistics and Facts

Updated · Apr 17, 2025


TABLE OF CONTENTS
- Introduction
- Editor’s Choice
- Types of Interactive Kiosks in Operations
- Features of Interactive Kiosks
- Interactive Kiosk Market Size By Market.us
- U.S. Interactive Kiosk Market Revenue Statistics by Components
- Retail Interactive Kiosk Market Statistics
- Interactive Kiosk Statistics by Other Industry
- Self-Service Kiosk Market Statistics
- Interactive Kiosk Statistics by Key Players
- By Regional Analyses
- Demand Influencing Factors of Interactive Kiosk Statistics
- 5 Factors to Consider When Choosing an Interactive Kiosk for Business
- Interactive Kiosk Statistics by Location
- Indoor Payment Kiosk Market Statistics
- Technological Advancements of Interactive Kiosk
- Conclusion
Introduction
Interactive Kiosk Statistics: Interactive kiosks are self-service machines that help users get information or complete tasks without needing assistance from a person. These kiosks are commonly placed in shopping malls, airports, museums, and healthcare centers. They are made to provide a simple and smooth experience, allowing people to check in, buy things, or find information quickly.
With technological improvements, interactive kiosks are becoming more advanced, featuring touchscreens, voice commands, and facial recognition. Reports show that interactive kiosks are on the rise, with many businesses noticing higher customer satisfaction and shorter wait times. These kiosks are expected to play a significant role in various industries, making services more efficient and accessible for everyone.
Editor’s Choice
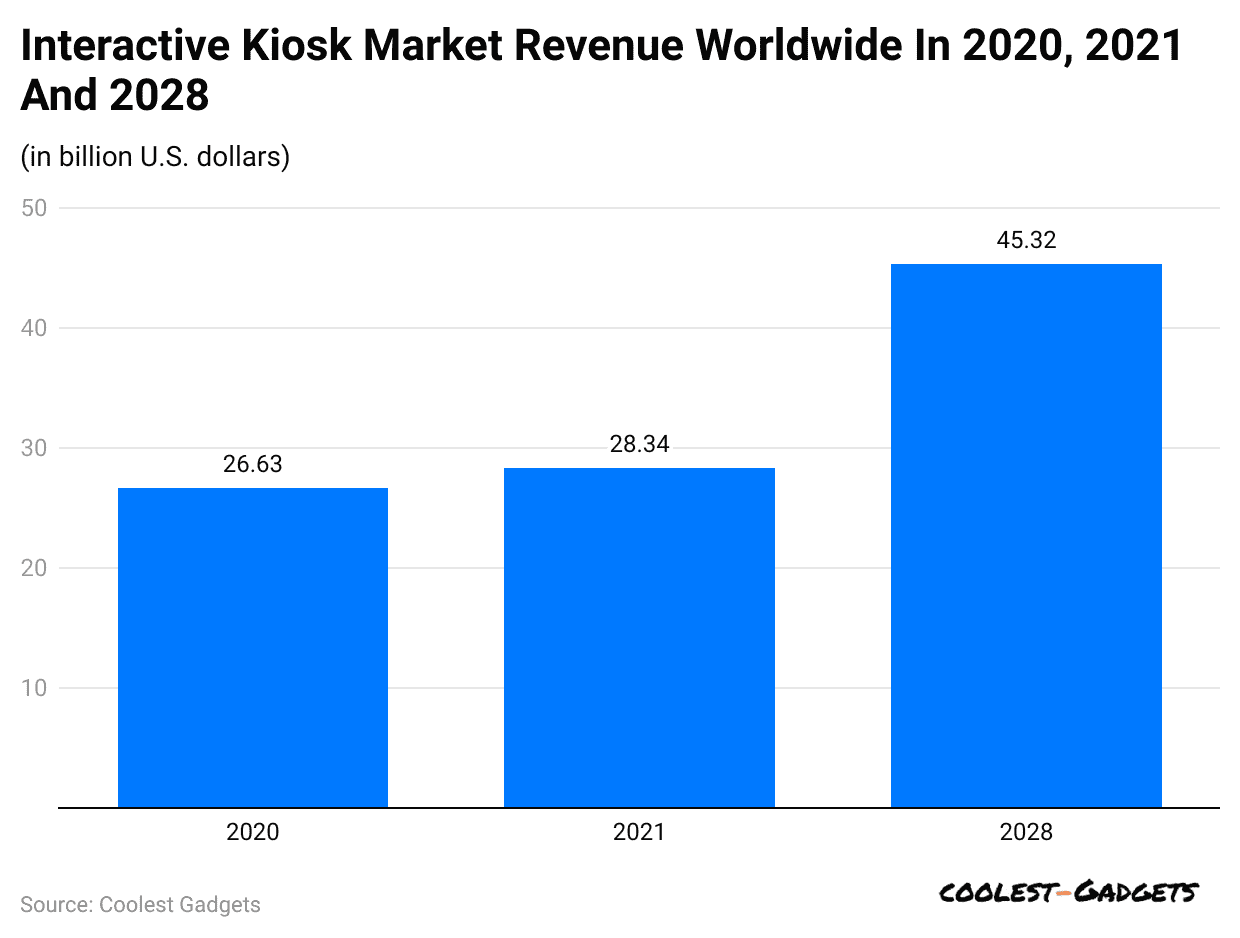
- Interactive Kiosk Statistics show that the global interactive kiosk market was valued at USD 33.9 billion in 2024.
- The interactive kiosk market is expected to reach USD 45.32 billion by 2028, with a 6.9% annual growth rate from 2021 to 2028.
- The retail interactive kiosk market is predicted to rise from USD 6.4 billion in 2024 to USD 7.06 billion in 2025, representing a 10.2% growth rate.
- The patient self-service kiosk market, valued at USD 1.14 billion in 2024, is forecast to reach USD 7.68 billion by 2037, growing at a rate of 15.8%.
- Around 66% of U.S. consumers prefer using self-service kiosks instead of traditional checkout counters.
- Olea Kiosk Inc. and GLORY Ltd. hold about 15% of the market share.
- Interactive Kiosk Statistics further states that North America has the largest market share, at 44%.
- By 2027, self-service kiosks are expected to generate USD 21.4 billion in revenue.
- A study found that 73% of shoppers prefer retail self-service technologies like self-checkout.
- According to a PYMTS survey, 49.4% of customers use self-service checkouts because they’re faster, while 34.7% like them for shorter lines.
 (Reference: statista.com)
Types of Interactive Kiosks in Operations
- As the Interactive Kiosk Statistics mentions, Wayfinding kiosks comprise 16% of the market, while printing kiosks account for 14%.
- Restaurant and retail order-and-pay kiosks both represent 11% each.
Furthermore, the table below shows the other types of Interactive Kiosks:
| Types | Share of Operations |
| Photo processing |
9% |
|
Bill Payment |
|
|
Wi-Fi |
|
|
Pharmacy self-serve |
|
|
Price checking |
|
|
Parking |
|
|
Phone Charging |
|
|
Gaming/entertainment |
|
|
HR/employee self-service |
7% |
|
Tourist information |
|
|
Coupon dispensing and/or redemption |
5% |
|
Airport/transportation check-in |
|
|
Hospital check-in |
|
|
Gift dispensing |
|
|
Vehicle license/registration renewal |
2% |
|
DVD rental |
|
|
Rental payment |
|
|
Locker pickup (“smart” lockers) |
|
|
Others |
18% |
Features of Interactive Kiosks
- Touchscreen Interface: Allows users to interact with the kiosk by tapping or swiping on a screen.
- Customizable Options: Can be tailored to different businesses and environments for specific services.
- Digital Signage: Displays ads, information, or promotions to passersby.
- User-Friendly: Designed to be simple for operating at all ages and skill levels.
- Multilingual Support: Offers options in multiple languages for a wider audience.
- Secure Payments: Includes options for credit card, mobile payments, and sometimes even cryptocurrency.
- Data Collection: Gathers information from users for surveys or analytics.
- Remote Management: Can be monitored and updated remotely for ease of maintenance.
- 24/7 Availability: Operates round the clock without the need for human intervention.
- Integration with Other Systems: Can connect to services like inventory management or ticketing systems.
Interactive Kiosk Market Size By Market.us
(Source: market.us)
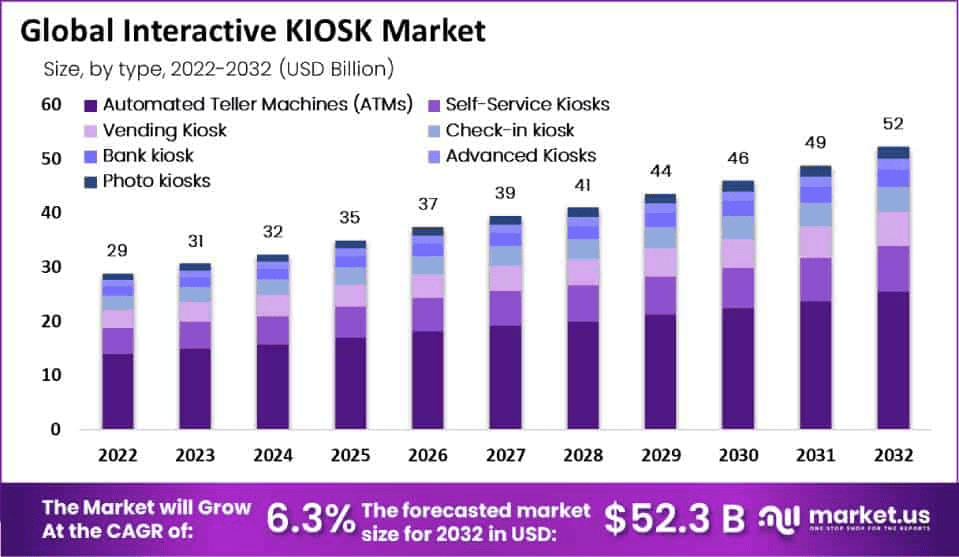
- The Global Interactive Kiosk Market is projected to reach approximately USD 52 billion by 2032, up from USD 31 billion in 2023.
- The market is expected to expand at a CAGR of 6.3% from 2023 to 2032.
- In 2022, Automated Teller Machines (ATMs) held a dominant share of approximately 48.6% of the global interactive kiosk market.
- North America led the global interactive kiosk industry in 2022, generating revenues of about USD 12.6 Billion, which accounted for over 44% of the total market.
- The Banking, Financial Services, and Insurance (BFSI) sector represented the largest application segment, holding more than 49% of the market share in 2022.
U.S. Interactive Kiosk Market Revenue Statistics by Components
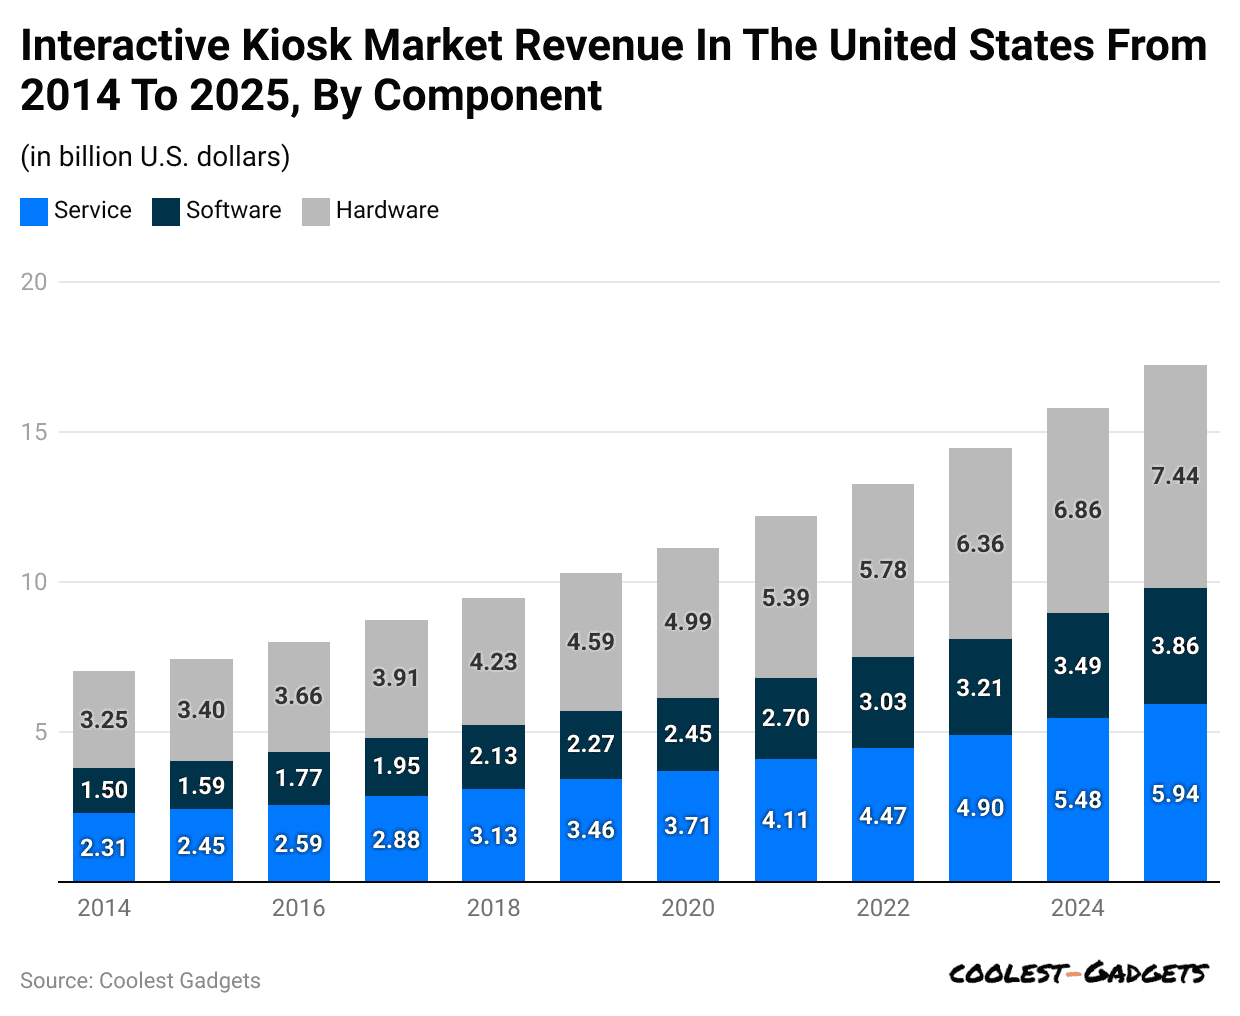 (Reference: statista.com)
| Year | Service (USD billion) | Software (USD billion) | Hardware (USD billion) |
| 2023 | 4.9 | 3.21 |
636 |
|
2024 |
5.48 | 3.49 | 6.86 |
| 2025 | 5.94 | 3.86 |
7.44 |
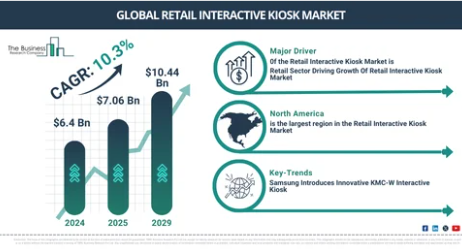
Retail Interactive Kiosk Market Statistics
 (Source: tbrc.info)
- Interactive Kiosk Statistics states that the retail interactive kiosk market is projected to grow from USD 6.4 billion in 2024 to USD 7.06 billion in 2025.
- This market is expected to grow rapidly, reaching USD 10.44 billion by 2029.
- The retail kiosk market’s compound annual growth rate (CAGR) is 10.3%.
Interactive Kiosk Statistics by Other Industry
| Industry | Market Size |
| Healthcare |
USD 1.3 billion in 2023, expected to grow to USD 4.0 billion by 2032 |
|
Transportation |
USD 3.0 billion in 2024, projected to reach USD 6.5 billion by 2035 |
| Education |
USD 2.87 billion in 2024, and it will grow to USD 5.9 billion by 2035 |
Self-Service Kiosk Market Statistics
- As per Interactive Kiosk Statistics in 2022, the self-service kiosk market was valued at approximately USD 13,916.5 million.
- This is expected to grow to USD 15,074.3 million in 2023.
- As of 2024, the market revenue generated reached USD 16,414.4 million, estimated to grow to USD 17,900 million by 2025 and USD 19,549 million by 2026.
- By the end of 2027, the market is forecasted to reach a significant revenue of USD 21,415.4 million.
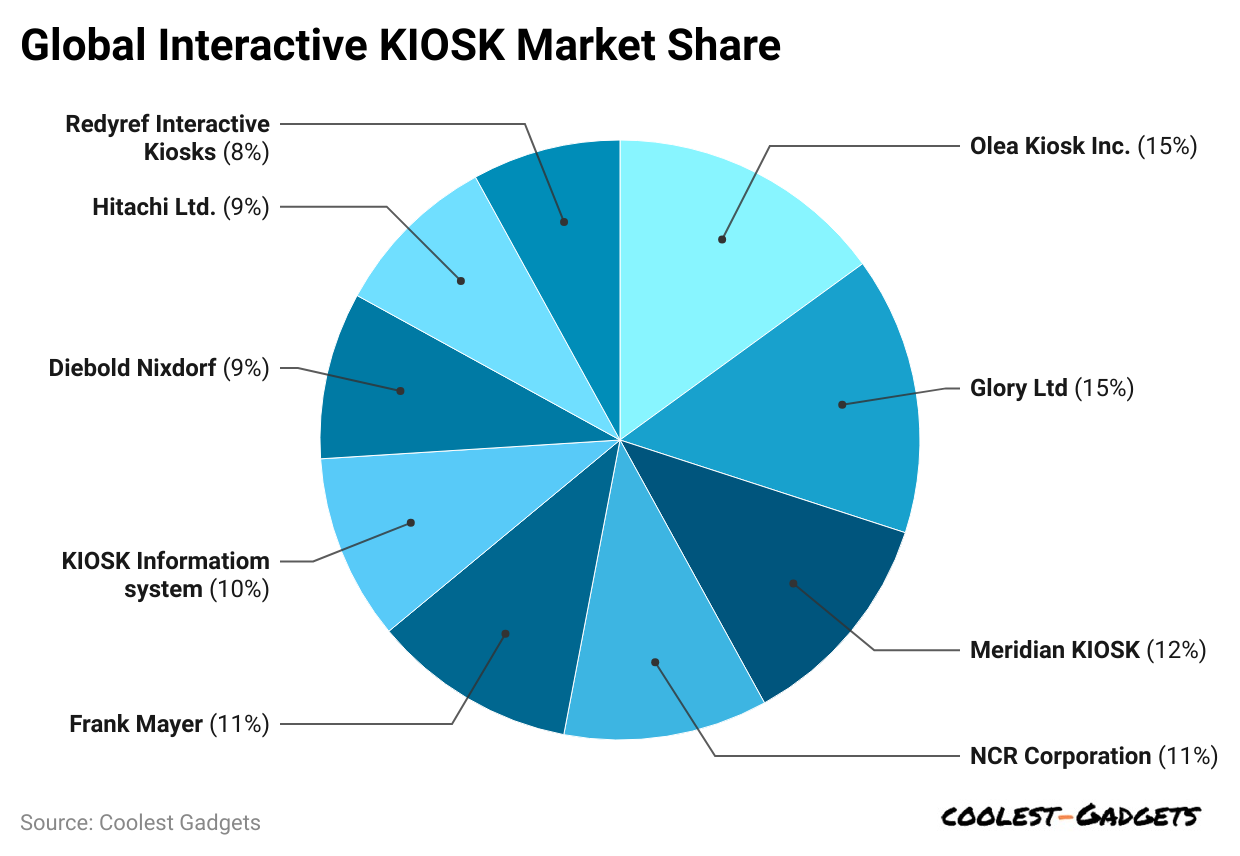
Interactive Kiosk Statistics by Key Players
 (Reference: scoop.market.us)
- Olea Kiosk Inc. and GLORY Ltd. have established themselves as major players, each holding a solid 15% market share, showing their strong influence and competitive advantage.
- Meridian KIOSK follows closely with a 12% share, positioning itself as another important company in the industry.
- NCR Corporation also has a notable presence with an 11% market share.
- Hitachi Ltd. and Frank Mayer each capture a 9% share.
- Diebold Nixdorf also holds a 9% share, highlighting its role in the industry.
- KIOSK Information Systems and REDYREF Interactive Kiosks further contribute to the market, with 10% and 8% shares, respectively.
By Regional Analyses
- Interactive Kiosk Statistics further stated that the market for Interactive Kiosks is spread across different regions. North America leads with the largest share of 44.0%.
- Europe comes second, holding a notable 23.0% share, which reflects the strong demand for self-service kiosks there.
- The Asia-Pacific (APAC) region is also a major contributor, with a market share of 22.5%.
- Meanwhile, Latin America and the Middle East & Africa (MEA) regions have smaller shares, at 5.3% and 5.2%, respectively.
Demand Influencing Factors of Interactive Kiosk Statistics
- According to the report, 86% of customers get frustrated when waiting for a refund, and 52% feel angry about payment delays.
- Additionally, 49% of customers become extremely frustrated when they can’t find what they need.
- These issues result in a significant financial loss, with an estimated 38 billion dollars in sales lost because customers leave stores due to long wait times.
- A study also found that 73% of shoppers prefer using retail self-service technologies, like self-checkout.
- Based on a survey by PYMTS, Interactive Kiosk Statistics found that 49.4% of retail customers prefer self-service checkouts for their speed.
- In comparison, 34.7% use them to avoid long lines.
- Introducing concession kiosks at Dodger Stadium led to a 20% increase in the average order value.
- In supermarkets, nearly 50% of shoppers use self-checkout for 75% of their visits, while 30% use it for half of their trips.
5 Factors to Consider When Choosing an Interactive Kiosk for Business
- Purpose and Functionality: Define the kiosk’s primary role, whether it’s self-checkout, information display, ticketing, or wayfinding.
- User Experience (UX) Design: Opt for a kiosk with an intuitive interface, clear navigation, and responsive touch capabilities.
- Integration Capabilities: Ensure the kiosk seamlessly integrates with your existing systems, such as point-of-sale (POS), customer relationship management (CRM), and inventory management.
- Durability and Maintenance: Choose a kiosk with robust materials suitable for indoor or outdoor environments.
- Compliance and Accessibility: Verify that the kiosk meets industry standards and regulations, such as ADA (Americans with Disabilities Act) compliance, to ensure accessibility for all users.
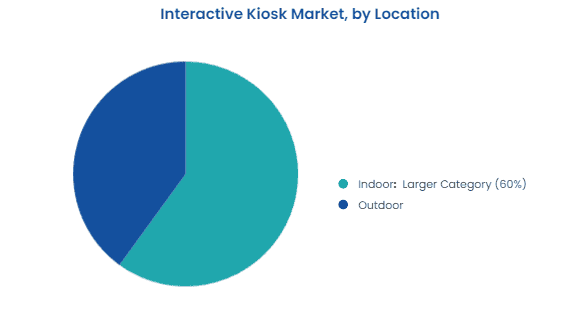
Interactive Kiosk Statistics by Location
 (Source: psmarketresearch.com)
- Interactive Kiosk Statistics also reports that in 2024, indoor kiosks made up 60% of the market, becoming the largest and fastest-growing category.
- The outdoor category followed with a 40% share in the market.
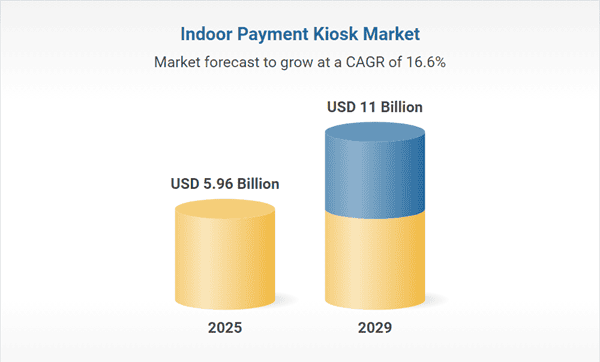
Indoor Payment Kiosk Market Statistics
 (Source: researchandmarkets.com)
- The indoor payment kiosk market is expected to grow from USD 5.1 billion in 2024 to USD 5.96 billion by the end of 2025.
- It is forecasted to reach USD 11 billion by 2029, with a compound annual growth rate (CAGR) of 16.6%.
- As of January 2024, the National Association of Convenience Stores reported that the number of convenience stores in the U.S. had increased to 152,396, a 1.5% rise from 2023.
- In April 2024, Worldline SA, a French provider of payments and transactional services, teamed up with Tabesto, a company specializing in smart solutions for restaurants and retail.
Technological Advancements of Interactive Kiosk
- As of 2025, almost 35% of new interactive kiosks will include touchless features like voice commands, gesture control, and facial recognition to improve user experience and safety.
- By 2026, 40% of kiosks in retail and healthcare will use AI to offer personalized experiences, such as custom recommendations, real-time data analysis, and better customer interactions.
Conclusion
Interactive kiosks are changing how customers interact with businesses by providing self-service options, personalized experiences, and faster access to information. They are commonly used in retail, hospitality, and healthcare sectors, helping businesses become more efficient and boosting customer satisfaction. With features such as touchscreens, real-time updates, and payment systems, these kiosks meet the increasing demand for convenience and easy access.
Interactive kiosks will evolve as technology advances, offering even more creative solutions. Businesses that implement these kiosks will improve their service and gain a competitive advantage, making them a valuable investment for the future.
FAQ.
Interactive kiosks allow users to interact with touchscreens for services, information, or transactions through simple, guided interfaces.
Interactive kiosks are commonly used in shopping malls, airports, museums, restaurants, hospitals, and public transportation stations.
Interactive kiosks provide self-service options, save time, improve customer experience, and reduce human error. They can also offer information, process payments, and enhance business efficiency.
Interactive kiosks can be secure if regularly updated, protected with strong passwords, and monitored for suspicious activity.
Interactive kiosks might replace some human jobs, but won’t completely replace employees in every area.
Interactive kiosks can be eco-friendly if designed with energy-saving features and sustainable materials, reducing paper waste and energy use.
Joseph D'Souza started Coolest Gadgets in 2005 to share his love for tech gadgets. It has since become a popular tech blog, famous for detailed gadget's reviews and companies statistics. Joseph is committed to providing clear, well-researched content, making tech easy to understand for everyone. Coolest Gadgets is a trusted source for tech news, loved by both tech fans and beginners.