Video-on-Demand Statistics By Region, Subscribers, Demographics And Revenue (2025)

Updated · Apr 23, 2025


TABLE OF CONTENTS
- Introduction
- Editor’s Choice
- Top VOD Companies By Market Share, 2025
- Video-on-Demand Statistics By Region
- VOD Services Monthly Subscription Price in the U.S.
- Number of Titles on SVOD Services Statistics by Content Type
- Video Streaming Subscriptions Used in the U.S. 2024, by Demographics
- Share of Consumers Using Another’s SVOD Passwords by Demographic
- Revenue of Subscription Video-on-Demand (SVOD) in the United States (From 2017 to 2029)
- Number of Subscription Video-on-Demand (SVOD) Users in the U.S.
- Monthly Market Share of SVOD Services Statistics
- Leading Original TV Series on SVOD Services Statistics by Minutes Streamed in 2024
- The Most-Watched Acquired TV Series on U.S. Streaming Platforms in 2024
- Video-on-Demand Statistics by Major Sporting Events
- SVOD Viewers Statistics by Number of Services Used
- SVOD Subscription Additions and Cancellations in the U.S.
- Monthly SVOD Churn Rate Statistics
- Top Reasons Americans Subscribe to Video Streaming Services
- Conclusion
Introduction
Video-on-Demand Statistics: People now watch movies, shows, and videos using Video-on-Demand (VOD) because it’s quick and simple. Instead of waiting for a fixed time, they can choose what to watch anytime they want. This freedom has made video-on-demand (VOD) platforms, such as Netflix, Amazon Prime, and Disney+, extremely popular.
As more people use smartphones and have access to faster internet, the number of VOD users continues to grow. This article examines key statistics that highlight the growth of the Video-on-Demand market, its primary users, and the potential future outlook. These numbers will help us understand why VOD is becoming the top choice for entertainment worldwide.
Editor’s Choice
- Video-on-Demand statistics indicate that the worldwide VOD market is projected to reach USD 133.44 billion by 2025, up from USD 113.78 billion in 2024.
- Approximately 1.4 billion people are projected to use video streaming services globally in 2025.
- Netflix anticipates earning between USD 43.5 billion and USD 44.5 billion in revenue for 2025.
- The global advertising-based VOD (AVOD) market is expected to grow at a 29.2% annual rate from 2025 to 2030.
- India’s VOD market is projected to be worth USD 4.2 billion by 2025, with an annual growth rate of 17.3%.
- Globally, the average revenue per VOD user is estimated at USD 114.60 in 2025.
- Subscription-based VOD (SVOD) is expected to contribute around 70% of OTT service revenues by 2030.
- Video-on-Demand Statistics further reported that in India, users spend an average of 180 minutes per day on streaming platforms.
- Netflix is projected to generate USD 18.3 billion in video revenue in 2025, surpassing YouTube’s expected USD 17.2 billion in revenue.
- The global VOD market is projected to reach USD 381.16 billion by 2032, indicating a robust upward trend.
| Company | U.S. Market Share |
| Amazon Prime Video |
22% |
|
Netflix |
21% |
| Max (HBO Max) |
13% |
|
Disney+ |
12% |
|
Hulu |
11% |
| Paramount+ |
9% |
|
Apple TV+ |
7% |
| Peacock |
1% |
|
Others |
4% |
Video-on-Demand Statistics By Region
- In 2025, North America accounted for the largest share of the global VOD market. It earned approximately USD 60.97 billion and held over 40% of the total market share. Experts predict that it will grow at a steady annual rate of 11.7% until 2033.
- Europe followed next, bringing in about USD 45.72 billion and holding just over 30% of the market share.
- The Asia Pacific region captured around 23% of the market in 2025, with total earnings of nearly USD 35.06 billion. It is expected to grow at the fastest rate, with an annual growth of 15.5%, until 2033.
- Latin America had more than 5% of the global market share, with earnings of approximately USD 7.62 billion in 2025. Its yearly growth rate is expected to be around 12.9% from 2025 to 2033.
- The Middle East and Africa held the smallest share, approximately 2%, with a market value of around USD 3.05 billion. Still, it is predicted to grow at a rate of 13.2% annually through 2033.
Top Global SVOD Platforms by Subscribers
| Platform | Estimated Subscribers (2025) |
| Netflix |
300 million |
|
Amazon Prime Video |
175 million |
| Disney+ |
149 million |
|
Paramount+ |
72 million |
| Max (formerly HBO Max) |
70 million |
|
Apple TV+ |
40 to 50 million |
| Hulu |
48 million |
|
Peacock |
30 million |
VOD Services Monthly Subscription Price in the U.S.
 (Reference: statista.com)
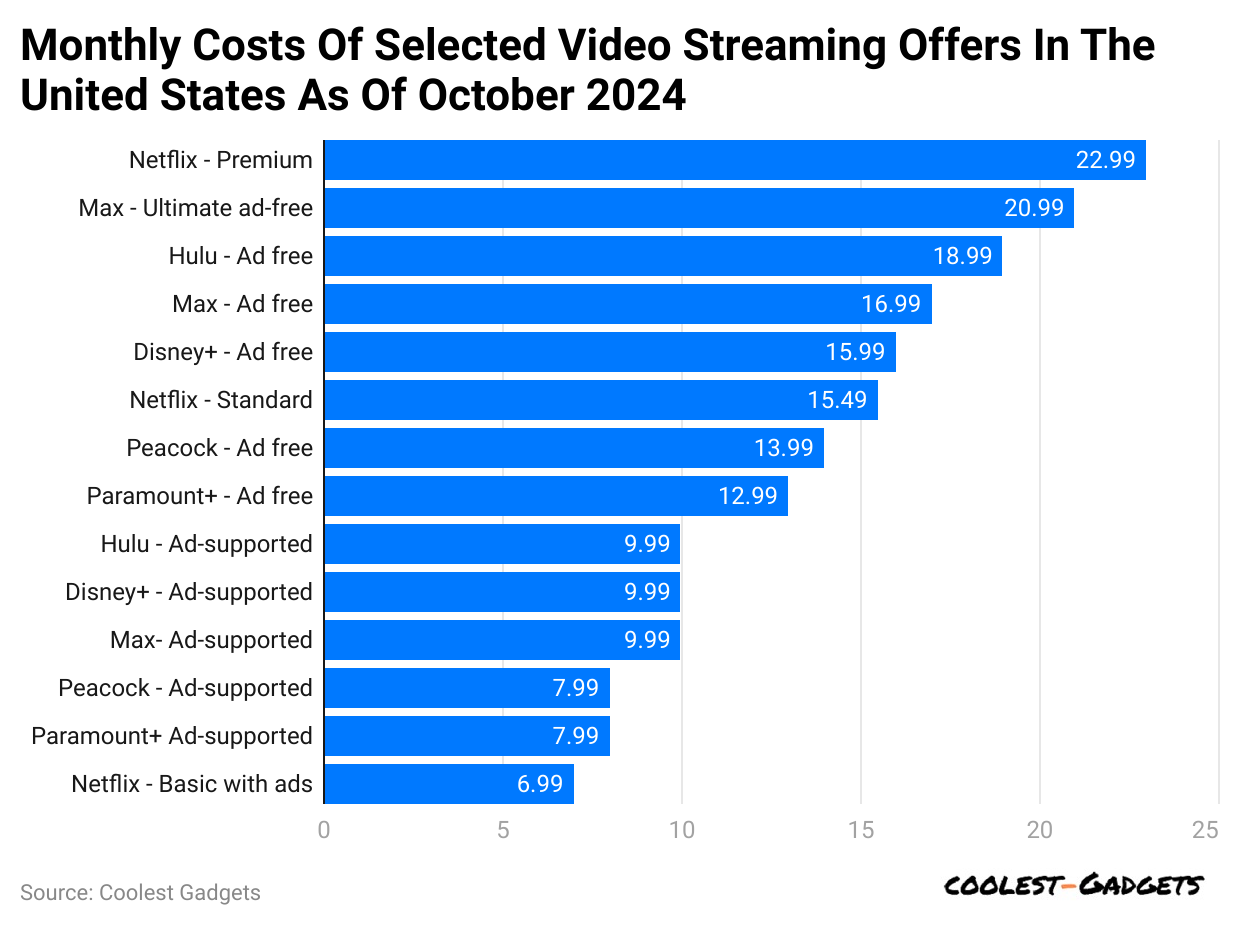
- Video-on-Demand Statistics: As of October 2024, Netflix’s ad-free premium plan was the priciest among U.S. streaming services, costing USD 22.99 each month.
- In the same period, other monthly costs of selected video streaming services offered in America are followed by Max: Ultimate ad-free (USD 20.99), Hulu: Ad free (USD 18.99), Max: Ad free (USD 16.99), Disney+: Ad free (USD 15.99), Netflix: Standard (USD 15.49), Peacock: Ad free (13.99), Paramount+: Ad free (12.99), Hulu: Ad supported (USD 9.99), Disney+: Ad supported (USD 9.99), Max: Ad supported (USD 9.99), Peacock: Ad supported (USD 7.99), Paramount+: Ad supported (USD 7.99) and Netflix: basic with ads (USD 6.99).
Number of Titles on SVOD Services Statistics by Content Type
- By early 2025, Prime Video, Apple TV+, Disney+, Netflix, and Paramount+ collectively had approximately 511,000 TV series titles, while the number of movies and sports shows was significantly lower.
The number of titles on five leading subscription video-on-demand (SVOD) services worldwide from October 2024 to January 2025, categorized by content type:
| SVOD Service | TV Shows | Movies | Sports | Total Titles |
| Amazon Prime Video | 2,000 | 3,000 | 500 |
5,500 |
|
Netflix |
1,800 | 3,600 | 500 | 5,900 |
| Disney+ | 500 | 1,300 | 500 |
2,300 |
|
Apple TV+ |
1,300 | 2,000 | 0 | 3,300 |
|
Paramount+ |
1,300 | 2,000 | 500 |
3,800 |
Video Streaming Subscriptions Used in the U.S. 2024, by Demographics
- Gen Z (ages 18 to 27): Approximately 20% had five or more subscriptions, while 16% subscribed to only one service.
- Millennials (ages 28 to 43): Around 20% had five or more subscriptions.
- Gen X (ages 44 to 59): About 20% had five or more subscriptions.
- Baby Boomers (ages 60 to 78): Only 10% had five or more subscriptions, and over one-third subscribed to just one service.
- A survey done in March 2024 showed that people aged 35 to 54 in the U.S. were the most likely to add more video streaming services.
- Video-on-Demand Statistics show that about 30% of them said they plan to subscribe to 2 to 5 new services in the next year.
- On the other hand, 41% of people in this same age group said they won’t add any more services.
- For those 55 and older, more than two-thirds said they don’t plan to sign up for any new streaming services this year.
- Video-on-Demand Statistics: In early 2024, about 1 in 4 adults in the U.S. said they used someone else’s streaming account.
- Young adults (ages 16 to 34) were most likely to engage in this behavior, with 56% admitting to it.
- In comparison, only 44% of adults aged 35 to 74 said the same.
- Also, fewer Hispanic and Black viewers reported sharing subscription logins than white viewers.
Revenue of Subscription Video-on-Demand (SVOD) in the United States (From 2017 to 2029)
| Year | Revenue (USD billion) |
| 2017 | 11.34 |
| 2018 | 13.89 |
| 2019 | 17.15 |
| 2020 | 22.23 |
| 2021 | 28.72 |
| 2022 | 34.31 |
| 2023 | 37.10 |
| 2024 | 40.50 |
| 2025 | 44.20 |
| 2026 | 48.10 |
| 2027 | 52.30 |
| 2028 | 56.60 |
| 2029 | 61.12 |
Number of Subscription Video-on-Demand (SVOD) Users in the U.S.
| Year | SVOD Users (in millions) |
| 2017 | 125 |
| 2018 | 133 |
| 2019 | 140 |
| 2020 | 150 |
| 2021 | 160 |
| 2022 | 168 |
| 2023 | 174 |
| 2024 | 178 |
| 2025 | 180 |
| 2026 | 181 |
| 2027 | 182 |
| 2028 | 183 |
| 2029 | 184 |
Cost of SVOD and Traditional Pay TV Services Statistics
- As mentioned in Video-on-Demand Statistics in August 2022, the total monthly cost for the top 7 subscription video streaming services was USD 74.99, while traditional pay TV averaged around USD 83.00 per month.
- January 2025: The combined monthly cost for the same streaming services increased to approximately USD 87.00, while traditional pay TV rose to around USD 98.00 per month.
- Video-on-Demand Statistics: As of the third quarter of 2024, Amazon Prime Video and Netflix led the U.S. subscription video-on-demand (SVOD) market, holding market shares of 22% and 21%, respectively.
The market shares for major SVOD platforms in the U.S. during this period are stated in the table below:
| SVOD Service | Market Share |
| Hulu | 13% |
| Disney+ | 11% |
| Max (formerly HBO Max) | 8% |
| Apple TV+ | 6% |
| Paramount+ | 5% |
| Peacock | 4% |
Leading Original TV Series on SVOD Services Statistics by Minutes Streamed in 2024
| TV Series Name | Streaming Platforms | Minutes Watched (Billions) |
| Bridgerton | Netflix | 6.8 |
| The Night Agent | Netflix | 6.7 |
| Ginny & Georgia | Netflix | 6.6 |
| Virgin River | Netflix | 6.5 |
| The Mandalorian | Disney+ | 6.4 |
| The Crown | Netflix | 6.3 |
| Stranger Things | Netflix | 6.2 |
| The Boys | Amazon Prime Video | 6.1 |
| Loki | Disney+ | 6.0 |
| The Witcher | Netflix | 5.9 |
The Most-Watched Acquired TV Series on U.S. Streaming Platforms in 2024
| Series | Streaming Platforms | Minutes Watched (Billions) |
| Bluey | Disney+ | 55.62 |
| Grey’s Anatomy | Netflix, Hulu | 47.85 |
| Family Guy | Hulu | 42.44 |
| Bob’s Burgers | Hulu | 36.80 |
| NCIS | Netflix, Hulu, Paramount+ | 35.91 |
| Young Sheldon | Netflix, Max, Paramount+ | 32.08 |
| The Big Bang Theory | Max | 29.72 |
| Law & Order: SVU | Hulu, Peacock | 28.72 |
| Criminal Minds | Hulu, Paramount+ | 28.40 |
| SpongeBob SquarePants | Paramount+ | 27.87 |
Video-on-Demand Statistics by Major Sporting Events
- Between December 2023 and November 2024, approximately 3.2 million people signed up for Paramount+ due to the 58th Super Bowl.
Here’s a simple table showing how many people (in millions) signed up for other SVOD services in the U.S. during big live sports events:
| Event | Date | Platform | Sign-ups (Millions) |
| NFL AFC Wild Card Game | Jan 2024 | Peacock | Over 1.0 |
| Paris Summer Olympics Opening Weekend | Jul 26 to 28, 2024 | 1.8 | |
| NFL Brazil Game | Sep 2024 | Over 1.0 | |
| Jake Paul vs. Mike Tyson Boxing Match | Nov 14 to 16, 2024 | Netflix | 1.43 |
SVOD Viewers Statistics by Number of Services Used
- More People Use Three or More Services: In 2020, only 26% of people had three or more streaming subscriptions. By 2024, this number grew to 47%.
- Fewer People Stick to One Service: In 2020, 44% of viewers used only one streaming platform. By 2024, this dropped to 25%, indicating that more people now prefer variety.
- Two Services Still Common: The number of people using two streaming services remained relatively steady, fluctuating between 28% and 32% from 2020 to 2024.
SVOD Subscription Additions and Cancellations in the U.S.
- As mentioned in Video-on-Demand Statistics, cancellations peaked at 48.9 million in the first quarter of 2024, the highest recorded during this period.
- However, in the second quarter of 2024, cancellations decreased to 46.2 million, indicating a slight improvement.
Quarterly analyses of 2023 are stated in the table below:
| Quarter | Additions (millions) | Cancellations (millions) |
| Q1 | 39.2 | 38.5 |
| Q2 | 38.7 | 39 |
| Q3 | 40.1 | 38.9 |
| Q4 | 41 | 39.5 |
Monthly SVOD Churn Rate Statistics
- By the end of 2024, around 5 out of every 100 people in the U.S. will be cancelling their paid video streaming subscriptions each month.
- This indicates that the monthly churn rate for premium SVOD services was approximately 5%. It’s better than earlier in the year.
- For example, in November 2023, the rate was 6.3%, which was higher than 5.1% in November 2022.
- Video-on-demand statistics further indicate that Netflix maintained a lower churn rate of approximately 2%, which is significantly below the industry average.
- Additionally, a significant portion of subscribers who cancelled their SVOD services returned within a short period.
- Data indicates that 50% of Netflix subscribers who cancelled in 2023 rejoined within six months, and 61% did so within a year.
- For other streaming services, 34% of cancelled subscribers returned within six months, and 45% within a year.
Top Reasons Americans Subscribe to Video Streaming Services
- 60% of people like streaming platforms that offer low-cost or affordable plans.
48% of viewers want a big collection of movies and shows to choose from. - 42% say they enjoy watching more when there are no ads in between.
- 36% like it when the app or website is simple and easy to use.
- 21% of people love having the option to download videos and watch them offline.
- 22% enjoy receiving personalised suggestions based on their typical viewing habits.
- 22% choose a platform mainly because it shows live sports matches.
- Among young viewers aged 18 to 34, 66% prefer using free streaming apps with ads over paying for ones with no ads.
Conclusion
Video-on-Demand (VOD) has revolutionised the way we watch movies and TV shows. Now, people can watch what they want, when they want, without having to wait. It’s easy to use, saves time, and works on many devices like phones, TVS, and laptops. As internet speeds improve, VOD will continue to grow and become even more popular. With more choices and better features, VOD is now the favourite way to enjoy entertainment.
Sources
FAQ.
VOD (Video on Demand) allows you to watch videos at any time by streaming or downloading them from the internet, rather than watching live TV.
VOD can be free or paid. Some platforms offer free shows, while others require a subscription or payment.
VOD is better than cable TV because you can watch what you want, anytime, without waiting for fixed schedules.
Yes, you can watch in different languages. Please select your language in the settings before you begin watching.
You need at least 5 Mbps internet speed to watch Video on Demand (VOD) smoothly without buffering.
Yes, VOD is safe for kids if parents check the content and use child-friendly settings or parental controls.
Joseph D'Souza started Coolest Gadgets in 2005 to share his love for tech gadgets. It has since become a popular tech blog, famous for detailed gadget's reviews and companies statistics. Joseph is committed to providing clear, well-researched content, making tech easy to understand for everyone. Coolest Gadgets is a trusted source for tech news, loved by both tech fans and beginners.