U.S. Tariff Statistics By Country, Imports, Trading Partners, Revenue and Facts

Updated · Apr 17, 2025


TABLE OF CONTENTS
- Introduction
- Editor’s Choice
- General U.S. Tariff Statistics
- Impact of Trump’s Proposed U.S. Tariffs 2025
- U.S. Tariff Rate on All Imports
- U.S. Tariff Statistics by Rate on Imports and Dutiable Imports
- By Share of Total State Imports
- Top Trading Partners of U.S. Imports
- U.S. Tariff Statistics by Revenue Projections of Trump’s Tariffs on Imported Goods
- U.S. Tariff Rate Statistics By Country
- Reciprocal U.S Tariffs on Production by Country
- Americans Plan to Purchase U.S. Items Ahead of Trump’s Tariffs by Age
- U.S. Confidence About Tariffs
- Unequal Import Tariffs between the United States and Leading Export Countries
- Ad Spend Cuts Due to Tariffs in the U.S. by Affected Industries
- By Leading Media
- Several Factors Influenced U.S. Tariff Statistics
- Conclusion
Introduction
U.S. Tariff Statistics: Tariffs are taxes the U.S. government charges on goods from other countries. These taxes can lead to higher prices, alter trade relationships, and impact the overall economy. Recently, the U.S. has made several changes to its tariff rules, especially with countries like China and the European Union. These changes have affected businesses, importers, and shoppers alike.
Looking at U.S. Tariff Statistics, we can understand how much money the country earns from tariffs, which products are taxed the most, and how trade flows are affected. This U.S. Tariff Statistics shares key data and trends from the latest reports to help explain how tariffs shape America’s trade and economy. It also looks at the long-term impact of these trade policies.
Editor’s Choice
- U.S. Tariff Statistics show that as of April 10, 2025, the Trump administration put a 10% basic tariff on almost everything the U.S. imports.
- A Statista estimate said that Trump’s new tariff plans on goods from China, Canada, and Mexico could increase the average U.S. tariff by 7.1% in 2025.
- The average U.S. tariff has climbed to 22.5%, the highest level in over 100 years, going back to 1909.
- Once all added fees are counted, goods from China now face a total tariff of 145%.
- The U.S. has also added a 25% tariff on steel and aluminum from any country.
- Items like cheap fashion clothing from China and Hong Kong will soon have up to 90% tariffs starting June 1.
- Electronics made in China, including iPhones, now face a 20% tariff, which could go higher with new semiconductor rules.
- U.S. Tariff Statistics further stated that most Canadian imports are under a 25% tariff, and goods like oil, gas, and potash from Canada are taxed at 10%. Because of these tariffs, U.S. prices have quickly increased by about 2.3%.
- Experts from Yale University’s Budget Lab believe these 2025 tariffs could lower real GDP growth by 1.1 percentage points for the year (measured from Q4 2024 to Q4 2025).
- From 2026 to 2035, the government could earn around USD 2.4 trillion in revenue from these tariffs.
General U.S. Tariff Statistics
 (Source: visualcapitalist.com)
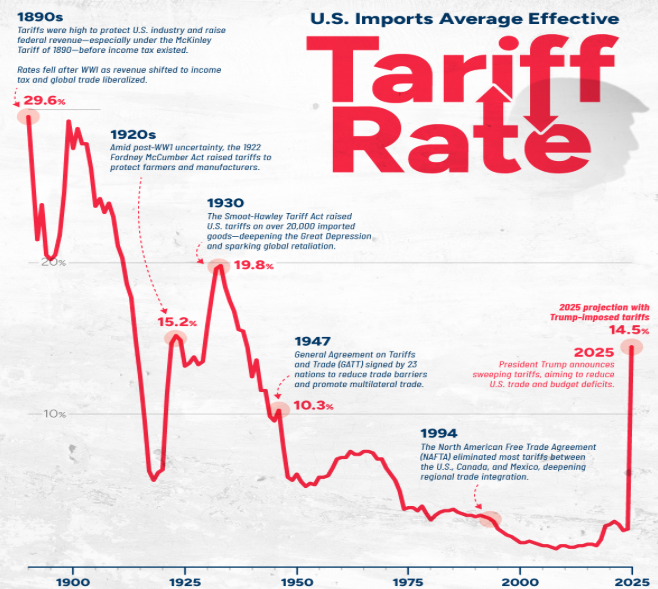
- The U.S. average tariff rate is 27%, the highest since 1903.
- In 2025, the U.S. raised its average import tax to 14.5%, which is the highest it has been since 1938.
- Just last year, in 2024, the average tariff was much lower, only about 2.5%.
- As of April 9, new tariffs were expected to bring in USD 206.6 billion for the government and cut imports by 30% this year.
- Between 2026 and 2035, tariffs are expected to bring in around USD 2.4 trillion for the U.S. government.
- On April 5, 2025, the U.S. started charging over 10% tariffs on goods from 57 countries.
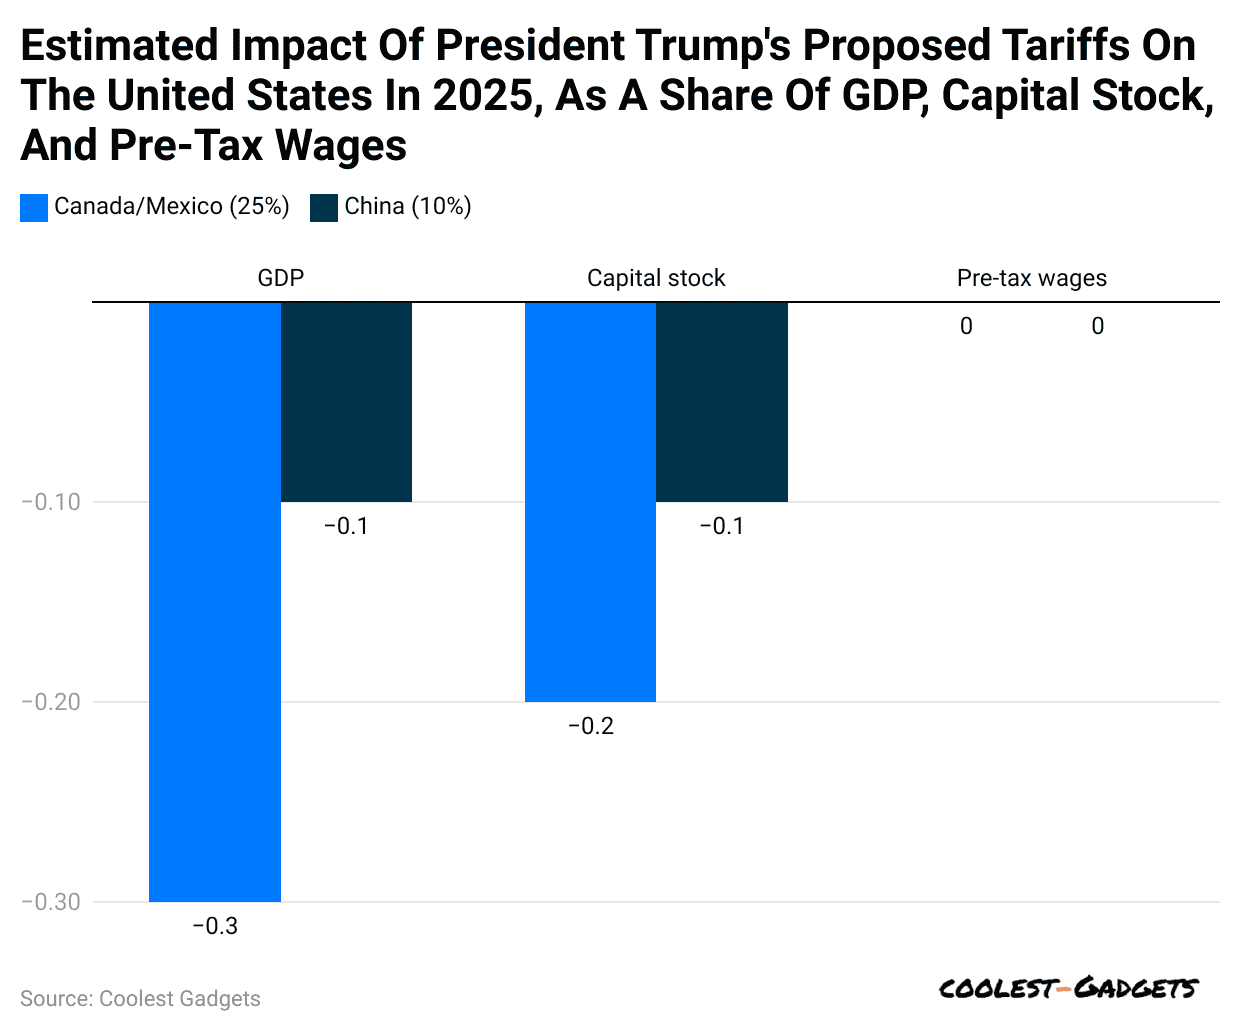
Impact of Trump’s Proposed U.S. Tariffs 2025
 (Reference: statista.com)
- U.S. Tariff Statistics estimated that if President Trump’s new tariffs become permanent, America’s economy could shrink by 0.4%.
- Meanwhile, around a 25% tariff on everything from Canada and Mexico might lower the U.S. GDP by 0.3%.
- A 10% tariff on all products from China could reduce the GDP by another 0.1%.
- On February 10, China responded with its tariffs on U.S. goods.
- China placed a 15% tariff on coal and liquid natural gas from the U.S.
- A 10% tariff was also added on U.S. oil, machines, and big vehicles.
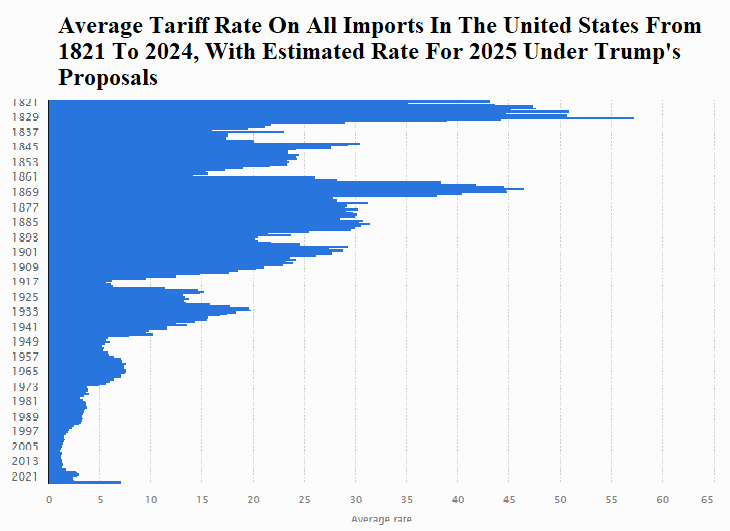
U.S. Tariff Rate on All Imports
 (Source: statista.com)
- Trump’s new tariff plans on goods from China, Canada, and Mexico could increase the average U.S. tariff by 7.1% in 2025.
- Besides, the U.S. average tariff rate on all imports in previous years was 2020 (2.8%), 2021 (3%), 2022 (2.8%), 2023 (2.4%), and 2024 (2.5%).
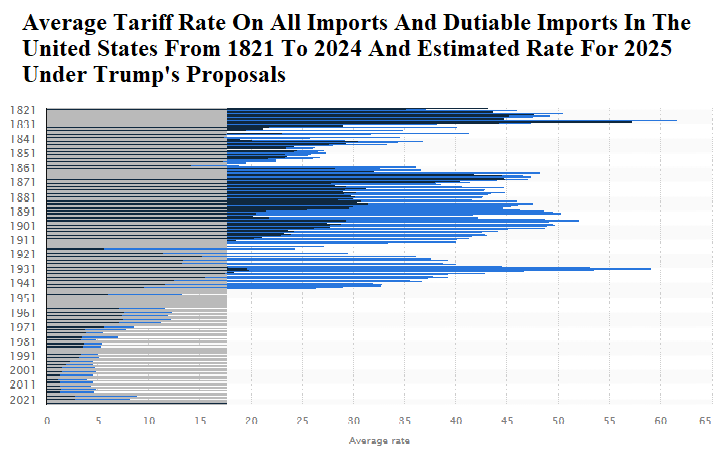
U.S. Tariff Statistics by Rate on Imports and Dutiable Imports
 (Source: statista.com)
| Year | Average rate on all imports | Average rate on all imports under Trump’s proposals |
|
2024 |
2.4% | 17.7% |
| 2025 | 17.7% |
17.7% |
| Main import partner | States | Share of total state imports |
| Canada | Montana |
86% |
|
North Dakota |
75% | |
| Maine |
67% |
|
|
Vermont |
67% | |
| Wyoming |
66% |
|
|
Malaysia |
Idaho | 50% |
| Canada | Oklahoma |
50% |
|
Mexico |
Michigan | 44% |
| Texas |
40% |
|
|
Canada |
West Virginia | 40% |
| Minnesota |
35% |
|
|
South Korea |
Alaska | 33% |
| Canada | Colorado |
33% |
|
Ireland |
Indiana | 31% |
| Canada | South Dakota |
30% |
|
Illinois |
29% | |
| Mexico | Arizona |
28% |
|
South Korea |
Hawaii | 28% |
| Canada | Washington |
28% |
|
China |
California | 25% |
| Canada | Connecticut |
25% |
|
Iowa |
25% | |
| Massachusetts |
25% |
|
|
Mexico |
New Mexico | 25% |
| Australia | District of Columbia |
24% |
|
Mexico |
Missouri | 23% |
| China | Nevada |
23% |
|
Canada |
New Hampshire | 22% |
| Ohio |
22% |
|
|
Germany |
Rhode Island | 20% |
| Mexico | Utah |
20% |
|
Germany |
Maryland | 18% |
| Mexico | Alabama |
17% |
|
Canada |
Nebraska | 17% |
| China | Tennessee |
17% |
|
Canada |
Wisconsin | 17% |
| Kansas |
15% |
|
|
Mexico |
Mississippi | 15% |
| China | South Carolina |
15% |
|
Canada |
Arkansas | 14% |
| Mexico | Louisiana |
14% |
|
Ireland |
North Carolina | 14% |
| China | Pennsylvania |
13% |
|
Virginia |
13% | |
| Georgia |
12% |
|
|
China |
Florida | 11% |
| Canada | Delaware |
10% |
|
Mexico |
Kentucky | 10% |
| China | New Jersey |
9% |
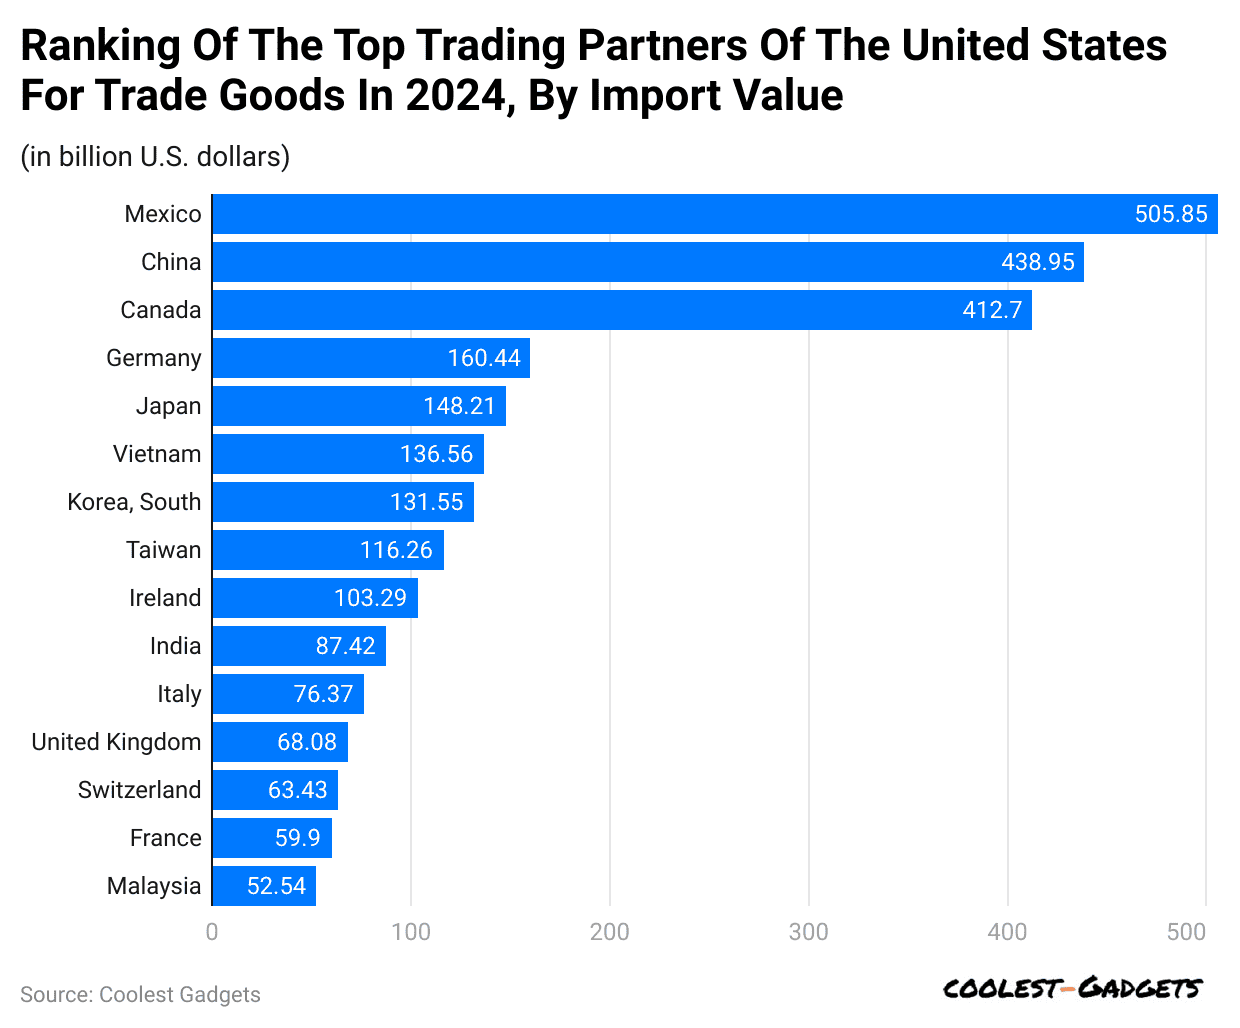
Top Trading Partners of U.S. Imports
 (Reference: statista.com)
- In 2024, the U.S. bought goods worth USD 505.85 billion from Mexico, making it America’s biggest trading partner that year.
- Furthermore, the top trading partners of the United States for trade goods by import value are followed by China (USD 438.95 billion), Canada (USD 412.7 billion), Germany (USD 160.44 billion), Japan (USD 148.21 billion), Vietnam (USD 136.56 billion), South Korea (USD 131.55 billion), Taiwan (USD 116.26 billion), Ireland (USD 103.29 billion), India (USD 87.42 billion), Italy (USD 76.37 billion), United Kingdom (USD 68.08 billion), Switzerland (USD 63.43 billion), France (USD 59.9 billion) and Malaysia (USD 52.54 billion).
Average Annual Revenue Change as a Share of GDP Across Major Tax Laws and Trump’s Proposed Tariffs in the United States in 2025
| Major tax laws and Trump’s proposed tariffs | Share of GDP |
| Revenue Act of 1942*^ |
5.04% |
|
Revenue Act of 1941*^ |
2.2% |
| Revenue Act of 1951*^ |
1.33% |
|
Current Tax Payment Act of 1943*^ |
1.16% |
| Revenue and Expenditure Control Act of 1968* |
1.1% |
|
Tax Equity and Fiscal Responsibility Act of 1982 |
0.98% |
| Excess Profits Tax of 1950*^ |
0.97% |
|
Revenue Act of 1940*^ |
0.71% |
| Omnibus Budget Reconciliation Act of 1993 |
0.63% |
|
Tax Adjustment Act of 1966 |
0.6% |
| Crude Oil Windfall Profit Tax Act of 1980 |
0.51% |
|
Omnibus Budget Reconciliation Act of 1990 |
0.5% |
| Revenue Act of 1943*^ |
0.46% |
|
Affordable Health Care Act of 2010 |
0.4% |
| Deficit Reduction Act of 1984 |
0.39% |
|
Trump’s 2025 Tariffs (Canada, Mexico, China ) |
0.35% |
U.S. Tariff Statistics by Revenue Projections of Trump’s Tariffs on Imported Goods
- In 2025, President Trump shared his plan to add a 10% base tariff on all imported goods.
- This 10% tariff could bring about USD 2.95 trillion to the U.S. government.
- Raising the tariff to 20% is expected to generate USD 2.62 trillion in revenue.
- Earlier import levels were expected to bring around USD 3.28 trillion without these new taxes.
U.S. Tariff Rate Statistics By Country
- As of April 10, 2025, the Trump administration put a 10% basic tariff on almost everything the U.S. imports.
Furthermore, other reciprocal tariffs of other countries are stated below:
| Country | Tariff Rate |
| China |
145% |
|
Cambodia |
49% |
| Vietnam |
46% |
|
Bangladesh |
37% |
| Thailand |
36% |
|
Taiwan |
32% |
| Switzerland |
31% |
|
India |
26% |
| Canada |
25% |
|
Mexico |
25% |
| South Korea |
25% |
|
Japan |
24% |
| Malaysia |
24% |
|
European Union |
20% |
| Israel |
17% |
|
Norway |
15% |
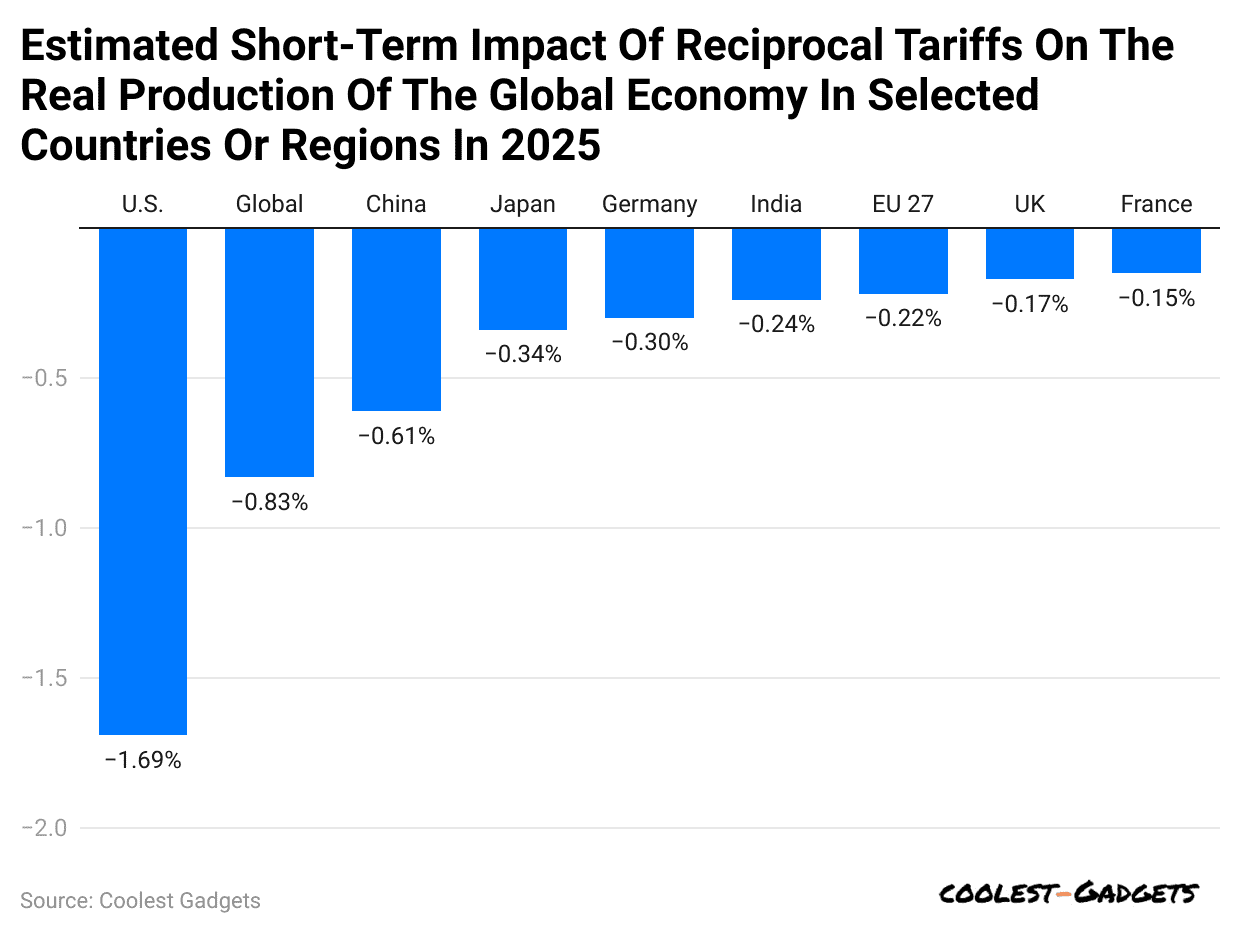
Reciprocal U.S Tariffs on Production by Country
 (Reference: statista.com)
- S. Tariff Statistics for 2025 show that reciprocal tariffs around the world are likely to temporarily cause real production to drop by 0.83%.
- Among all the regions, the U.S. is expected to see the biggest fall, with a production decrease of about 1.69%.
- Furthermore, other countries’ estimated impacts of reciprocal U.S. tariffs are followed by China (-0.61%), Japan (-0.34%), Germany (-0.3%), India (-0.24%), EU 27 (-0.22%), UK (-0.17%), and France (-0.15%).
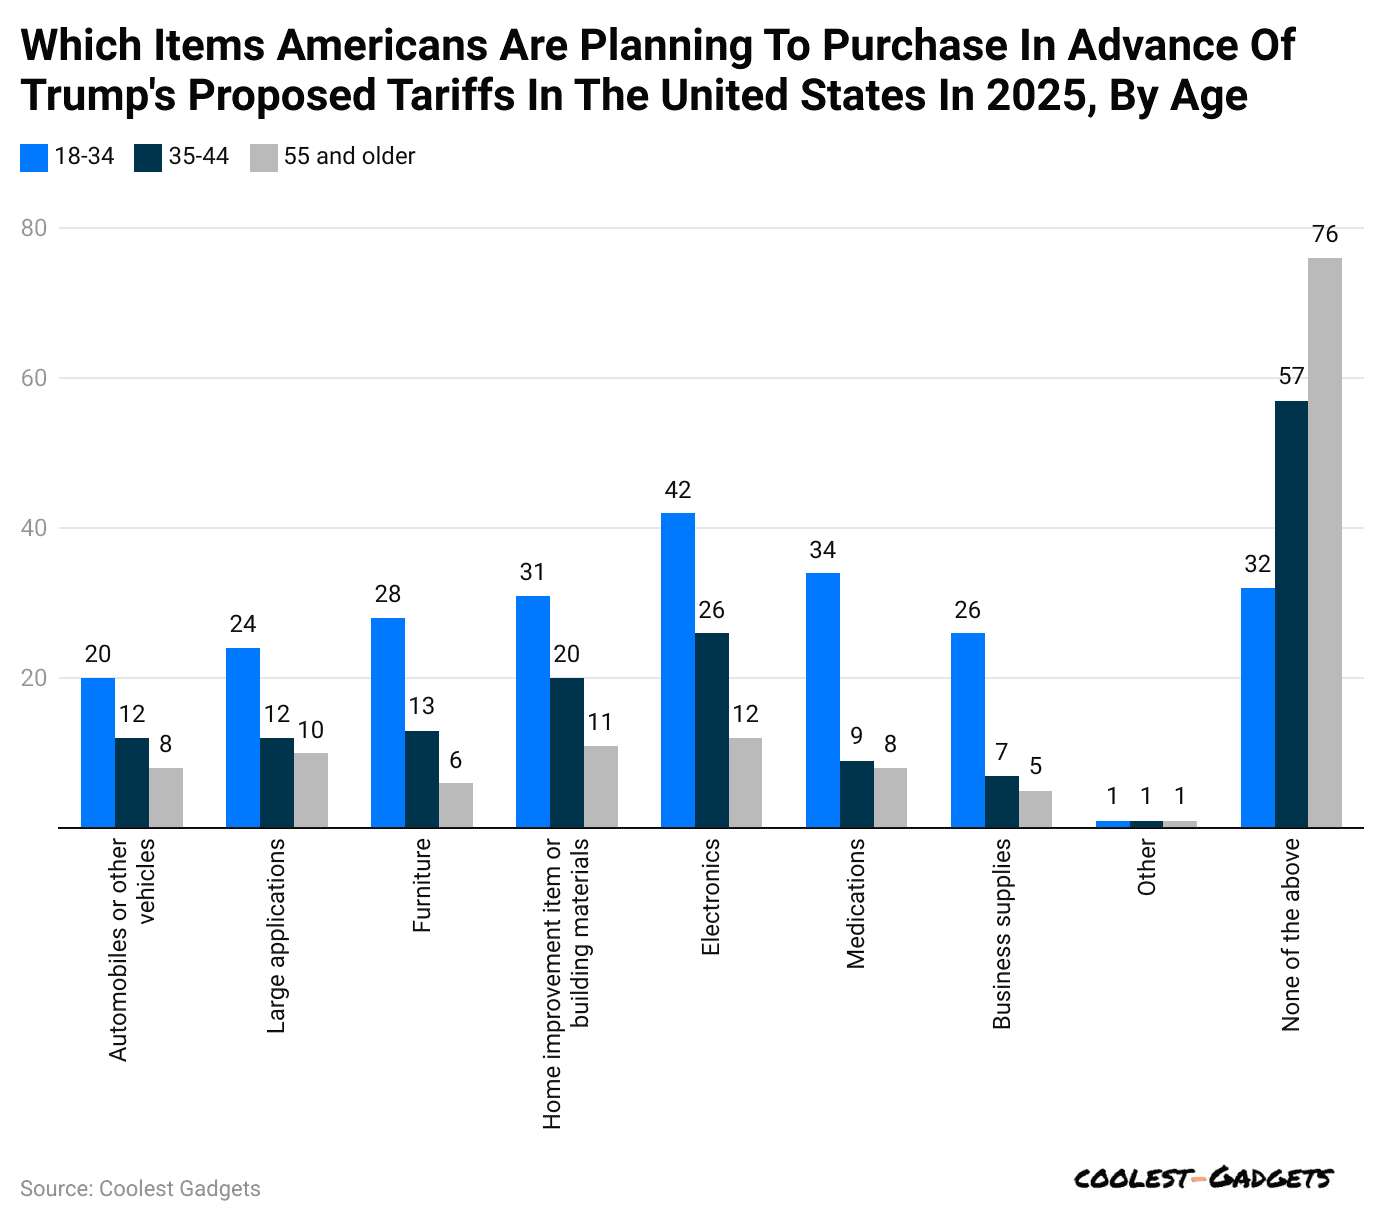
Americans Plan to Purchase U.S. Items Ahead of Trump’s Tariffs by Age
 (Reference: statista.com)
- Based on a 2025 survey, U.S. Tariff Statistics found that more than 25% of Americans planned to buy electronics early, thinking prices would soon rise due to Trump’s proposed tariffs on all imported goods.
- Among them, 42% were aged 18 to 34, another 26% were aged 35 to 54, and only 12% were 55 or older.
Other age groups share those planning to purchase American goods before Trump’s Proposed Tariffs are stated in the table below:
| Items | 18 to 34 years | 35 to 54 years | 55 years |
| Automobiles or other vehicles | 20% | 12% |
8% |
|
Large appliances |
24% | 12% | 10% |
| Furniture | 28% | 13% |
6% |
|
Home improvement items or building materials |
31% | 20% | 11% |
| Medications | 34% | 9% |
8% |
|
Business supplies |
26% | 7% | 5% |
| Rest others | 1% | 1% |
1% |
|
None of the Above |
32% | 57% |
76% |
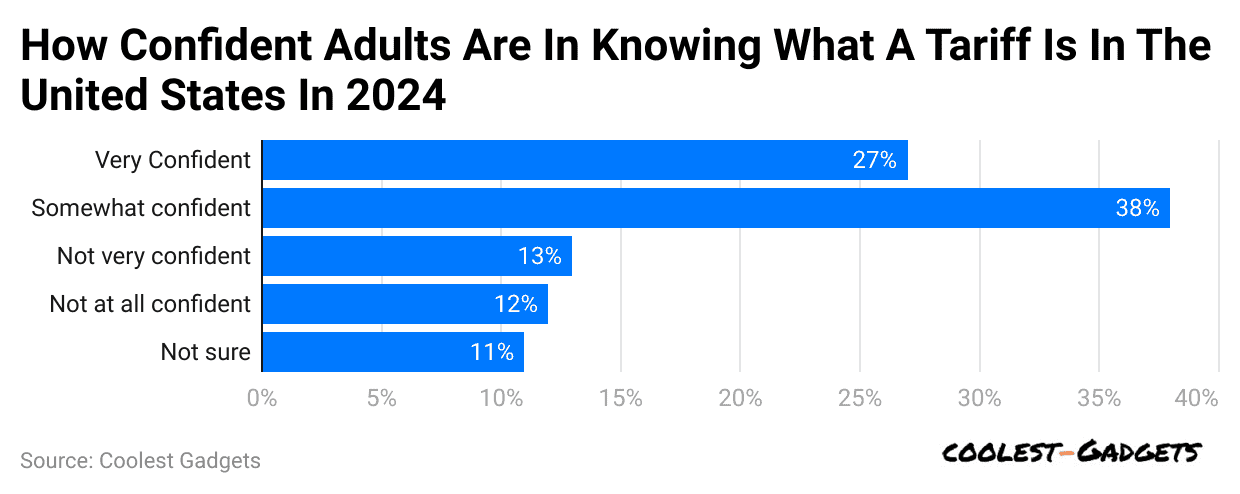
U.S. Confidence About Tariffs
 (Reference: statista.com)
- U.S. Tariff Statistics stated that in 2024, only 27% of Americans felt confident they understood tariffs, while 38% were somewhat confident.
- Moreover, other adults ‘ shares about U.S. tariffs were 13% (not at all confident), 12% (not at all confident), and 11% (not sure).
Unequal Import Tariffs between the United States and Leading Export Countries
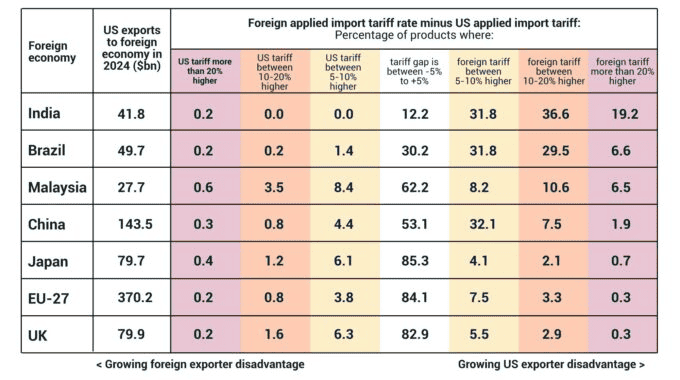 (Source: imd.org)
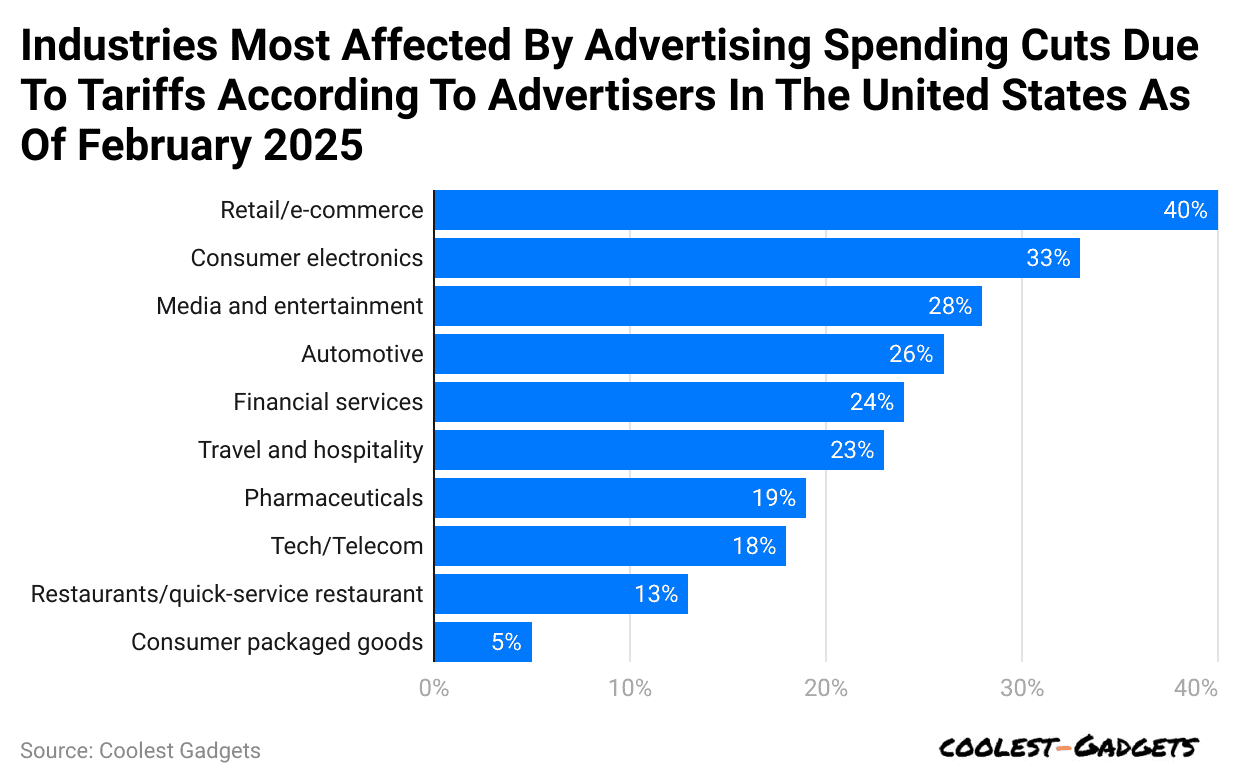
Ad Spend Cuts Due to Tariffs in the U.S. by Affected Industries
 (Reference: statista.com)
- In February 2025, the U.S. ad buyers managing yearly budgets of USD 250,000 or more shared their thoughts on tariffs.
- According to U.S. Tariff Statistics, about 40% believed retail and e-commerce companies would spend less on ads because of tariffs.
- Around 33% said the same about the consumer electronics industry, and 28% felt media and entertainment would also cut back.
- Meanwhile, other industries affected by ad spending cuts due to tariffs in the U.S. are Atomotive (26%), Financial services (24%), Travel & Hospitality (23%), Pharmaceuticals (19%), Tech/Telecommunications (18%), Restaurants/quick-service restaurants (13%), and Consumer package goods (5%).
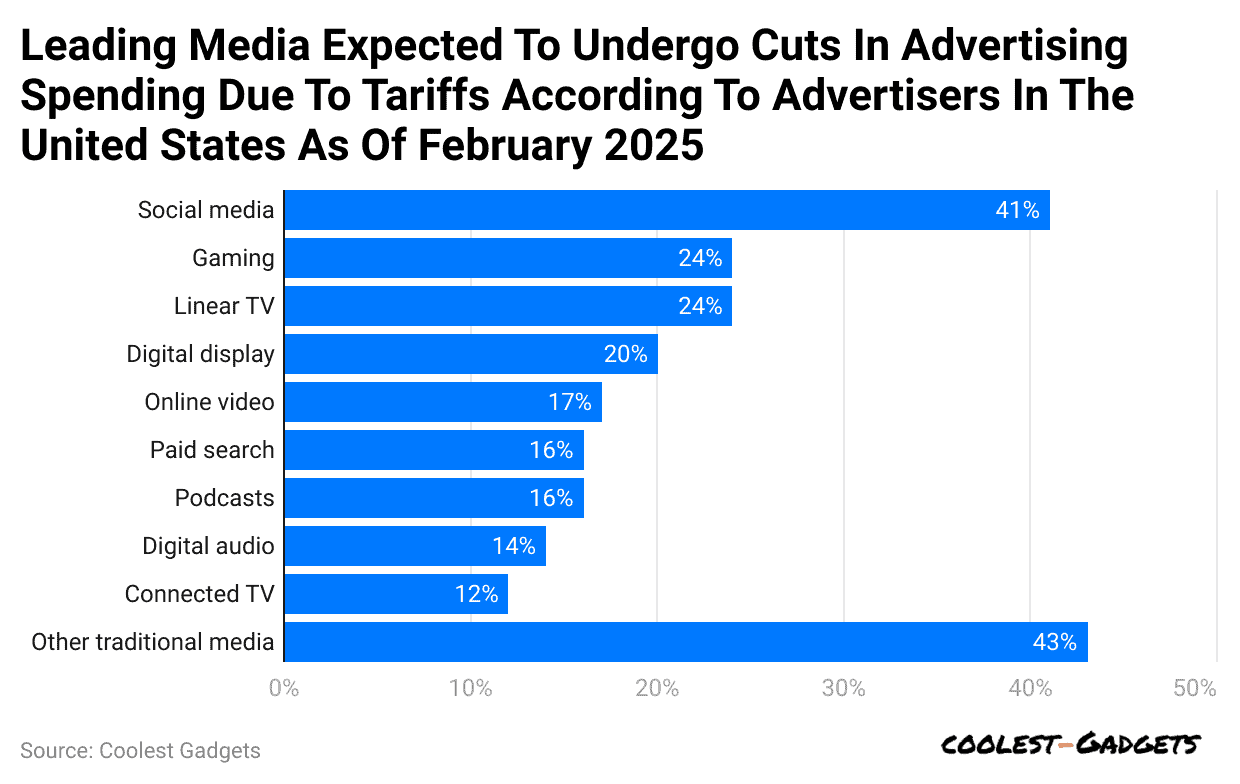
By Leading Media
 (Reference: statista.com)
- In the same duration, 41% of advertising decision-makers with annual budgets over USD 250,000 in the U.S. expected to reduce their social media ad spending because of tariffs.
- Gaming and linear TV were next, with 24% of participants mentioning each.
- U.S. Tariff Statistics show that leading media, including digital display (20%), online video (17%), paid search (16%), podcasts (16%), digital audio (14%), and connected TV (12%), are expected to undergo cuts in advertising spending due to tariffs.
- About 43% of those surveyed also mentioned other traditional media.
Several Factors Influenced U.S. Tariff Statistics
- In April 2025, the U.S. implemented comprehensive tariffs affecting around 90 countries, including a 104% levy on Chinese imports.
- In the same period, the U.S. implemented comprehensive tariffs affecting around 90 countries, including a 104% levy on Chinese imports.
- These tariffs led to a 2.3% rise in the overall price level in the short term, equating to an average per-household consumer loss of USD 3,800 in 2024.
- The U.S. trade deficit with China reached USD 295.4 billion in 2024, contributing to a total trade deficit of USD 918.4 billion for the year.
- Sector-Specific Impacts: Automobiles (New tariffs on components from Canada and Mexico increased vehicle prices, with potential hikes of up to USD 8,700 per new car) and Electronics (Chinese-made electronics, including iPhones, remained subject to a 20% tariff).
- China retaliated with tariffs on U.S. goods, including a 125% tariff on U.S.-origin goods.
Conclusion
In simple terms, U.S. Tariffs are extra taxes on goods from other countries. They are meant to protect local businesses, but can also raise prices for American buyers. While some industries benefit, others may suffer, especially those that rely on imported parts or materials.
In the long run, tariffs can lead to trade tensions and impact the global economy. So, the government must balance protecting local jobs and keeping trade fair and affordable for everyone.
Sources
FAQ.
A tax is money that people or businesses must pay to the government. A tariff is a special tax only on goods coming into a country from another country.
The U.S. uses tariffs to protect local businesses, reduce imports, and encourage people to buy American-made products.
The buyer usually pays the tariff when importing goods from another country. It makes the product more expensive.
Tariffs can help local businesses by increasing the cost of imported goods but may also increase prices for everyone.
In the U.S., Congress sets tariff laws, but the President can adjust them for trade or national security reasons.
Tariffs make imported goods cost more, so American consumers often pay higher prices for things they buy.
Joseph D'Souza started Coolest Gadgets in 2005 to share his love for tech gadgets. It has since become a popular tech blog, famous for detailed gadget's reviews and companies statistics. Joseph is committed to providing clear, well-researched content, making tech easy to understand for everyone. Coolest Gadgets is a trusted source for tech news, loved by both tech fans and beginners.