Apple Statistics By Revenue, Demographics and Country

Updated · Mar 07, 2025


TABLE OF CONTENTS
- Introduction
- Editor’s Choice
- What is Apple?
- General Apple Statistics
- By Revenue
- By Region
- Apple’s Product Sales Statistics
- iPhone Statistics
- By App Revenue, 2024
- iPhone Price Statistics
- iPad statistics
- Apple Mac Statistics
- Apple Pay Statistics
- Apple Watches Statistics
- Apple T.V. Statistics
- By Device Traffic
- By Web Traffic
- By Demographics
- By Traffic Sources
- By Social Media Traffic
- Apple Stores Statistics
- Popular Apple App Store Categories
- Conclusion
Introduction
Apple Statistics: Apple is one of the biggest technology companies in the world, known for its iPhones, MacBooks, iPads, and other innovative products. With millions of customers globally, Apple continues to grow every year. Its sales, market value, and customer loyalty make it a leader in the tech industry.
The company earns billions of dollars annually, with iPhones being its best-selling product. Apple’s App Store also generates huge revenue, as millions of people download apps daily. Understanding Apple’s numbers helps us see how successful the company is and what trends will shape its future.
This article explores key Apple statistics, including sales, market trends, and user data, to give a clear picture of its impact worldwide.
Editor’s Choice
- In the first quarter of fiscal year 2025, Apple reported a revenue of USD 124.3 billion, marking a 4% increase from the previous year.
- Apple’s market capitalisation is approaching USD 4 trillion, with projections suggesting it could reach this unprecedented valuation by early 2025.
- There are approximately 2.2 billion active Apple devices worldwide.
- Apple’s services segment, including offerings like Apple Music and iCloud, has grown significantly and contributes substantially to the company’s overall revenue.
- Apple plans to invest over USD 500 billion in the U.S. and create 20,000 jobs over the next four years, focusing on areas like AI and software development.
- Apple’s board announced a USD 0.25 per share cash dividend. Shareholders recorded by February 10, 2025, will receive payment on February 13, 2025.
- Apple Statistics show that Apple made USD 391.04 billion in revenue in 2024.
- There are about 2.2 billion Apple devices actively in use worldwide.
- The iPhone is Apple’s top-selling product, making up 48.69% of the company’s total revenue in the last quarter of 2024.
- In recent years, Apple has had a workforce of 164,000 employees.
- The Apple App Store offers around 3.84 million apps for download.
You May Also Like To Read
- Xiaomi Statistics
- Lenovo Statistics
- Asus Statistics
- Toshiba Statistics
- Intel Statistics
- Dell Statistics
- HP (Hewlett-Packard) Statistics
- Philips Statistics
- Google Statistics
- Sony Statistics
- Microsoft Statistics
- Airbnb Statistics
- Google Revenue Statistics
- Amazon Statistics
- Tencent Statistics
What is Apple?
Apple is a famous technology company from the United States. It makes iPhones, iPads, Mac computers, and other smart devices. Apple is known for its simple and stylish designs, easy-to-use software, and high-quality products. The company was started in 1976 by Steve Jobs, Steve Wozniak, and Ronald Wayne. Its logo is an apple with a bite taken out of it. Apple also created the App Store, where people can download apps for their devices. Many people like Apple products because they are fast, secure, and work well together. The company also sells services like iCloud, Apple Music, and Apple TV+.
General Apple Statistics
- Apple reported a total revenue of USD 391.04 billion in 2024.
- The iPhone remained Apple’s largest revenue contributor, accounting for approximately 51% of total revenue.
- Apple’s services segment, including offerings like the App Store, Apple Music, and iCloud, generated USD 96.1 billion in revenue, or about 24 percent of the company’s revenue.
- There were around 2.2 billion active Apple devices worldwide by the end of 2024.
- The Apple App Store offered about 3.84 million applications as of 2024.
- According to Statista, Apple is the second most valuable brand in the world, with a brand value of about USD 297.5 billion in the third quarter of 2023.
- In the U.S., there were 153 million active iPhone users in 2023. Apple made around USD 41.1 billion from selling wearables and accessories.
- By the end of 2024, the company’s profit is expected to grow by 7.6%.
- In 2024, nearly 35% of people are predicted to use Apple iPhones and watches. By 2027, India is expected to assemble up to 50% of iPhones.
- Apple has over 150,000 employees worldwide, with 61% male and 38% female.
- In 2023, Apple earned about USD 1,820 every second.
By Revenue
- Q1 2024 marked Apple’s highest quarterly revenue,reachingd USD 124.3 billion.
- Q2 2024 saw a significant decline, with revenue dropping to USD 94.9 billion.
- Q3 2024 experienced a further decrease, with revenue at USD 85.8 billion.
- Q4 2024 rebounded to USD 94.9 billion, matching Q2’s revenue.
- The iPhone remained Apple’s top revenue generator, contributing USD 46.2 billion in Q4, a 5.5% increase from the previous year.
- Services revenue reached an all-time high of USD 24.97 billion in Q4, up 11.9% year-over-year.
- iPad sales grew by 7.9% in Q4, totaling USD 6.95 billion.
- Mac revenue saw a modest increase of 1.7% in Q4, amounting to USD 7.74 billion.
- The Wearables, Home, and Accessories segment experienced a 3% decline in Q4, with revenue at USD 9.04 billion.
- Apple’s net income in Q4 was USD 14.7 billion, impacted by a one-time USD 10.2 billion tax charge related to an EU ruling.
You May Also Like To Read
- Apple Smartphone Statistics
- Apple MacBook Statistics
- Apple Watch Statistics
- Apple Customer Loyalty Statistics
By Region
As per Apple Statistics, in 2024, Apple’s revenue varied by region:
- The Americas brought in USD 167 billion, making up 42.7% of the total earnings.
- Europe followed with USD 101.3 billion, contributing 25.9%. Greater China earned USD 66.8 billion, covering 17.1% of the overall income.
- Japan added USD 25 billion (6.4%), while the Rest of Asia Pacific contributed USD 30.6 billion, representing 7.8% of Apple’s revenue.
- In 2023, Apple made the most money in America, earning USD 162.5 billion.
- Europe followed with USD 94.2 billion, while China generated USD 72.5 billion. Japan contributed USD 24.2 billion, and the Rest of Asia Pacific added USD 29.6 billion.
Apple’s Product Sales Statistics
- iPhone: Approximately 231 million units sold, generating USD 200.58 billion in revenue, accounting for 51% of Apple’s total revenue.
- iPad: Sales reached 49 million units, contributing USD 28.3 billion to the company’s earnings.
- Mac and MacBook: 22 million units sold, resulting in USD 29.36 billion in revenue.
- Wearables, Home, and Accessories: This segment, including products like AirPods and Apple Watch, generated USD 39.85 billion in revenue.
- Services: Apple’s services division, which encompasses the App Store, Apple Music, and iCloud, contributed USD 85.2 billion, or 24% of the total revenue.
- Total Revenue: The company’s overall revenue for 2024 was USD 390.8 billion.
iPhone Statistics
- In 2023, around 1.46 billion people worldwide were using iPhones.
- According to a Demand Sage report, this number is expected to exceed 1.56 billion by 2024. The U.S. has about 135.97 million iPhone users.
- By 2024, iPhones will account for 28.8% of the global smartphone market. The market share in different countries is the U.S. (61.3%), China (22.37%), and India (4.02%).
- iPhone sales in 2023 dropped compared to the previous year, reaching 231.3 million units.
- The highest sales were in the Americas, with 98.1 million units sold.
- Other sales figures were Europe (56.8 million), China (43.7 million), Japan (14.6 million), and the Rest of Asia Pacific (17.8 million). Apple sells 849,450 iPhones daily, 35,393 per hour, 590 per minute, and 10 every second.
(Source: demandsage.com)
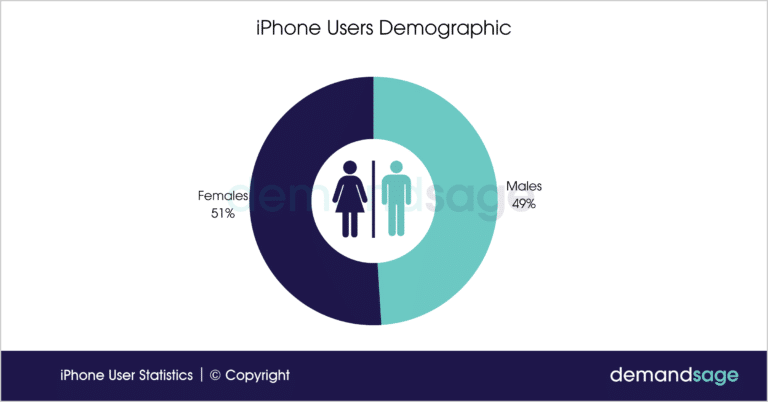
- Male and female users share of iPhones are 51% and 49% respectively.
- The most popular age group users lie between 16 years and 34 years.
(Reference: demandsage.com)
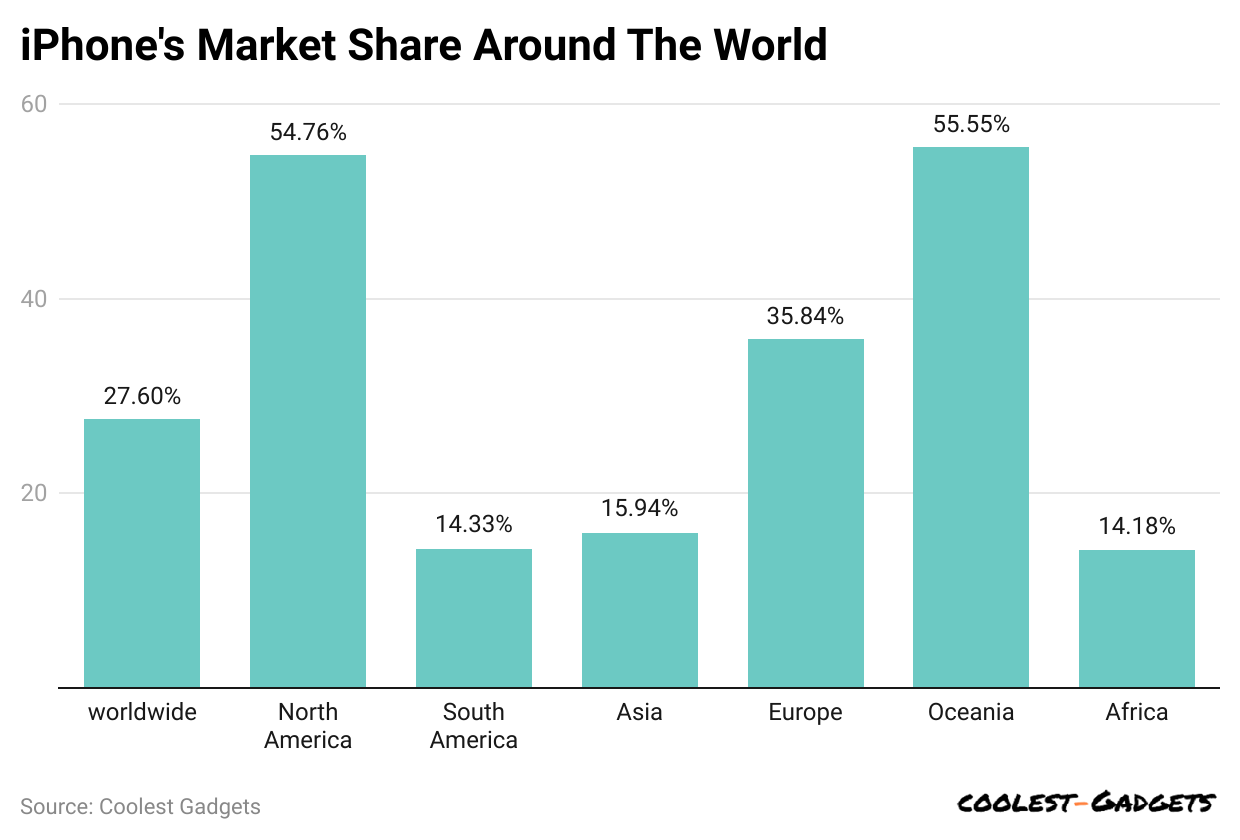
- In 2023, iPhones held 27.6% of the global market, with North America having the largest share at 54.76%.
- Other regions included Oceania (55.55%), Europe (35.84%), Asia (15.94%), South America (14.33%), and Africa (14.18%).
In 2024:
| Country | iPhone Market Share |
| Japan |
68.75% |
|
Denmark |
65.75% |
| Canada |
60.47% |
|
United States |
58.1% |
| United Kingdom |
52.28% |
|
Sweden |
56.22% |
| Germany |
38.95%
|
|
France |
35.38% |
| China |
24.22% |
|
India |
3.98% |
By App Revenue, 2024
| Name | Revenue (USD billion) |
| TikTok | 2.33 |
| Honor of Kings | 1.86 |
| Google One | 1.77 |
| Monopoly Go | 1.58 |
| Royal Match | 1.46 |
| YouTube | 1.44 |
| Disney+ | 1.28 |
| Roblox | 1.18 |
| PUBG Mobile | 1.18 |
| Last War: Survival | 1.14 |
(Reference: bigohtech.com)
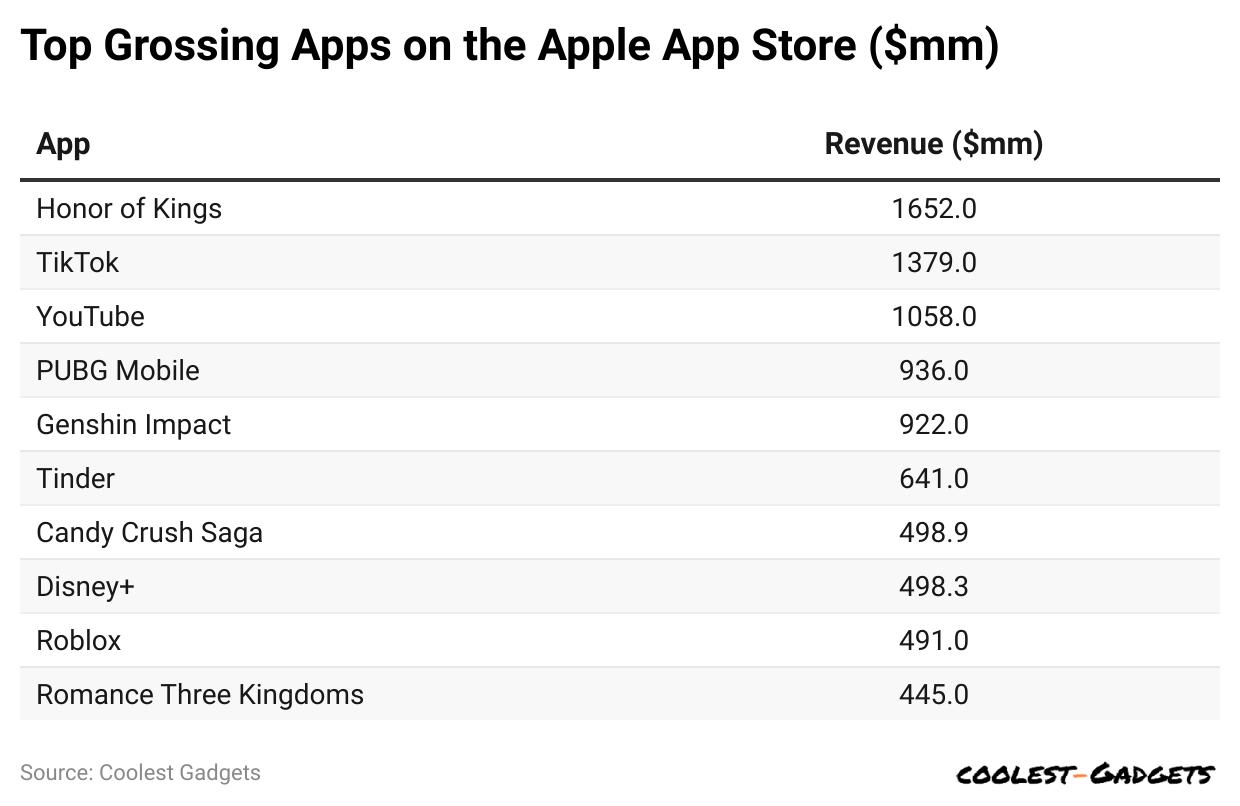
- In 2023, the highest-earning iPhone app was Honor of Kings, making USD 1.652 billion.
- ikTok followed with USD 1.379 billion, YouTube earned USD 1.058 billion, and PUBG Mobile earned USD 0.936 billion.
- Other top apps included Genshin’s Impact (USD 0.922 billion), Tinder (USD 0.641 billion), Candy Crush Saga (USD 0.4989 billion), Disney+ (USD 0.4983 billion), Roblox (USD 0.491 billion), and Romance Three Kingdoms (USD 0.455 billion).
(Reference: bigohtech.com)
- The top popular iPhone Apps in 2023 are Honor of Kings, TikTok, Youtube, and P.U.B.G. Mobile, with revenue earned of USD 1.652 billion, USD 1.379 billion, USD 1.058 billion, and USD 0.936 billion, respectively.
- Other apps’ revenue shares are Genshin Impact (USD 0.922 billion), Tinder (USD 0.641 billion), Candy Crush Saga
- (USD 0.4989 billion), Disney+ (USD 0.4983 billion), Robolox (USD 0.491 billion), and Romance Three Kingdoms (USD 0.455 billion).
iPhone Price Statistics
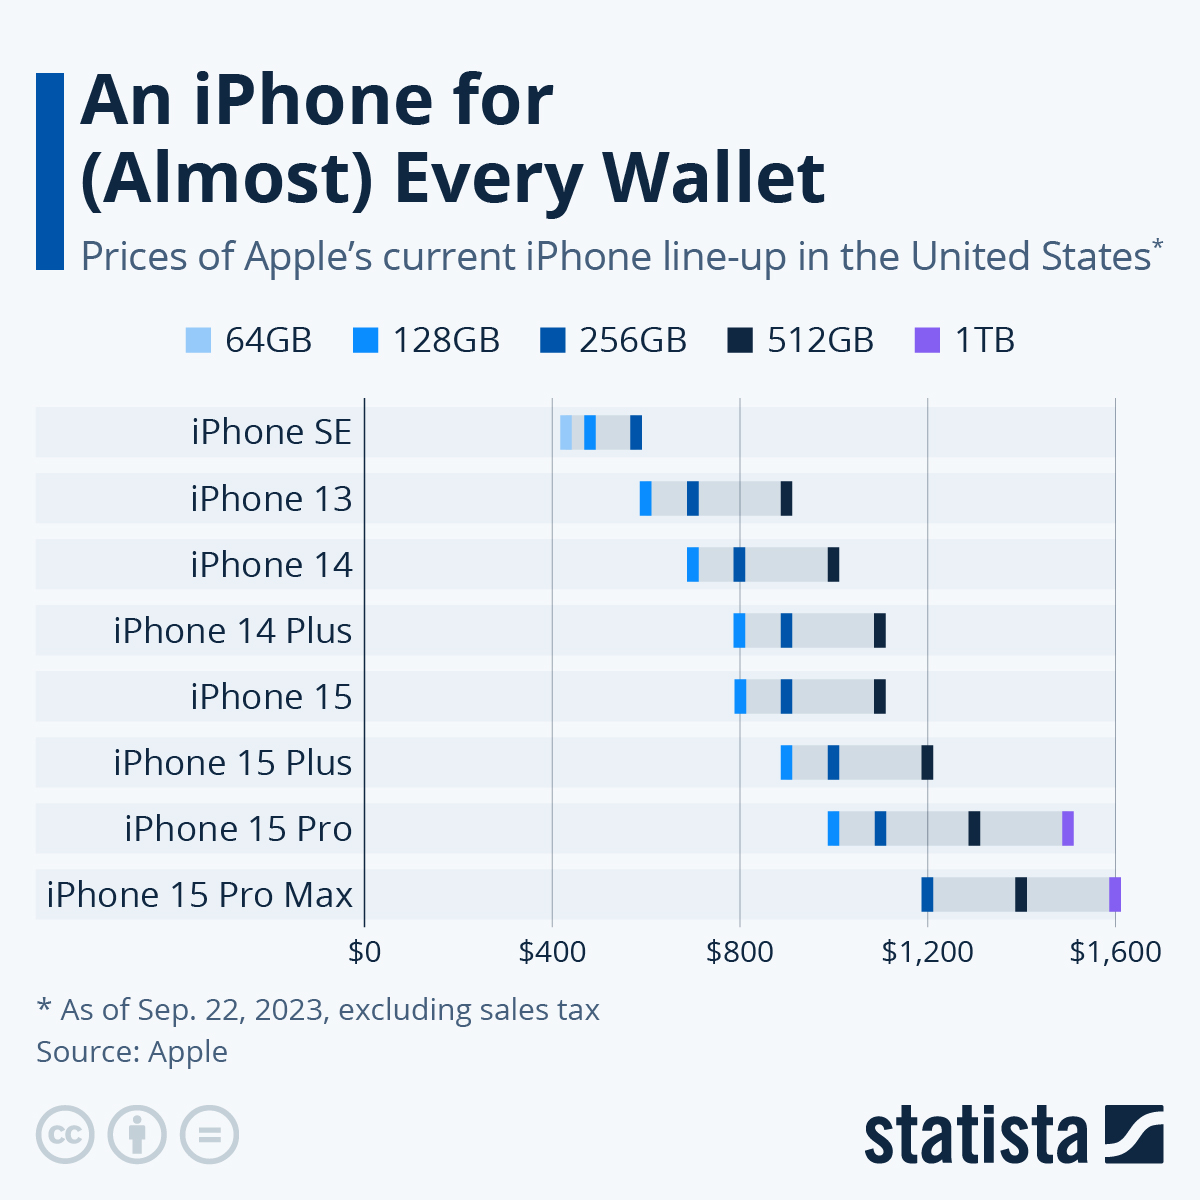
(Source: statista.com)
iPad statistics
- Apple Statistics stated that by the end of the first quarter of 2024, iPads made up around 5.87% to 6% of Apple’s total revenue.
- In 2023, the iPad’s revenue share changed each quarter: 8.02% in the first, 7.03% in the second, 7.08% in the third, and 7.2% in the fourth quarter.
- During the first quarter of 2023, Apple led the tablet market with 10.88 million iPads sold, making up 50% of total shipments.
- A 2023 report by Statcounter showed the iPad’s market share by region: Japan (75.64%), Oceania (78.1%), North America (55.8%), Europe (49.32%), Denmark (76.07%), Canada (67.45%), and Norway (66.65%). Currently, half of all iPads run on iPadOS 16.
- Popular models include the 11-inch and 12.9-inch iPads (44%), the 10.2-inch iPad (26%), iPad Air (19%), and iPad Mini (7%).
- In the U.S., 56% of businesses use iPads. The highest-earning app in the U.S. is Roblox.
You May Also Like To Read
- Anker Statistics
- Sennheiser Statistics
- Seagate Statistics
- Razer Statistics
- Motorola Statistics
- Samsung Statistics
- Garmin Statistics
- Panasonic Statistics
- LG Statistics
- Huawei Statistics
- Oppo Statistics
- iPhone Statistics
Apple Mac Statistics
- According to a report from Statista, Apple Mac computers will generate USD 7.78 billion in sales revenue by the first quarter of 2024.
- By the end of 2023, global Mac shipments reached 5.9 million units.
- As of 2024, there are over 100 million Mac users worldwide. Mac holds a 10% share of total laptop and personal computer sales.
- In January 2023, macOS Catalina led the global market with an 87.44% share
- In the U.S., macOS is the second most popular operating system, holding 30% of the market.
- Women are the biggest users, making up 66%.
- Among Millennials in the U.S., 31% use MacBooks.
Apple Pay Statistics
- In the United States, 85% of merchants recently used Apple Pay as a payment method.
- In 2023, Apple Pay had around 48.7 million users.
- The number of users is expected to grow in the coming years, reaching 51.5 million in 2024, 54.2 million in 2025, and 56.7 million in 2026.
- When looking at different age groups, 73.1% of Gen Z use Apple Pay, followed by 52.4% of Millennials, 51.1% of Bridge Millennials, and 43.9% of Baby Boomers.
- The United States has the highest number of users, 39,781, which is 56% of the total.
- Other major countries include the United Kingdom (6,368 users, 9%), Canada (4,941 users, 7%), and Australia (3,585 users, 5%).
- By industry, retail leads with 17,981 users (26%), followed by apparel and fashion (5,136 users, 7%), manufacturing (4,771 users, 7%), and food and beverages (3,605 users, 5%).
Apple Watches Statistics
(7-year Analyses From 2020 to 2026)
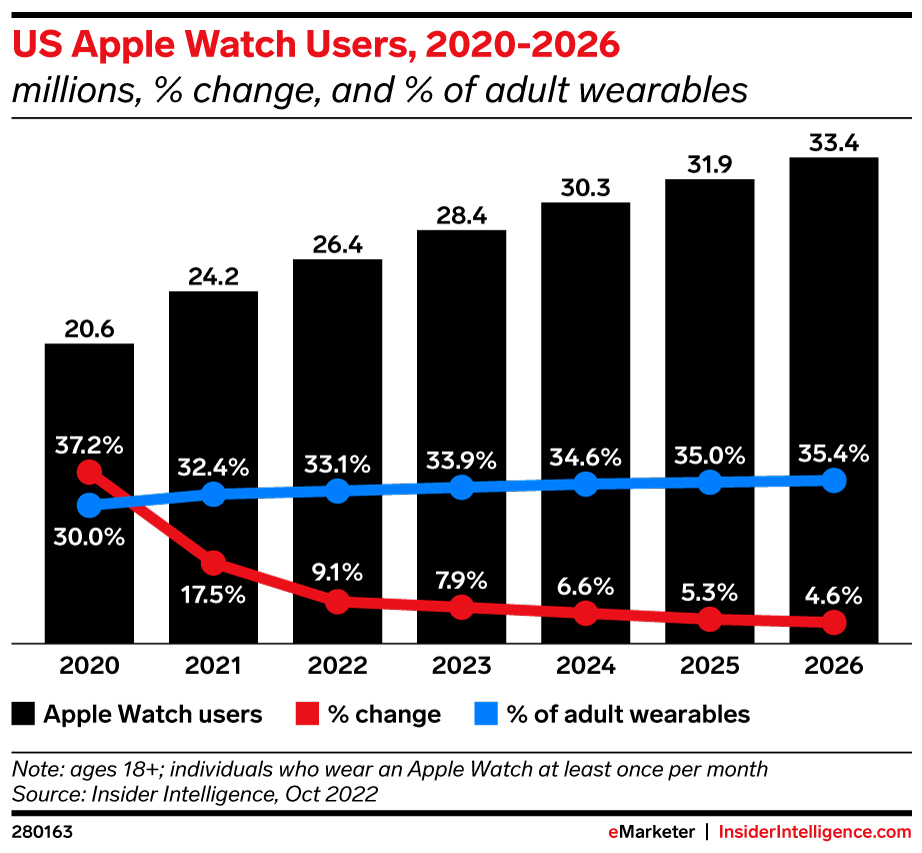
(Source: insiderintelligence.com)
- According to the above graph analysis, 28.4 million people in the United States use an Apple Watch, and the market is growing by 7.9%.
- By the end of 2024, the number of Apple Watch users is expected to reach 30.3 million.
Apple T.V. Statistics
(5-year Analyses From 2022 to 2026)
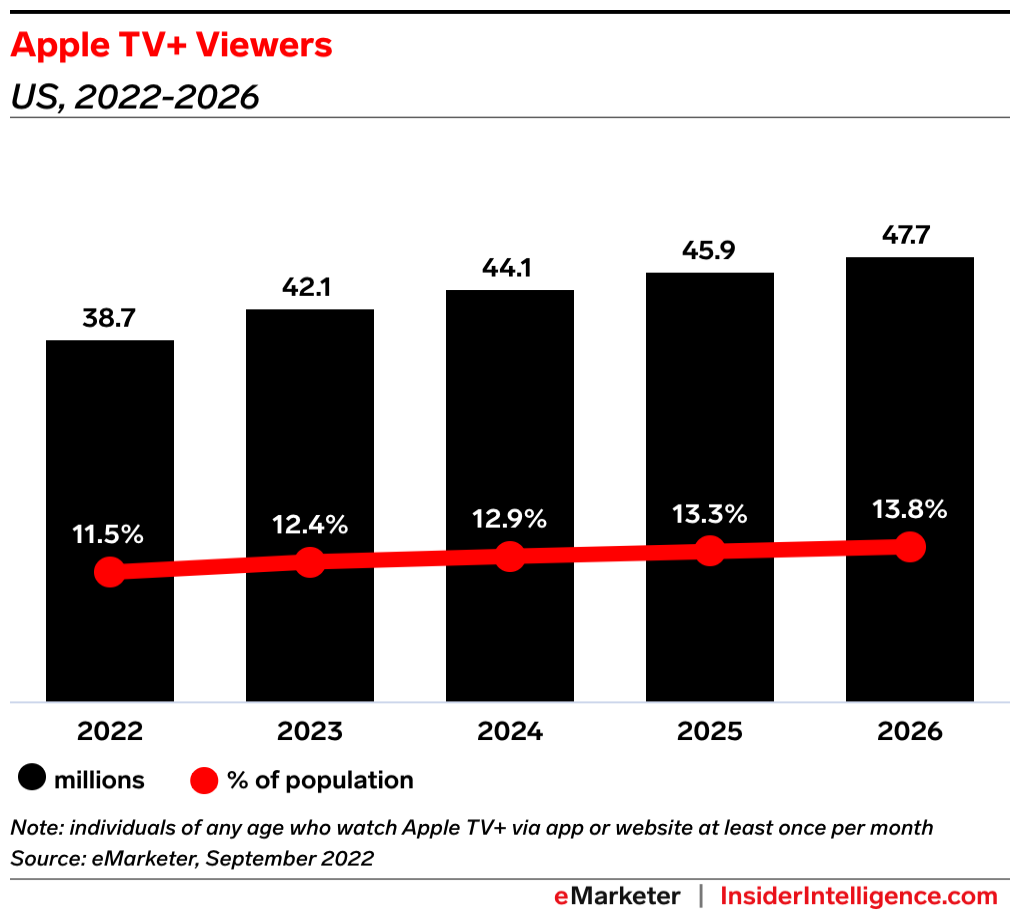
(Source: insiderintelligence.com)
- According to Apple statistics, 42.1 million individuals worldwide use Apple TV, a 12.4% share of the total population.
- The number of people using Apple TV is expected to grow in the next few years. In 2024, there will be about 44.1 million users, increasing to 45.9 million in 2025 and 47.7 million in 2026.
- The percentage of the population using Apple TV will also rise. In 2024, it will be 12.9%, 13.3% in 2025, and 13.8% in 2026.
You May Also Like To Read
- Anker Statistics
- Sennheiser Statistics
- Seagate Statistics
- Razer Statistics
- Motorola Statistics
- Samsung Statistics
- Garmin Statistics
- Panasonic Statistics
- LG Statistics
- Huawei Statistics
- Oppo Statistics
- iPhone Statistics
By Device Traffic
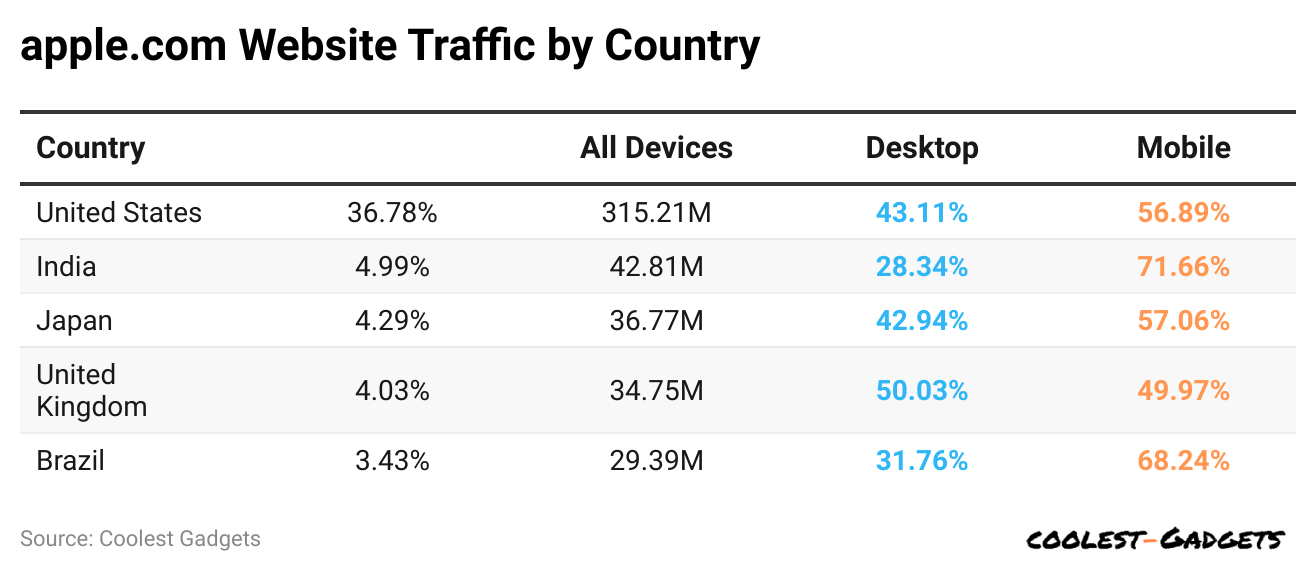
(Reference: semrush.com)
- As per Apple Statistics, in January 2024, most visitors to Apple’s website came from mobile devices (60.06%), while desktop users made up 39.94% of the traffic.
- The United States had the highest number of visitors, accounting for 36.78% of the total, which equals 315.21 million visits.
- Among them, 43.11% used desktops, and 56.89% used mobile devices.
- Other countries with high traffic include India (4.99% or 42.81 million), Japan (4.29% or 36.77 million), the United Kingdom (4.03% or 34.57 million), and Brazil (3.43% or 29.39 million).
- The share of desktop and mobile users in these countries is as follows: India (28.34% desktop, 71.66% mobile), Japan (42.94% desktop, 57.06% mobile), the United Kingdom (50.03% desktop, 49.97% mobile), and Brazil (31.76% desktop, 68.24% mobile).
By Web Traffic
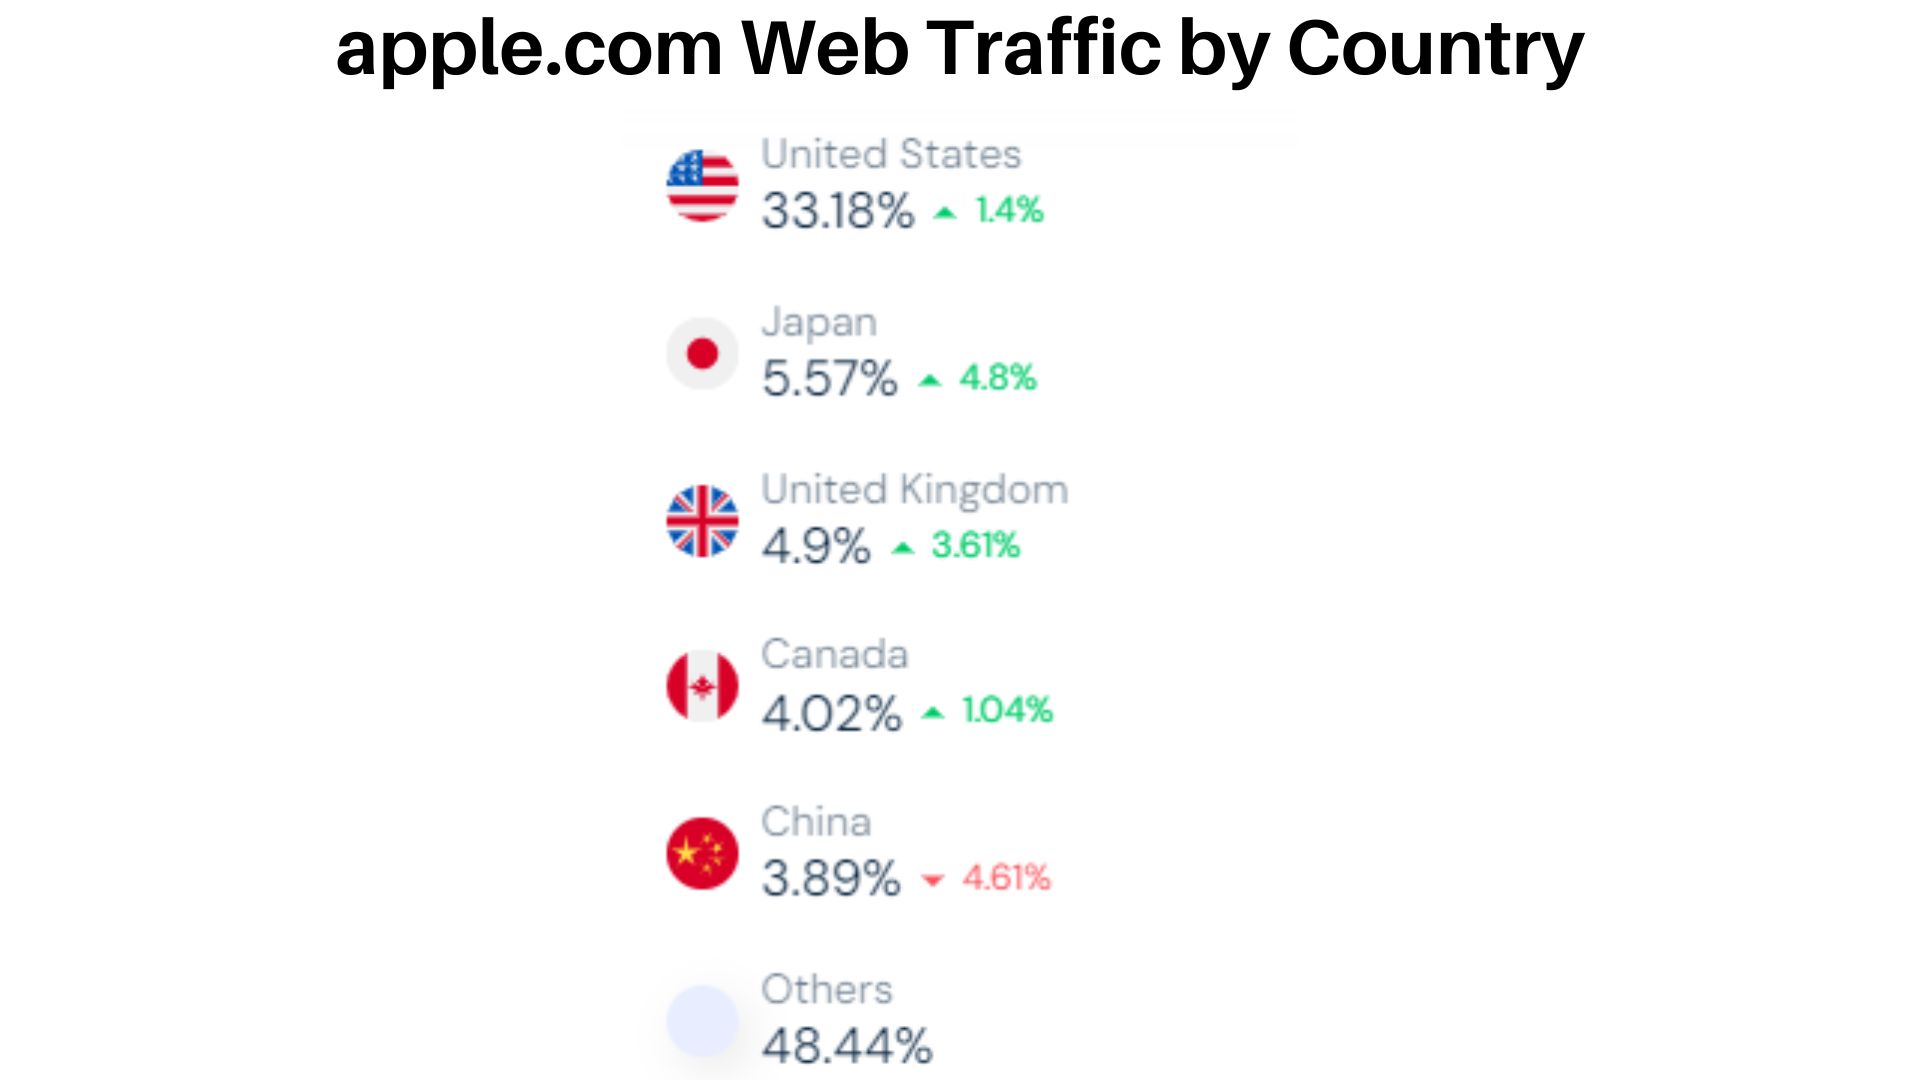
(Source: similarweb.com)
- As of January 20, 2024, the United States had the highest number of visitors to Apple.com, making up 33.18% of total traffic.
- It also saw the biggest increase in visitors, growing by 1.4%. Japan contributed 5.57% of the traffic, with a 4.8% rise.
- The United Kingdom followed with 4.9% (+3.61%), followed by Canada with 4.02% (+1.04%).
- China accounted for 3.89% but saw a drop of 4.61%.
- Together, the remaining countries made up 48.44% of the total web traffic to Apple’s website.
By Demographics
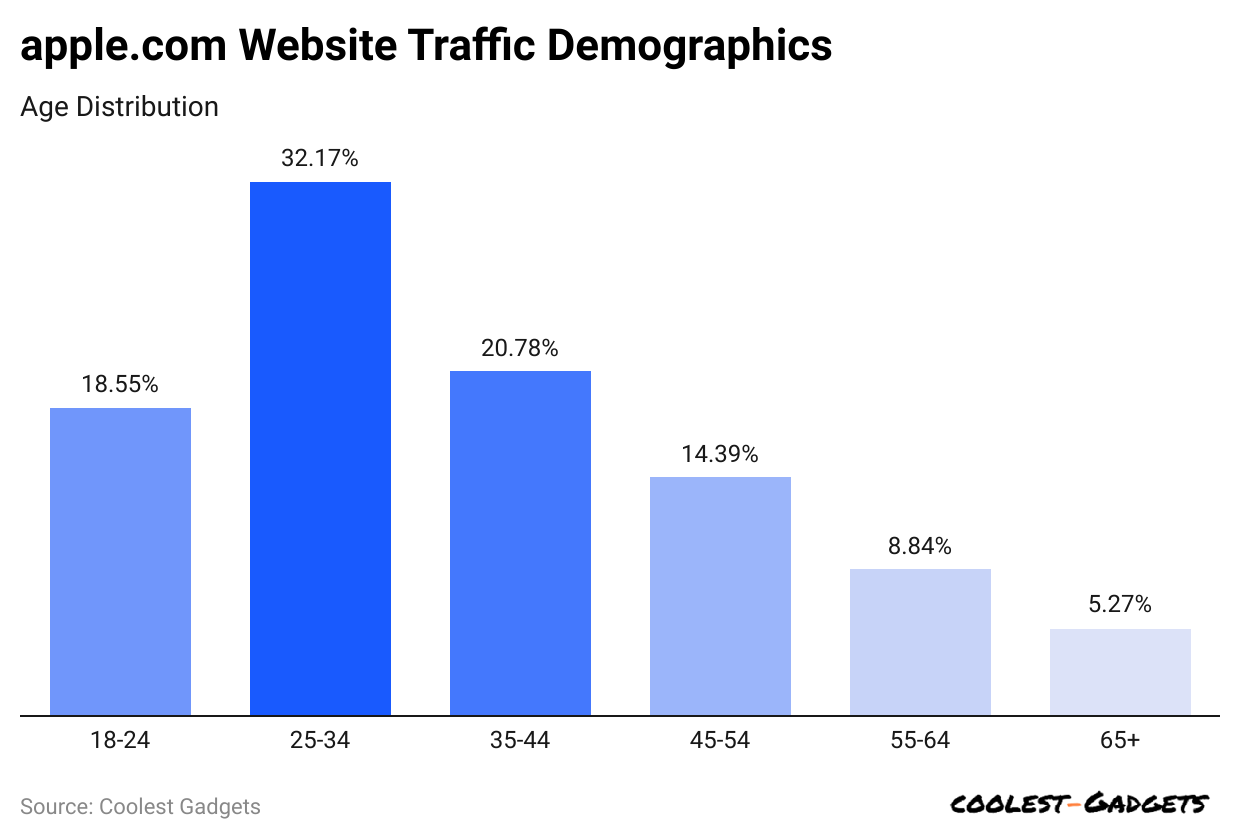
(Reference: similarweb.com)
- According to Apple Statistics, 32.17% of Apple.com visitors are between 25 and 34 years old.
- About 20.78% are in the 35 to 44 age group.
- Around 55% of visitors are between 18 and 24, while 14.39% are aged 45 to 54.
- People aged 55 to 64 make up 84% of users, and 5.27% are over 65.
- Regarding gender, 58.02% of visitors are male, while 41.98% are female.
- Apple.com attracts users of all ages, with a higher number of younger visitors.
By Traffic Sources
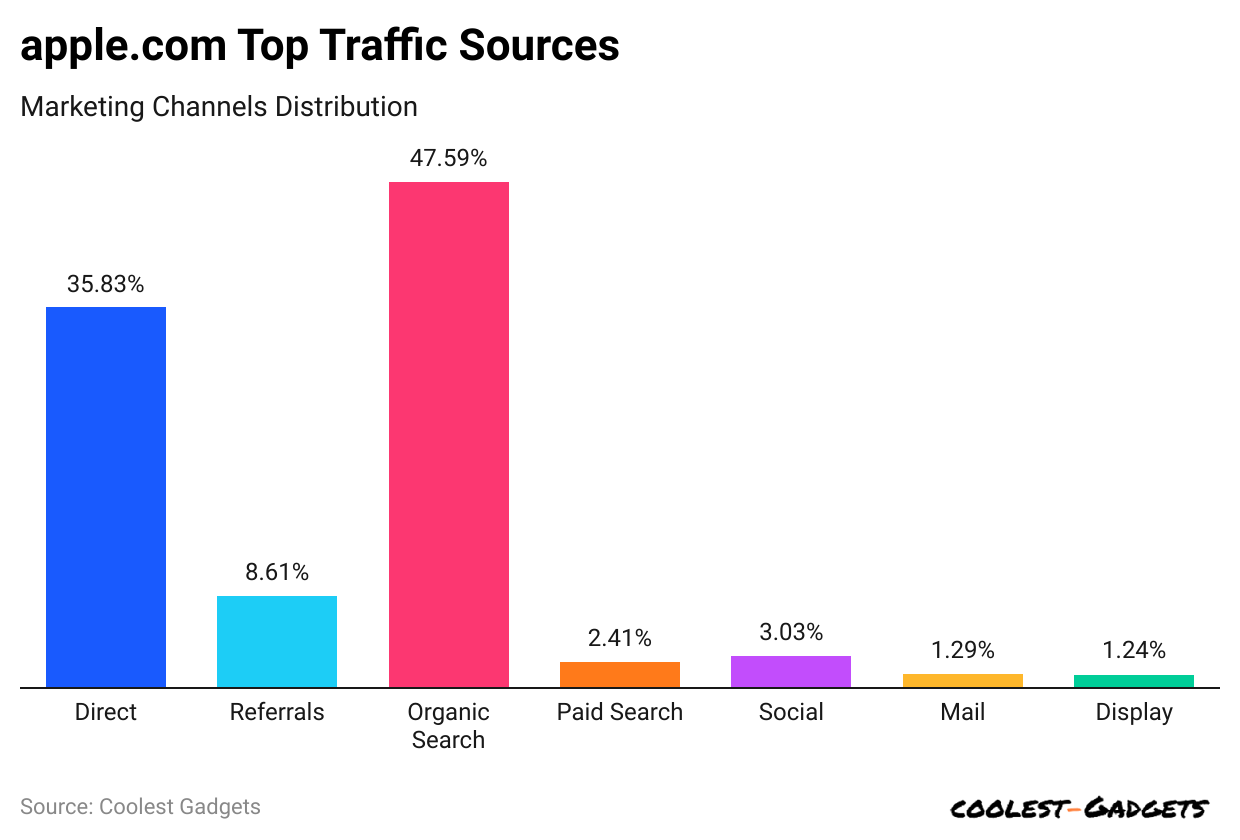
(Reference: similarweb.com)
- Most visitors to Apple.com come from organic searches, making up 47.59% of the traffic.
- Direct traffic follows at 35.83%, while 8.61% comes from referrals.
- Other sources include social media (3.0%), paid search (2.41%), mail (1.29%), and display ads (1.24%).
- Apple.com gets visitors from many different channels.
By Social Media Traffic
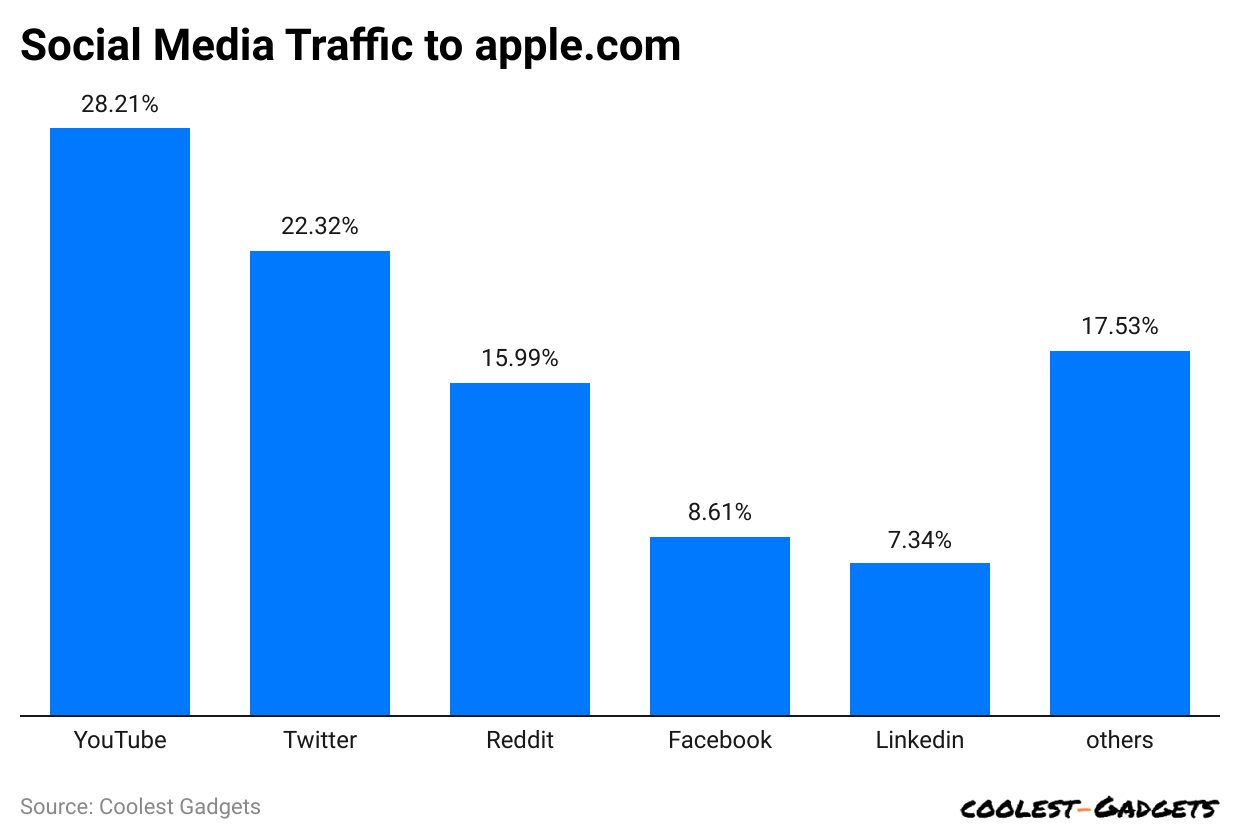
(Reference: similarweb.com)
- YouTube brings the most visitors to Apple’s website, making up 28.21% of social media traffic.
- Twitter sends 22.32%, while Reddit contributes 15.99%.
- Facebook adds 8.61%, and LinkedIn drives 7.34%.
- Other social media platforms together account for 17.53%, making a smaller impact on Apple’s web traffic.
Apple Stores Statistics
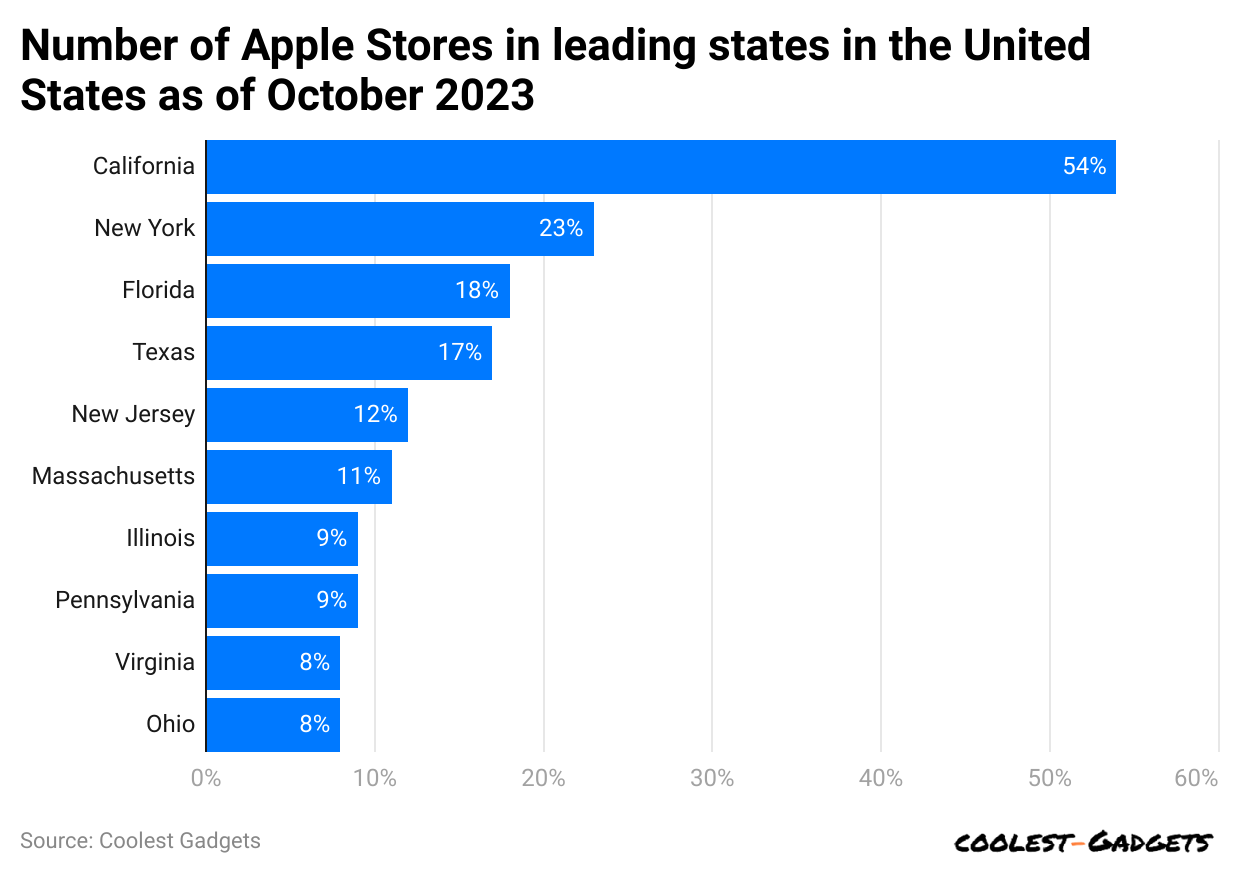
(Reference: statista.com)
- As of October 2023, the United States has over 270 Apple stores in major states. California has the most, with around 54 stores.
- Other states include New York (23), Florida (18), Texas (17), New Jersey (12), Massachusetts (11), Illinois (9), Pennsylvania (8), and Ohio (8).
You May Also Like To Read
- Apple Customer Loyalty Statistics
- Apple Smartphone Statistics
- Apple MacBook Statistics
- Google Smartphone Statistics
- (Advanced Micro Devices) AMD Statistics
- Xiaomi Smartphone Statistics
Popular Apple App Store Categories
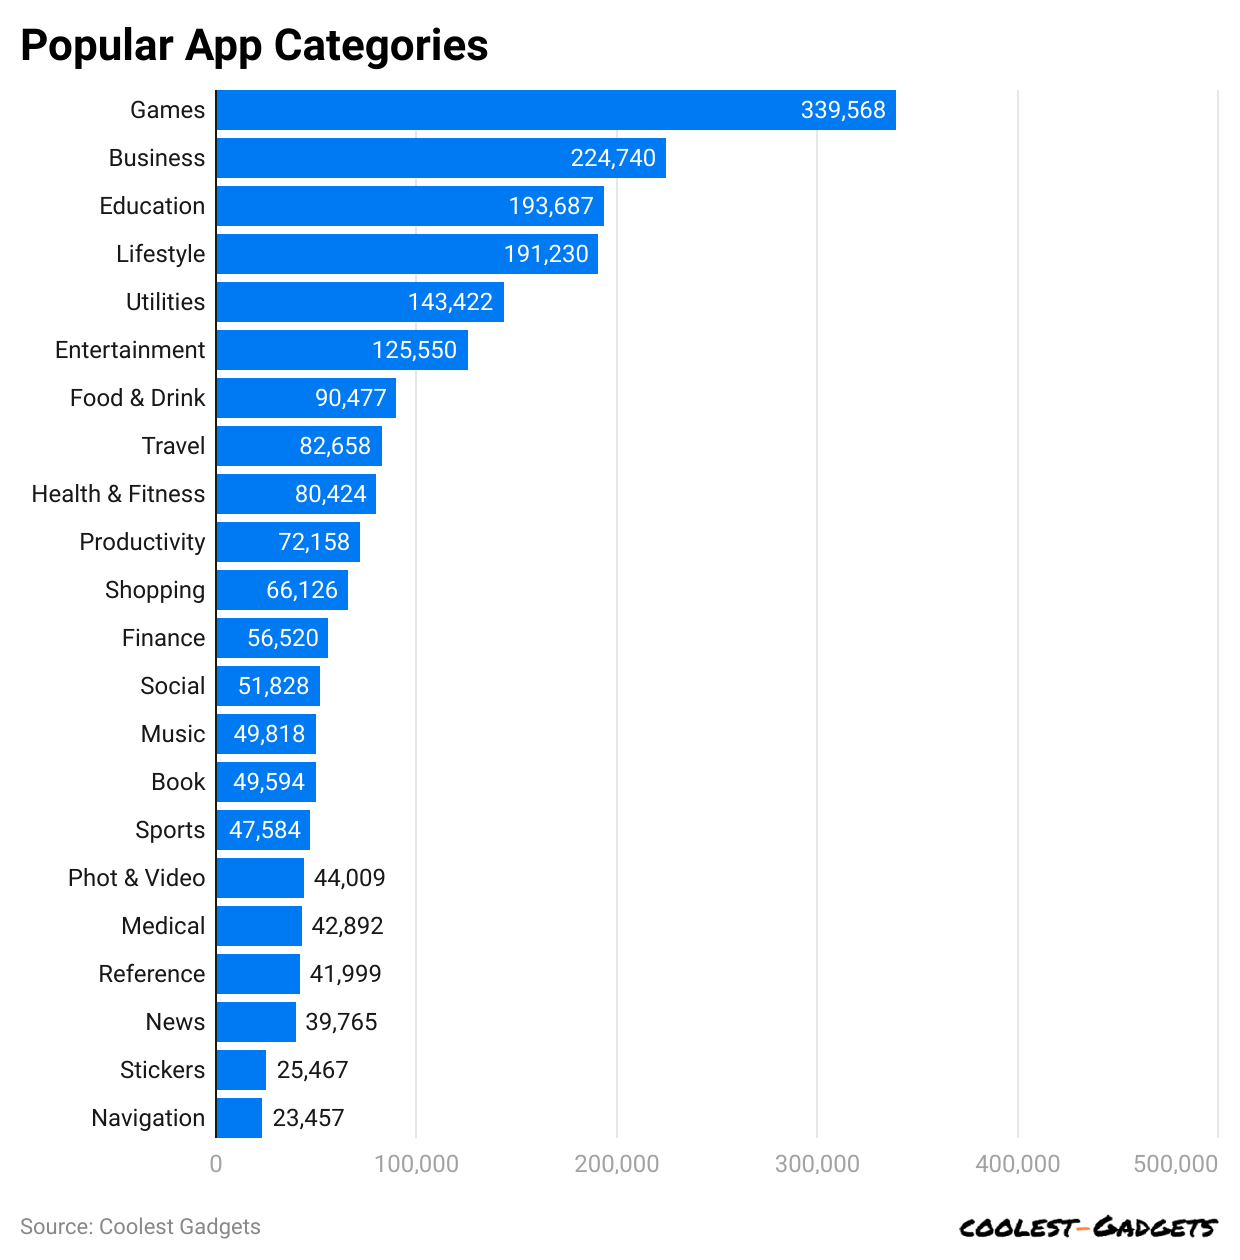
(Reference: bigohtech.com)
- In the third quarter of 2023, the most popular app categories in the U.S. App Store were Games (339,568), Business (224,740), and Education (193,687).
- Other top categories included Lifestyle, Utilities, and Entertainment.
- Less preferred categories were Navigation (23,457), Stickers (25,467), News (39,765), and Reference (41,999).
Conclusion
Apple continues to be one of the biggest technology companies in the world. Its App Store offers millions of apps in different categories, with Games, Business, and Education being the most popular. While some categories have fewer apps, Apple still provides a wide range of choices for users.
The company’s success comes from its high-quality products, strong security, and smooth user experience. With constant updates and innovations, Apple remains a leader in the tech industry. As more people use Apple devices, the demand for apps and services is expected to grow even more in the future.
Sources
Barry Elad is a tech enthusiast passionate about exploring various technology topics. He collects key statistics and facts to make tech easier to understand. Barry focuses on software and its benefits for everyday life. In his free time, he enjoys creating healthy recipes, practicing yoga, meditating, and walking in nature with his child. Barry's mission is to simplify complex tech information for everyone.