Samsung Statistics By Smartphone Shipment, Manufacturing Location and Facts

Updated · Mar 26, 2025


TABLE OF CONTENTS
- Introduction
- Editor’s Choice
- History of Samsung
- Basics About Samsung
- About Samsung
- Samsung Earning Statistics
- By Samsung’s Annual Revenue
- By Samsung’s Annual Earnings
- By Smartphone Shipment
- By Samsung’s Smartphones Annual Sales
- By Manufacturing Location
- Samsung Smartphone Market Share
- By Continent
- Best Samsung Smartphone of 2023
- By Demographics
- Samsung Tablets Statistics
- By Segments
- Net Worth of Samsung Company
- By Samsung Employees
- By Website Traffic
- Samsung Life Insurance Statistics
- The Most Valuable Electronic Brand
- Samsung’s Involvement with the Olympics
- Conclusion
Introduction
Samsung Statistics: Samsung is one of the world’s biggest technology companies, known for its smartphones, TVs, home appliances, and more. It has a strong global presence, with millions of customers using its products daily. Over the years, Samsung’s sales and revenue have grown significantly, making it a leader in the electronics industry. The company invests heavily in research and innovation, constantly improving its products to stay ahead of competitors.
Samsung’s success is also reflected in its employment numbers, as it provides jobs to thousands of people worldwide. With its continuous growth, the company remains a key player in the global market. This article will explore key statistics about Samsung, including its revenue, market share, and other important business insights.
Editor’s Choice
- Samsung reported a total revenue of 300.9 trillion Korean won (approximately USD 225 billion) in 2024.
- Meanwhile, the company’s operating profit for 2024 stood at 32.7 trillion Korean won (around USD 24.5 billion).
- Q4 2024 Performance: In the fourth quarter of 2024, Samsung achieved a revenue of 75.8 trillion Korean won (around USD 56.7 billion) and an operating profit of 6.5 trillion Korean won (about USD 4.9 billion).
- Samsung led the global smartphone market in the third quarter of 2024 with 57.5 million units shipped.
- As mentioned in Samsung Statistics, in the fourth quarter of 2024, Samsung had a 16% market share and shipped 51.9 million units.
- As of February 2025, Samsung’s global mobile vendor market share was 23.61%.
- Samsung maintained its leadership in the global TV market for the 19th consecutive year in 2024, achieving a 28.3% market share.
- Samsung’s memory business reported record-breaking revenue of 30.1 trillion Korean won (USD 20.8 billion) in the fourth quarter of 2024, driven by growing demand for AI memory products.
- Samsung Biologics reported a full-year 2024 revenue of 4.55 trillion Korean won (USD 3.4 billion), marking a 23% increase from the previous year.
- Samsung SDS announced 2024 revenue of 13.8282 trillion Korean won (USD 10.3 billion) and operating profit of 911.1 billion Korean won (USD 680 million).
History of Samsung
- Samsung started as a grocery trading business in 1938 but later grew into a global company.
- In the late 1960s, it entered the electronics industry, launching divisions for electronic devices and telecommunications.
- Samsung began producing televisions in the 1970s and achieved a significant milestone in 1978 by manufacturing 5 million TVs.
- Throughout the 1980s and ’90s, Samsung expanded into computer manufacturing, semiconductors, and digital TVs, becoming a leader in these areas.
- In 2011 and 2012, Samsung launched the Galaxy S II and Galaxy S III smartphones, which became very popular worldwide.
- Samsung became the largest smartphone maker in the world in 2012 after acquiring mSpot.
- The company also leads in the global TV market, maintaining the top position since 2008.
- Samsung competes closely with Apple in the smartwatch market and is second only to Apple in the tablet market, dominating the Android segment with its Galaxy Tab.
- Samsung is actively innovating in areas like artificial intelligence and foldable phones.
- Samsung Group, impacting over 20% of South Korea’s GDP, runs multiple businesses including hotels and hospitals, and is the country’s largest life insurance provider.
- The company, still family-owned, is currently led by Lee Jae-yong, the richest person in South Korea with a net worth of USD 9.2 billion.
- Samsung is headquartered in Samsung Town, Seoul, South Korea.
You May Also Like To Read
- Xiaomi Statistics
- Lenovo Statistics
- Asus Statistics
- Toshiba Statistics
- Intel Statistics
- Dell Statistics
- HP (Hewlett-Packard) Statistics
- Philips Statistics
- Apple Statistics
- Google Statistics
- Sony Statistics
- Microsoft Statistics
- Airbnb Statistics
- Google Revenue Statistics
- Amazon Statistics
- Tencent Statistics
Basics About Samsung
The name Samsung originated from two Korean words, “sam” and “sung,” which means “three stars”. Lee Byung-Chull founded the company in Korea in 1938 as a grocery trading store and slowly diversified into retail, textile, and insurance. The company is headquartered at Samsung Town, Seoul, South Korea.
The main segments of Samsung product lines are analyzed below.
Samsung Communication Devices
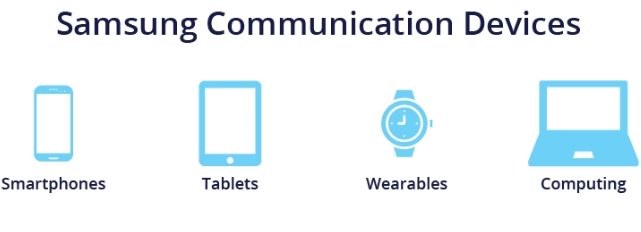
(Source: cloudfront.net)
- Smartphones: Galaxy S Series, Galaxy Note Series, and Galaxy Fold Series.
- Tablets: Galaxy Tab Series
- Wearables: Galaxy Watch Series and Galaxy Buds
- Computing: Samsung Galaxy Book and Chromebooks
Samsung Consumer Electronics
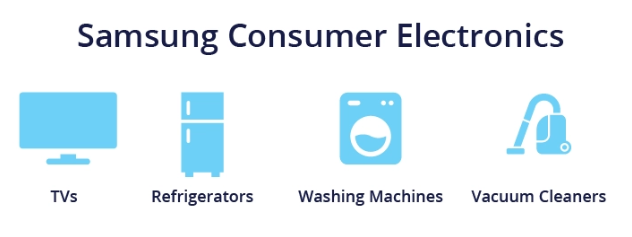
(Source: cloudfront.net)
- TVs: QLED TVs and the Frame
- Home Appliances: Refrigerators, Washing Machines, and Vacuum Cleaners
- Samsung Semiconductors: Memory Chips (NAND flash memory and DRAM), Ayatem LSI (producing application processors, image sensors, etc.), and Foundry (offering services for different companies of semiconductors).
- Samsung display panels: QLED (used in TVs), OLED (used in smartphones), and LCD (used in older versions of devices).
About Samsung
- Samsung is among the most renowned manufacturers of Smartphones.
- Samsung is operating its operations in more than 74 countries around the world and has more than 270,000 employees.
- The edge-to-edge display smartphone with curved edges was first launched by Samsung and was dubbed Samsung Galaxy Note Edge, in 2014.
- Are you aware? South Korea’s most prestigious life insurance company, Samsung Life Insurance, is owned through Samsung Group. Samsung Group.
- In the latter half of the decade the 1960s, Samsung began to enter the television electronics market and, over the next decades, grew its market with electronics, appliances for homes, along mobile phones.
- Samsung’s most well-known smartphone comes in the Galaxy S Series, which will launch in January 2024.
- For the 1 1st Half of 2023, the most popular Samsung smartphones will be the Galaxy A14 and Galaxy S23 Ultra.
- It is believed that Samsung will unveil its Galaxy S24 by Q1 of 2024.
Samsung Earning Statistics
- Consolidated revenue earned by Samsung in Q4 of 2023 was 67.78 trillion won (USD 50.78 billion), which has decreased by 3.8% (last year) and increased by 0.56% (previous quarter).
- As of 2023, Samsung’s consolidated revenue was 258.94 trillion won (USD 193.98 billion), decreasing by 13.32% YoY, and the operating profit was 6.57 trillion won (USD 4.92 billion), reduced by 84.85% YoY.
- In Q1 of 2023, revenue generated by Samsung Electronics was USD 54.3 billion, with an operating profit of $11.1 billion.
- According to Samsung sales statistics, the company has secured the highest position among Android tablet manufacturers, holding a market share of 23% in the Q1 of 2023.
- In the same quarter, Samsung’s semiconductor division sales generated USD 19.8 billion, which has grown by 23% from last year.
- Samsung’s consumer electronics, such as TVs and home appliances, account for USD 13.3 billion in revenue, which increased by 5% from the first quarter of 2022.
- Samsung’s mobile business reported total sales of USD 20.4 billion with a 4% YoY increment.
By Samsung’s Annual Revenue
- Q1 2024: Samsung reported consolidated revenue of KRW 75.8 trillion (USD 52.09 billion) and an operating profit of KRW 6.5 trillion (USD 4.46 billion).
- Q2 2024: The company achieved a gross profit of KRW 29.8 trillion (USD 20.46 billion), marking an increase of KRW 3.7 trillion ( USD 2.54 billion) from the previous quarter.
- Q3 2024: Samsung’s consolidated revenue rose to KRW 79.1 trillion (approximately USD 54.37 billion), a 7% increase from the previous quarter. Operating profit for this period was KRW 9.18 trillion ( USD 6.31 billion).
- Q4 2024: The company posted consolidated revenue of KRW 75.8 trillion (approximately USD 52.09 billion) and an operating profit of KRW 6.5 trillion (USD 4.46 billion).
- Full Year 2024: Samsung’s annual revenue reached KRW 300.9 trillion (USD 206.86 billion).
- Samsung’s total income from selling goods and services in the first quarter of 2023 was ₩63.75 trillion, which is about USD 45.57 billion.
- The company’s operating profit during this period was ₩640 billion, or USD 478.55 million, marking a 95% drop from the previous year.
- This decrease in profit is the lowest since the first quarter of 2009, a time before Samsung was a major player in the smartphone market.
- Samsung attributes this sharp decline in early 2023 to a weaker economy and less demand for its chips.
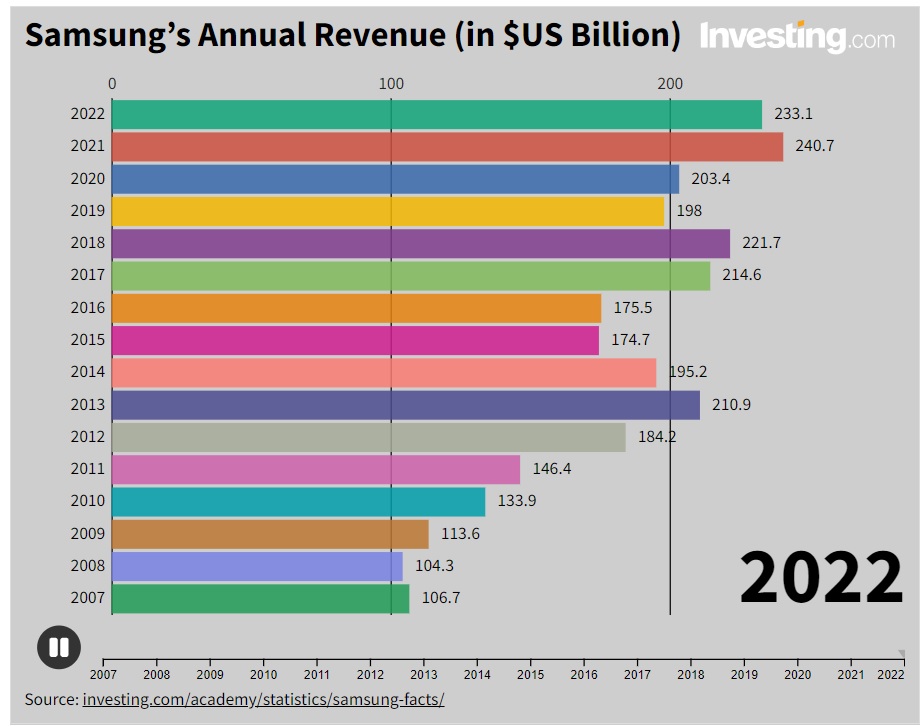
Samsung’s Annual Revenue from 2007 to 2023 in USD Billion
| Year | Annual Revenue in USD Billion | Change |
| 2007 | 106.73 | |
| 2008 | 104.33 | -2.25% |
| 2009 | 113.64 | 8.92% |
| 2010 | 133.94 | 17.87% |
| 2011 | 146.43 | 9.32% |
| 2012 | 184.22 | 25.8% |
| 2013 | 210.86 | 14.46% |
| 2014 | 195.22 | -7.42% |
| 2015 | 174.66 | -10.53% |
| 2016 | 175.51 | 0.49% |
| 2017 | 214.57 | 22.25% |
| 2018 | 221.67 | 3.31% |
| 2019 | 198.03 | -10.67% |
| 2020 | 203.43 | 2.73% |
| 2021 | 240.71 | 18.33% |
| 2022 | 233.13 | -3.15% |
| 2023 (Q1) | 45.57 |
- Samsung reported a substantial operating profit increase of 262.6% in the third quarter of 2023 compared to the previous quarter, despite a 77.6% decrease compared to the same period last year.
- The company’s second-quarter earnings in 2023 showed a sharp decline with a 95% drop in profit due to ongoing low demand for memory chips.
- Revenue in the second quarter was slightly lower than expected at ₩60.01 trillion (about USD 47.21 billion), while operating profit was higher than anticipated at ₩0.67 trillion.
- Samsung’s mobile business, which includes popular products like the Galaxy smartphones and Samsung Pay, saw a 22% increase in revenue to ₩30.74 trillion in the first quarter of 2023 from the previous quarter.
- Operating profit for the mobile division rose by 3% year-over-year to ₩3.94 trillion in the first quarter of 2023.
- The S23 series, particularly the S23 Ultra priced at USD 1,200, performed exceptionally well, boosting sales for Samsung’s Mobile Division.
By Samsung’s Annual Earnings
- The start of 2023 was not strong for Samsung, with only USD 478.55 million in operating profit.
- Their total revenue in the first quarter of 2023 was ₩63.75 trillion, which is around USD 45.57 billion.
- The low profit in early 2023 was the worst performance since 2009.
| Year | Earnings in USD Billion | Change |
| 2007 | 10.54 | |
| 2008 | 6.24 | -40.23% |
| 2009 | 10.21 | 63.44% |
| 2010 | 16.69 | 63.47% |
| 2011 | 15.21 | -8.88% |
| 2012 | 27.42 | 80.29% |
| 2013 | 35.35 | 28.89% |
| 2014 | 26.44 | -25.2% |
| 2015 | 22.65 | -14.33% |
| 2016 | 26.59 | 17.39% |
| 2017 | 50.37 | 89.42% |
| 2018 | 55.67 | 10.52% |
| 2019 | 26.14 | -53.04% |
| 2020 | 31.26 | 19.61% |
| 2021 | 45.85 | 46.64% |
| 2022 | 35.85 | -21.8% |
| 2023 (Q1) | 478.55 million |
By Smartphone Shipment
| Quarter | Shipments (million units) | Market Share | YoY Growth Rate |
| Q1 2024 | 60.2 | 20.8% |
– |
|
Q2 2024 |
54.9 | 19 | – |
| Q3 2024 | 57.5 | 19.0 |
-2.0 |
|
Q4 2024 |
51.7 | 15.6 |
-2.7 |
(Reference: statista.com)
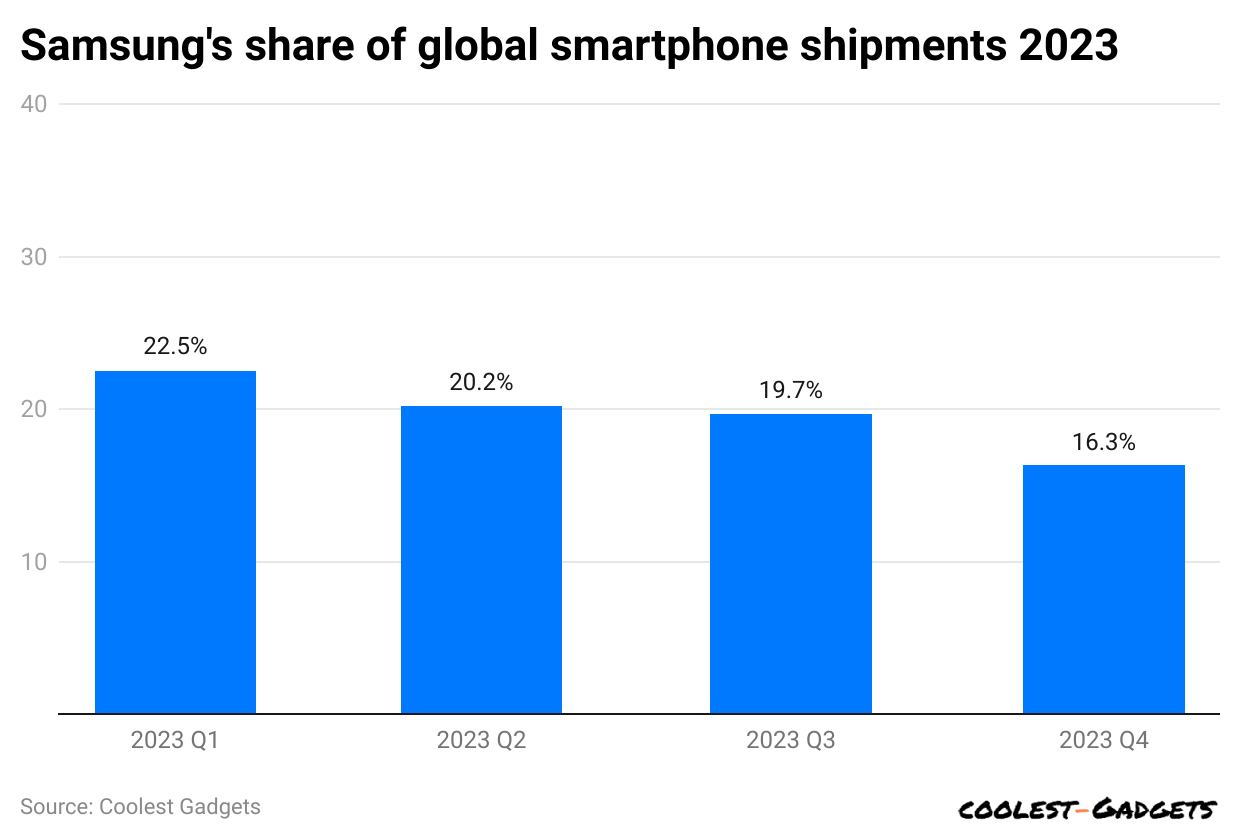
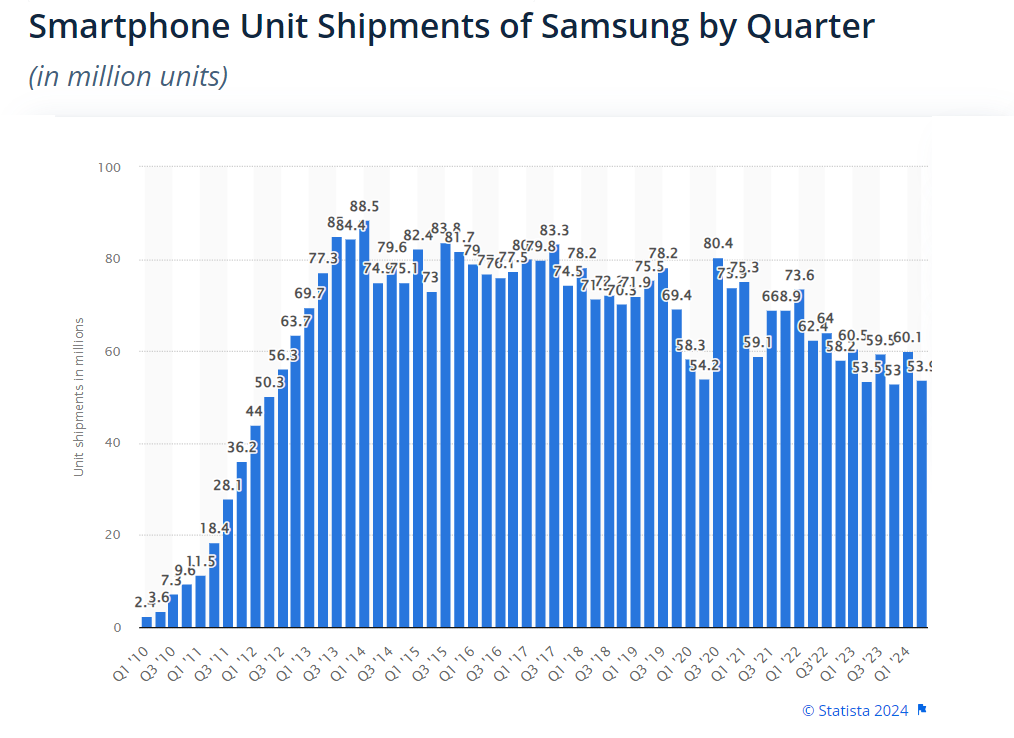
- According to a report published by Statista, the company will have shipped around 226.6 million smartphones globally by 2023, accounting for 19.4% of the shipment share.
- In the 1st quarter of 2023, Samsung’s smartphone shipment gained the highest share, 22.5%.
- Furthermore, shipment shares in other quarters are followed by Q2 (20.2%), Q3 (19.7%), and Q4 (16.3%), resulting in 53 million units.
Global Smartphone Shipments in Millions
- In the first three months of 2023, worldwide smartphone sales dropped by 14% from last year and by 7% from the previous quarter, totaling 280.2 million units.
- Samsung sold more phones than Apple due to the popularity of its mid-range A Series and the new S23 series.
- Although Apple also saw a decline in sales, it had the smallest decrease compared to other brands.
- Total revenue from smartphone sales fell by 7% to about USD 104 billion.
- Samsung, Apple, and Xiaomi increased the prices of their smartphones compared to last year.
Global Smartphone Shipments in Millions
| Brand | Q2 2021 | Q3 2021 | Q4 2021 | Q1 2022 | Q2 2022 | Q3 2022 | Q4 2022 | Q1 2023 |
| Samsung | 57.6 | 69.3 | 69.0 | 74.5 | 62.5 | 64.3 | 58.3 | 60.6 |
| Apple | 48.9 | 48.0 | 81.5 | 59.0 | 46.5 | 49.2 | 70.0 | 58.0 |
| Xiaomi | 52.5 | 44.4 | 45.0 | 39.0 | 39.5 | 40.5 | 33.2 | 30.5 |
| Oppo | 33.6 | 38.1 | 33.9 | 30.9 | 28.2 | 29.5 | 29.6 | 24.0 |
| Vivo | 32.5 | 33.7 | 29.3 | 24.8 | 25.5 | 26.0 | 23.4 | 21.2 |
| Others | 98.0 | 108.5 | 112.7 | 98.1 | 92.3 | 92.4 | 89.4 | 85.9 |
| Total Market | 323.1 | 342.0 | 371.4 | 326.4 | 294.5 | 301.9 | 303.9 | 280.2 |
By Samsung’s Smartphones Annual Sales
- In 2023, Samsung’s smartphone shipments declined to 226.6 million units, accounting for a 19.4% market share. This marked the first time Apple surpassed Samsung in global smartphone shipments.
- In the first quarter of 2024, Samsung regained its leading position, shipping 60.2 million units, representing a 20.8% market share.
- In 2022, they sold 200 million units, which was 72.3 million less than in 2021.
- The company’s most successful year was 2019, with 295 million phones sold.
- Despite a slow start in 2019, with sales down 8.56% in the first quarter from the previous year, Samsung saw a dramatic increase in sales.
- From early 2019 to early 2021, Samsung’s smartphone sales soared by 382.61%.
Samsung’s Smartphones Annual Sales in Units
| Year | Annual Sales |
| 2010 | 22.9 million |
| 2011 | 94 million |
| 2012 | 214.3 million |
| 2013 | 316.4 million |
| 2014 | 318.1 million |
| 2015 | 321 million |
| 2016 | 309.6 million |
| 2017 | 317.7 million |
| 2018 | 292.2 million |
| 2019 | 295 million |
| 2020 | 266.8 million |
| 2021 | 272.3 million |
| 2022 | 200 million |
By Manufacturing Location
- Samsung’s products are in South Korea, China, Vietnam, India, Indonesia, Taiwan, and Brazil.
- In India, the most manufactured models are Galaxy M and Galaxy A, and the Noida plant produces nearly 120 million units each year.
- South Korea produces 8% of the company’s smartphones, mostly sold out in local areas.
- Indonesia produces roughly 800,000 smartphones each year.
- On the other hand, Turkey holds a market share of 43% and is thus termed the largest producer of Samsung smartphones.
You May Also Like To Read
- Anker Statistics
- Sennheiser Statistics
- Seagate Statistics
- Razer Statistics
- Motorola Statistics
- Garmin Statistics
- Panasonic Statistics
- LG Statistics
- Huawei Statistics
- Oppo Statistics
- iPhone Statistics
(Reference: bankmycell.com)
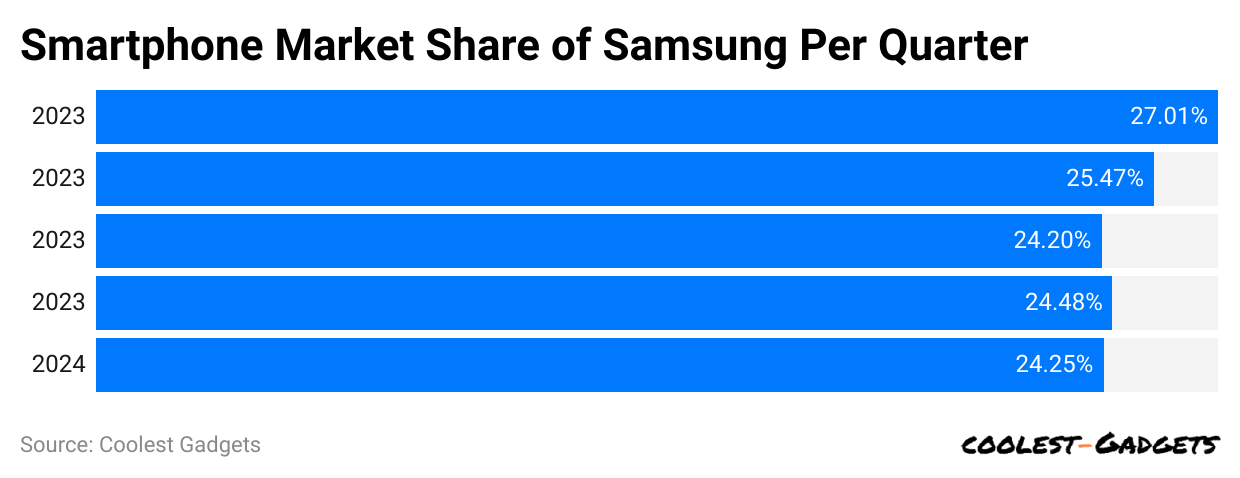
- In the 1st quarter of 2023, Samsung’s global smartphone market share was 27.01%.
- Furthermore, other quarterly shares in 2023 are followed by Q2 (25.47%), Q3 (24.20%), and Q4 (24.48%).
- According to a report published by bankmycwll.com in Q1 of 2024, Samsung smartphones’ expected market share will be 24.25%.
| Quarter, 2024 | Samsung’s Market Share |
| Q1 |
20.8% |
|
Q2 |
18% |
| Q3 |
18% |
|
Q4 |
16% |
By Continent
- In 2023, approximately 35% of Samsung Electronics’ sales revenue came from the Americas.
- In the same year, Europe accounted for about 18% of the company’s sales revenue.
- In 2023, Samsung smartphones held a significant portion of the market in different continents.
- In North America, their market share started at 28.82% in January and declined to 22.71% by December, with a slight increase to 23.1% in January 2024.
- Europe showed more stability, where Samsung began with 31.45% in January 2023, dipped to 29.5% in May, and hovered around 31% towards the end, reaching 31.6% in January 2024.
- In South Africa, Samsung led among brands, starting the year at 33.91% and ending at 31.03% in December, with a further drop to 30.63% in January 2024.
- Asian markets saw a more noticeable decline. Starting at 22.95% in January 2023, the share decreased each month, reaching a low of 18.78% by January 2024.
- In 2023, Samsung smartphone market shares in North America were January (28.82%), February (29.4%), March (29.41%), April (27.02%), May (25.2%), June (26.94%), July (26.87%), August (26.57%), September (26.78%), October (26.71%), November (24.91%), December (22.71%), and in January 2024 (23.1%).
- Monthly market share in Europe 2023 are Jan (31.45%), Feb (31.62%), Mar (31.93%), Apr (31.01%), May (29.5%), Jun (30.49%), Jul (30.92%), Aug (31%), Sep (30.34%), Oct (30.67%), Nov (31.25%), Dec (31.43%), and as of Jan 2024 (31.6%).
- South African Samsung smartphones accounted for the highest share among other brands in recent years. Per month market share of 2023 are Jan (33.91%), Feb (31.58%), Mar (33.67%), Apr (33%), May (31.99%), Jun (31.68%), Jul (32.68%), Aug (31.8%), Sep (31.96%), Oct (31.57%), Nov (31.43%), Dec (31.03%), and Jan in 2024 (30.63%).
- As of 2023, Samsung smartphone market share in Asia is Jan (22.95%), Feb (22.25%), Mar (22.56%), Apr (22.22%), May (21.91%), Jun (20.25%), Jul (19.37%), Aug (19.25%), Sep (19.29%), Oct (19.63%), Nov (19.81%), Dec (19.61%), and in Jan 2024 (18.78%).
Best Samsung Smartphone of 2023
(Source: sammobile.com)
- In the 3rd quarter of 2023, the best-selling foldable smartphone was Galaxy Z Flip 5, accounting for a market share of 45%.
- Meanwhile, in the same quarter, the market share of Galaxy Z Fold 5 was 24%.
- The sales of Samsung’s foldable smartphones will have decreased by 42% by the end of 2023.
By Demographics
 (Reference: statista.com)
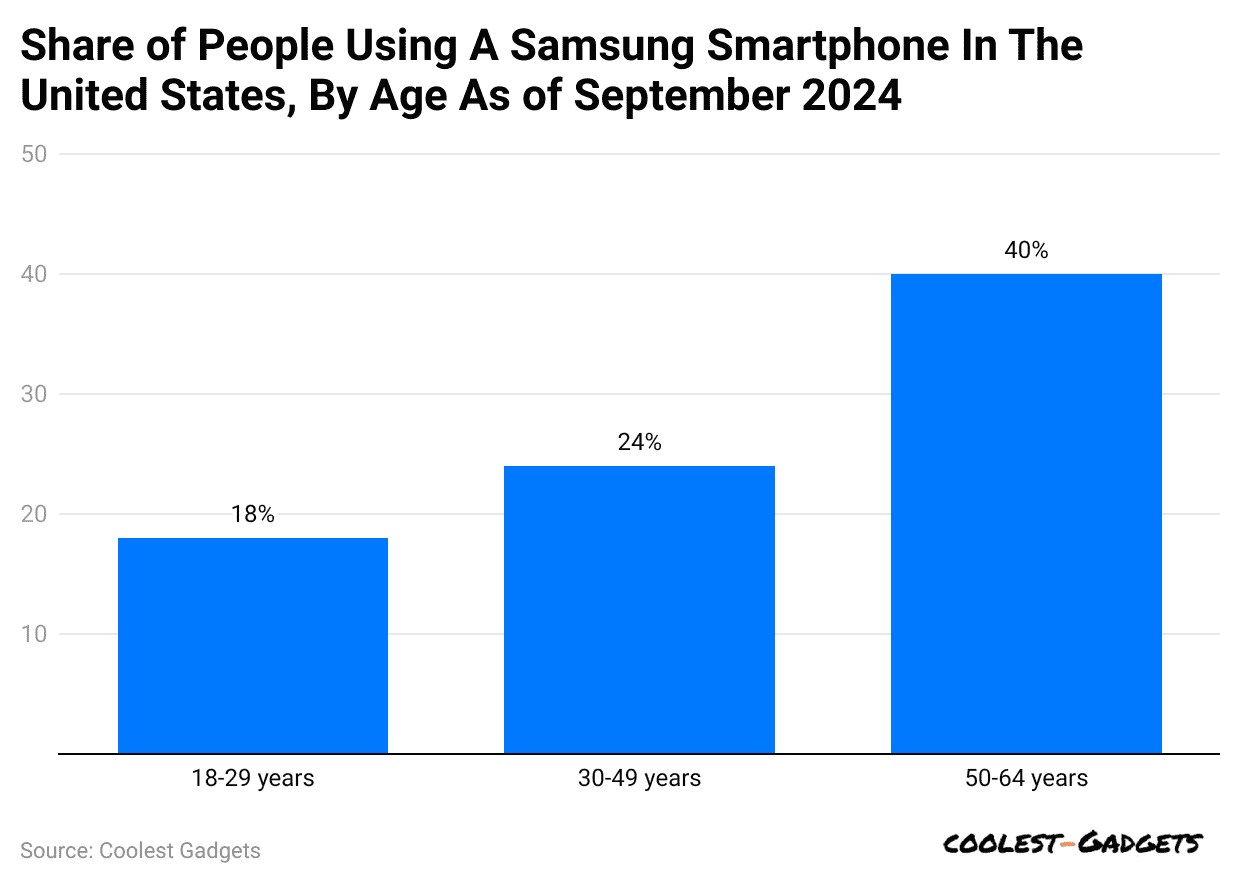
- As of September 2024, 18% of individuals aged 18 to 29 in the United States use Samsung smartphones, while 34% of those aged 30 to 49 are users.
- Samsung Statistics stated that 40% of Samsung users were aged between 50 and 64.
(Reference: statista.com)
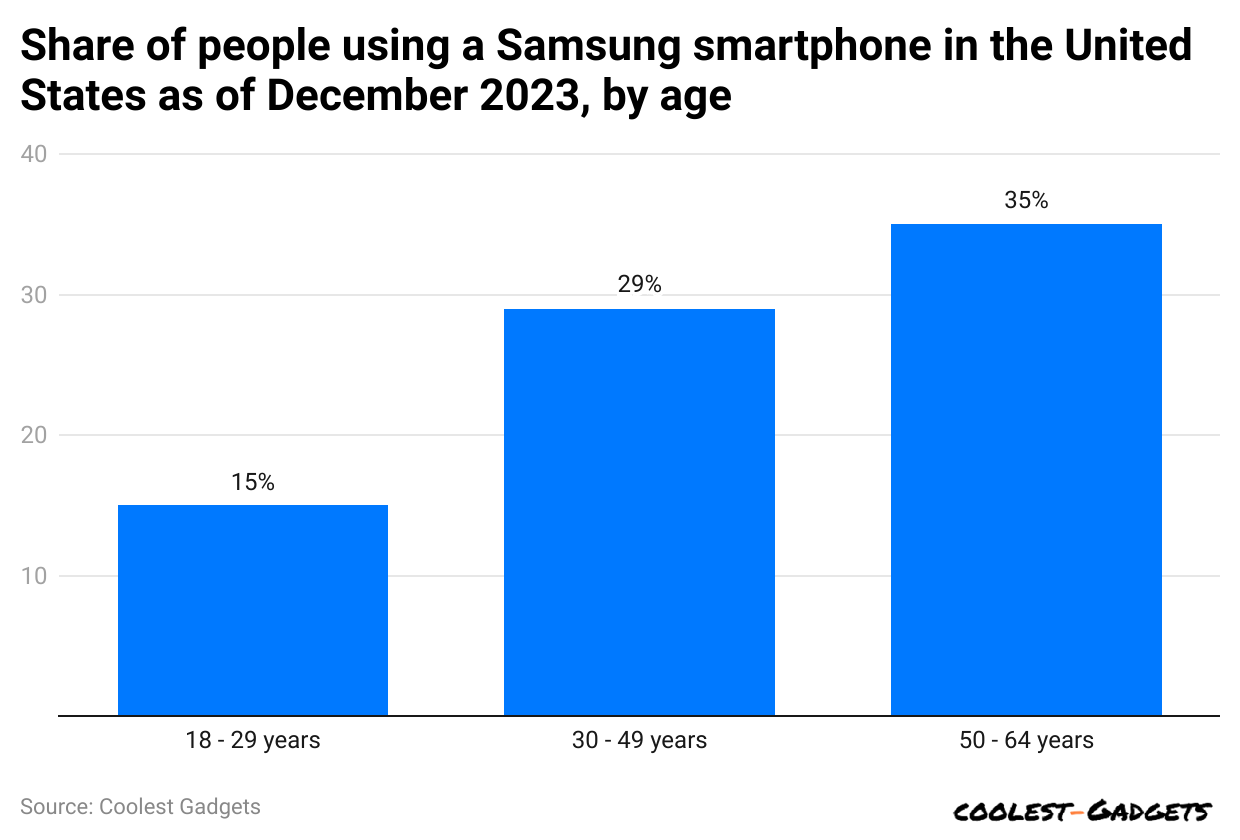
- A report published by Statista states that, as of December 2023, around 35% of people in the United States of America were maximum users of Samsung smartphones aged between 50 and 64 years.
- Other Samsung smartphone usage shares of people in the U.S. are 29% (30 to 49 years) and 15% (18 to 29 years).
(Reference: statista.com)
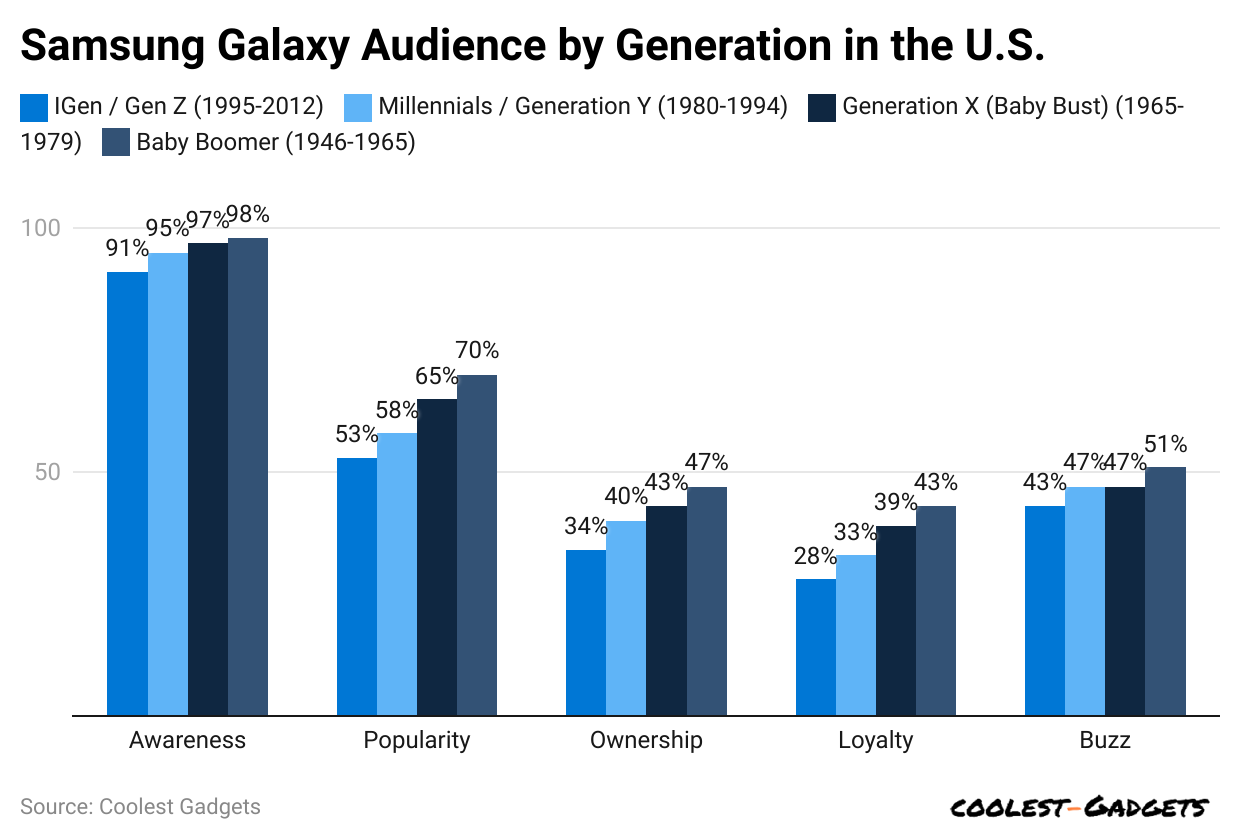
- In the United States of America, Baby Boomers account for 98% of Samsung Galaxy smartphone awareness in 2023.
- Other generations that share awareness are Gen X (97%), Millennials (95%), and Gen Z (91%).
- The popularity statistics of Samsung Galaxy are Baby Boomers (70%), Gen X (65%), Millennials (58%), and Gen Z (53%).
- Owners of Samsung Galaxy are Baby Boomers (43%), Gen X (39%), Millennials (33%), and Gen Z (28%).
- Samsung Galaxy’s loyal customers are Baby Boomers (43%), Gen X (39%), Millennials (33%), and Gen Z (28%).
Samsung Tablets Statistics
By Market Share
(Reference: statcounter.com)
- In the 1st quarter of 2024, Samsung’s global market will reach 26.88% share, which has declined by 0.82% from last quarter.
 (Source: statcounter.com)
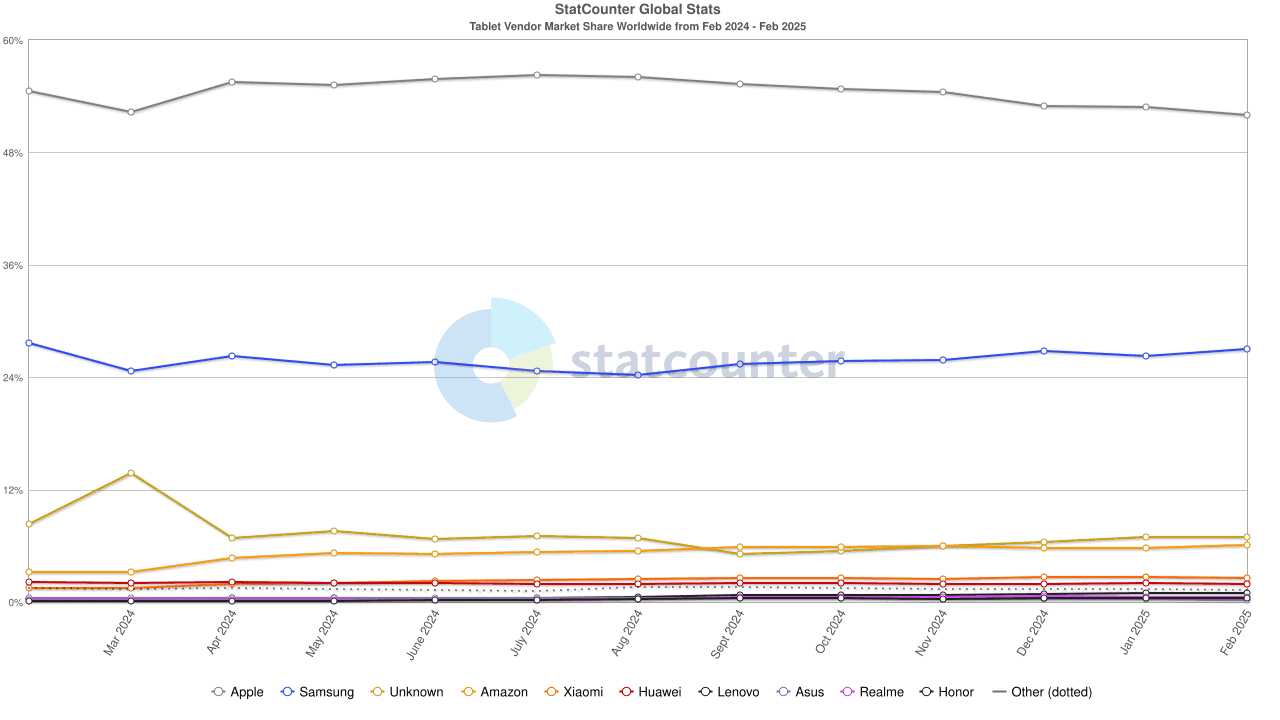
- As of February 2025, Samsung’s global tablet market share stood at 26.95%, positioning it as the second-largest tablet vendor worldwide.
- According to a survey conducted by StatCounter, Samsung tablets secured the second-most significant market share globally from January 2023 to 2024.
- As of 2023, the worldwide monthly market share is as follows: January (29.65%), February (31.21%), March (29.64%), April (27.42%), May (27.2%), June (29.5%), July (28%), August (27.71%), September (27.93%), October (28.24%), November (27.68%), and December (27.17%).
- By the end of January 2024, the Samsung tablets market will have a 26.61% share.
- During the same period, region Samsung tablet market shares in North America (17.61%), Africa (57.72%), Asia (59.65%), Europe (34.2%), Oceania (18.76%), and South America (49.54%).
By Shipment
- In the fourth quarter of 2024, Samsung shipped 7 million tablets, up from 6.8 million in the same quarter the previous year.
- For the entire year of 2024, global tablet shipments totaled 147.6 million units.
(Reference: business2community.com)
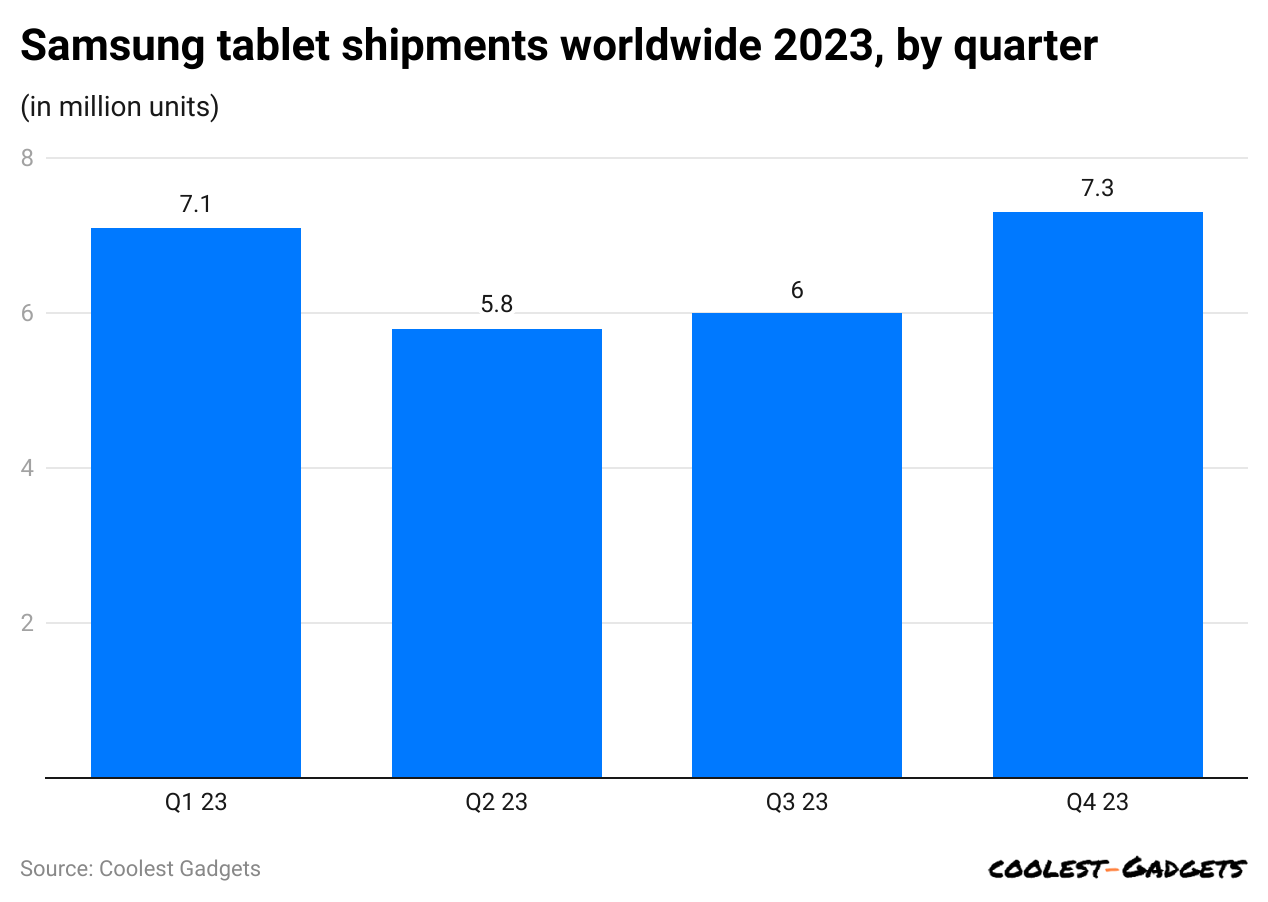
- Total shipment of Samsung tablets decreased in 2023, resulting in Q1 (7.1 million units), and Q2 (5.8 million units)
- In the 4th quarter of 2023, worldwide shipment accounted for 7.3 million units.
By Demographics
- In the United States, 39% of people aged between 18 and 29 will own a Samsung tablet by the end of 2023.
- The share of other users of Samsung tablets by age group in the U.S. is 55% (30 to 49 years) and 48% (50 to 64 years).
By Segments
- Samsung’s revenue streams are primarily divided into four segments: Samsung Communication, Samsung Consumer Electronics, Samsung Semiconductors, and Samsung Display Panels.
- Samsung have sold out 1.01 million units of the OLED TV lineup by 2023, holding a market share of 22.7%, and it is expected to account for more in 2024.
- In the United States, only 23% of Samsung refrigerators were sold in 2023
- Overall, wearable shipments done by Samsung in the 3rd quarter of 2023 resulted in 10.7 million, which holds a market share of 7.2%.
- The year-over-year growth rate of total shipments has decreased by 9.1%.
- In 2023, the company’s capital expenditure reached around KRW 53.1 trillion, including the Device Solutions Division (KRW 48.4 trillion) and Samsung Display Corporation (KRW 2.4 trillion).
- Based on semiconductors, Samsung took over 3rd place due to revenue growth of 8% in the Q2 of 2023.
- Simultaneously, Samsung Foundry’s market share dipped up to 11%.
- Samsung MX’s operating profit in Q2 of 2023 was KRW 3.3 trillion ($2.44 billion).
- In Q3 of 2023, the market share of global TV increased to 30%, showing potential growth for the 18th consecutive year.
- Over the years from 2011 to 2021, these segments have shown varying trends in revenue generation.
- Samsung Semiconductors consistently grew, reaching its peak revenue of USD 79.36 Billion in 2021, up from USD 32.51 Billion in 2011.
- The Samsung Communication segment also saw an increase, starting at USD 46.95 Billion in 2011 and rising to USD 88.24B in 2021, with its highest revenue of USD 117.53 Billion in 2013.
- Samsung Consumer Electronics had fluctuations in its revenue, with the highest in 2011 at USD 52.29 Billion and reaching USD 47.06 Billion in 2021.
- Revenue from Samsung Display Panels was relatively stable, with a minor peak of USD 30.30 Billion in 2017.
- These segments collectively contribute to Samsung’s significant presence and impact on the global market across various industries.
| Year | Communication
(USD) |
Consumer el.
(USD) |
Semiconductors
(USD) |
Display Panels
(USD) |
|---|---|---|---|---|
| 2011 | 46.95 B | 52.29 B | 32.51 B | 25.69 B |
| 2012 | 81.65 B | 42.51 B | 30.66 B | 29.01 B |
| 2013 | 117.53 B | 44.24 B | 32.91 B | 26.23 B |
| 2014 | 94.4 B | 44.11 B | 34.91 B | 22.61 B |
| 2015 | 88.39 B | 41.23 B | 41.83 B | 24.16 B |
| 2016 | 85.92 B | 41.35 B | 44.97 B | 23.68 B |
| 2017 | 91.08 B | 39.52 B | 65.26 B | 30.30 B |
| 2018 | 84.83 B | 36.97 B | 75.84 B | 28.54 B |
| 2019 | 87.32 B | 38.35 B | 55.36 B | 26.43 B |
| 2020 | 82.95 B | 41.83 B | 64.02B | 26.63 B |
| 2021 | 88.24 B | 47.06 B | 79.36B | 26.75 B |
- Samsung shipped 54 million smartphones in the second quarter of 2024, showing a decrease from the previous quarter and the same period last year.
- Despite this drop, Samsung remains one of the top three smartphone sellers globally, along with Apple and Xiaomi.
- These three companies together hold more than 50% of the market, dominating the smartphone industry.
- Global smartphone sales totaled 1.2 billion units in 2023, slightly lower than in 2022, mainly due to economic challenges.
- Xiaomi has been increasing its market share, especially since Huawei’s sales have dropped.
Net Worth of Samsung Company
- Samsung’s net worth was valued at USD 276.45 billion at the end of the first quarter of 2024.
- This reflects a decrease of 1.67% from the end of 2023.
- In 2023, the net worth was nearly unchanged from 2022, showing a minor reduction of 0.07%.
- The company’s net worth in 2022 stood at USD 281.35 billion, marking a growth of 9.8%.
- Since 2005, the value began at USD 41.54 billion and increased significantly over the years.
- Notable growth was observed in several years, such as a 33.22% increase in 2012 and a 25.69% increase in 2017.
- The highest value before 2024 was in 2022.
- There have been fluctuations over the years, such as a 16.17% drop in 2008.
| Date | Net Worth (in Billion USD) | Change |
|---|---|---|
| 2005 | 41.54 | / |
| 2006 | 52.26 | 25.81% |
| 2007 | 60.42 | 15.61% |
| 2008 | 50.65 | -16.17% |
| 2009 | 63.45 | 25.27% |
| 2010 | 79.27 | 24.93% |
| 2011 | 87.84 | 10.81% |
| 2012 | 117.02 | 33.22% |
| 2013 | 142.28 | 21.59% |
| 2014 | 153.46 | 7.86% |
| 2015 | 152.33 | -0.74% |
| 2016 | 160.07 | 5.08% |
| 2017 | 201.19 | 25.69% |
| 2018 | 221.94 | 10.31% |
| 2019 | 227.33 | 2.43% |
| 2020 | 253.99 | 11.73% |
| 2021 | 256.24 | 0.89% |
| 2022 | 281.35 | 9.8% |
| 2023 | 281.15 | -0.07% |
| Q1 2024 | 276.45 | -1.67% |
By Samsung Employees
- Samsung Statistics in 2023 elaborated that Samsung employed over 287,000 individuals worldwide, with approximately two-thirds working outside South Korea.
- As of September 30, 2024, Samsung Electronics reported a total of 267,860 employees.
- Despite previous reductions, Samsung plans to hire over 10,000 employees by 2025.
- Samsung Electronics has significantly reduced its workforce by nearly 50% in the last two years.
The Number of Samsung Employees
| Year | Number of Employees |
| 2009 | 157,700 |
| 2010 | 190,460 |
| 2011 | 221,730 |
| 2012 | 235,870 |
| 2013 | 95,798 |
| 2014 | 319,210 |
| 2015 | 325,680 |
| 2016 | 308,750 |
| 2017 | 320,670 |
| 2018 | 309,630 |
| 2019 | 278,000 |
| 2020 | 267,937 |
| 2021 | 266,673 |
| 2022 | 113,604 |
| 2023 | 113,604 |
You May Also Like To Read
- Apple Customer Loyalty Statistics
- Apple Smartphone Statistics
- Apple MacBook Statistics
- Google Smartphone Statistics
- (Advanced Micro Devices) AMD Statistics
- Xiaomi Smartphone Statistics
By Website Traffic
By Country
(Source: similarweb.com)
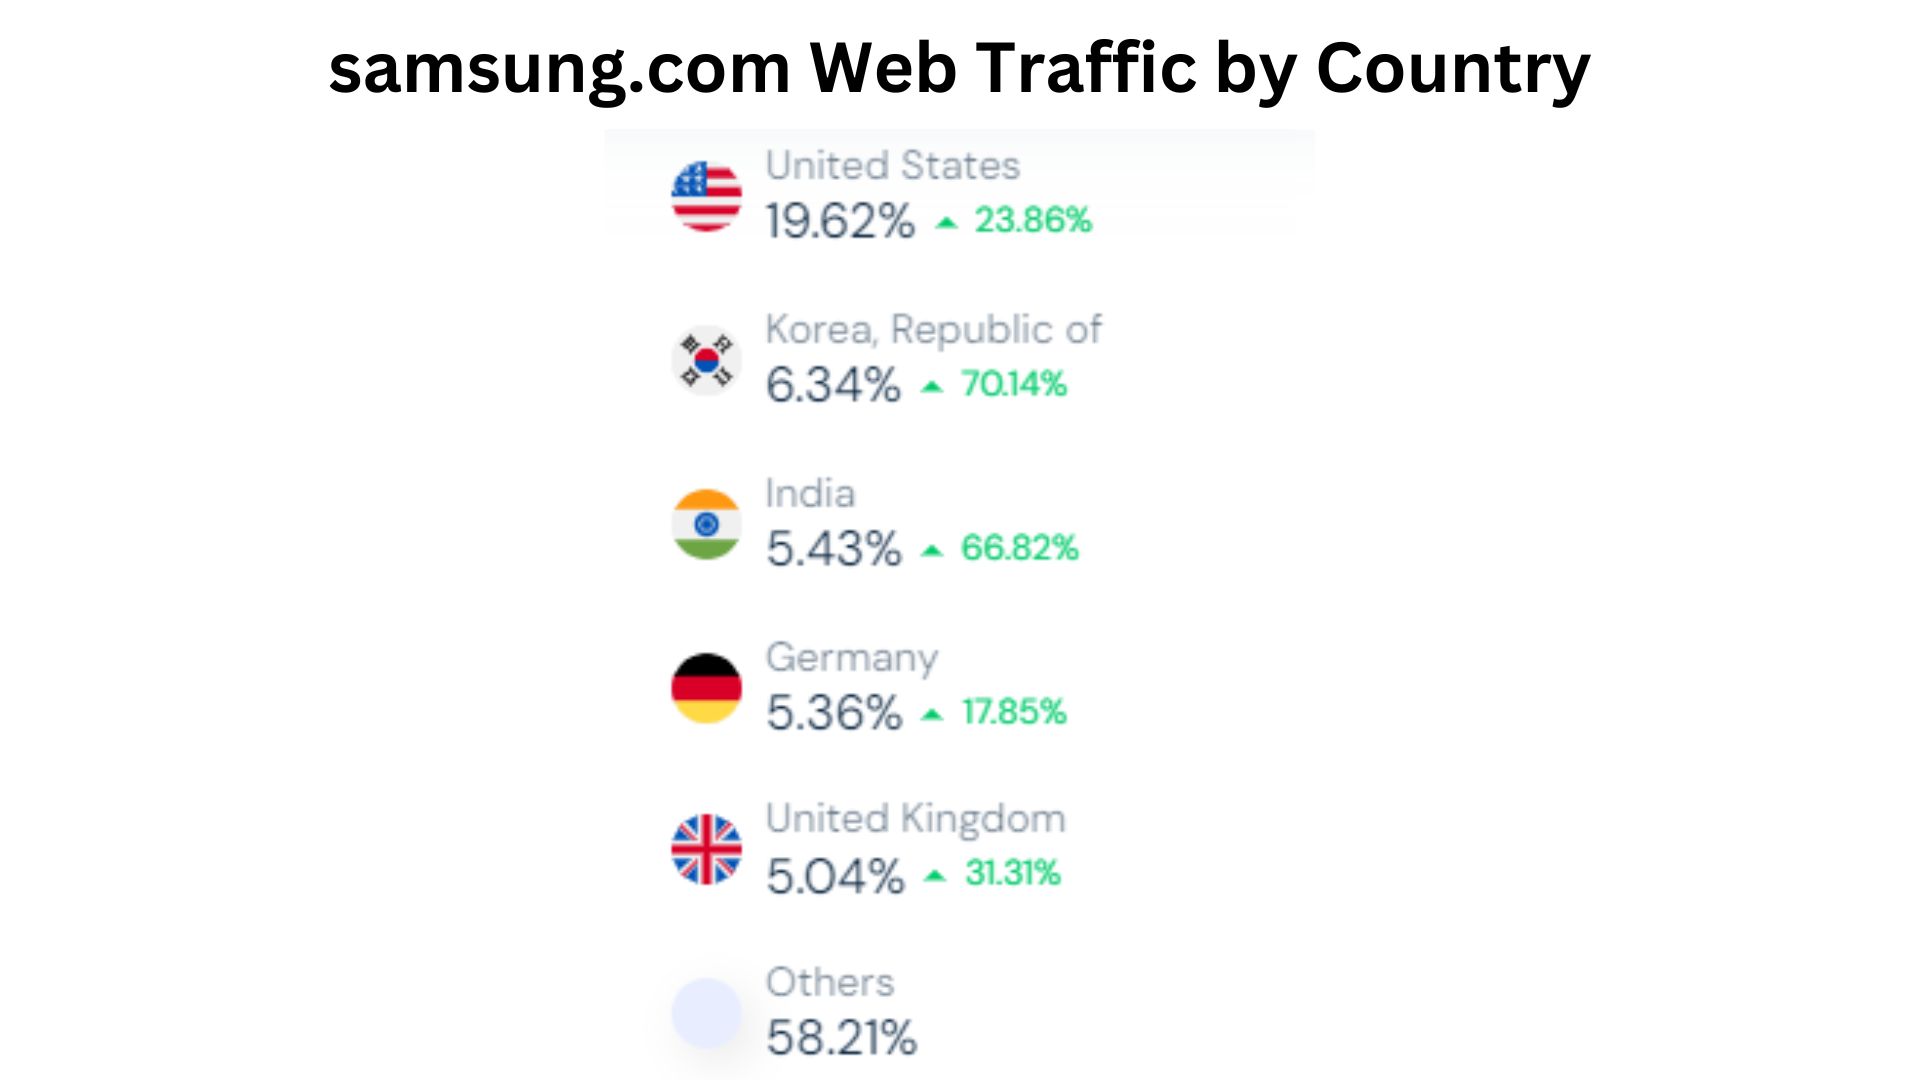
- The United States of America had 19.62% of total traffic on samsung.com, but it recorded an increase in total website visitors by 23.86% in January 2024.
- Other countries recorded the following contribution in total traffic are Korea, the Republic of = 6.34% (+70.14%), India = 5.43% (+66.82%), India = 5.43% (+17.85%), and the United Kingdom = 5.04% (31.31%)
- Other countries collectively made around 58.21% of visitor share in Samsung.com.
By Device
(Reference: semrush.com)
- Worldwide, 88.94% belong to mobile Samsung users, and 11.06% belong to desktop
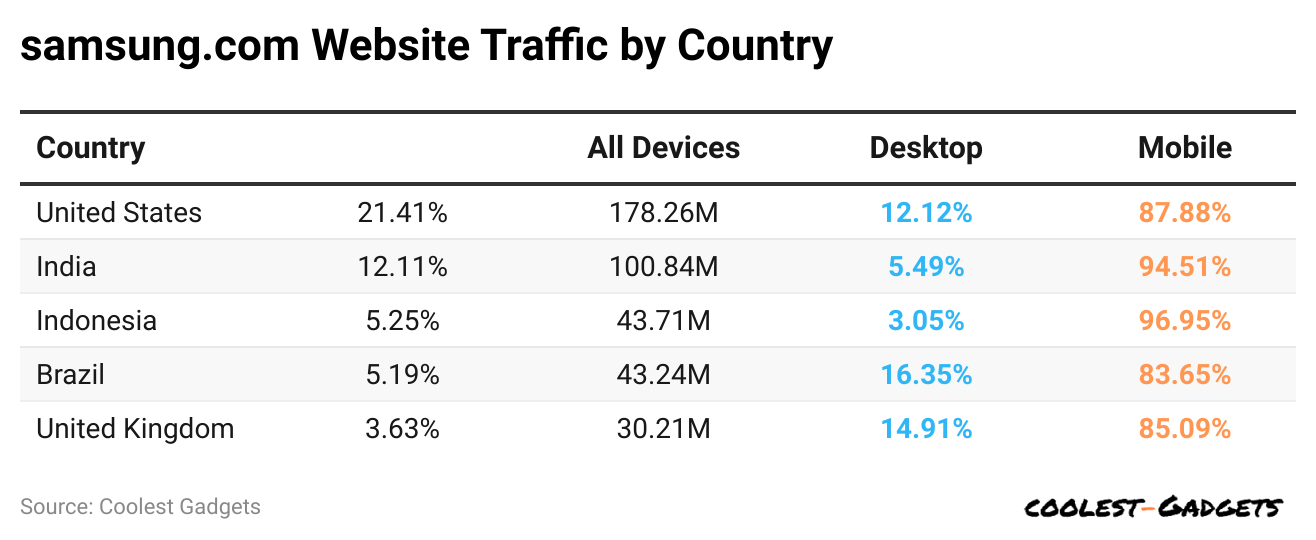
- 41% of total Samsung users belong to the United States, resulting in 178.26 million; out of these, 12.12% are desktop users, and 87.88% are mobile users.
- India has 100.84 million users, resulting in 12.11% out of these, 5.49% belonging to desDesktopd 94.51% on mobile devices.
- Of the total players, 5.25% are from Indonesia, resulting in 43.71 million, with 3.05% access to the desktop version and 96.95% to mobile devices.
- Brazil and the United Kingdom have around 43.24 million and 30.21 million users, respectively, resulting in 5.19% and 3.63%, respectively.
- Of these, 16.35% of desDesKtopd 83.65% of mobile users are in Brazil, while in the United Kingdom, 14.91% access the website on desktops, 85.09% via mobile.
By Demographics
(Reference: similarweb.com)
- As of January 2023, the maximum number of male users is 59.78%, and females hold a 40.22% share.
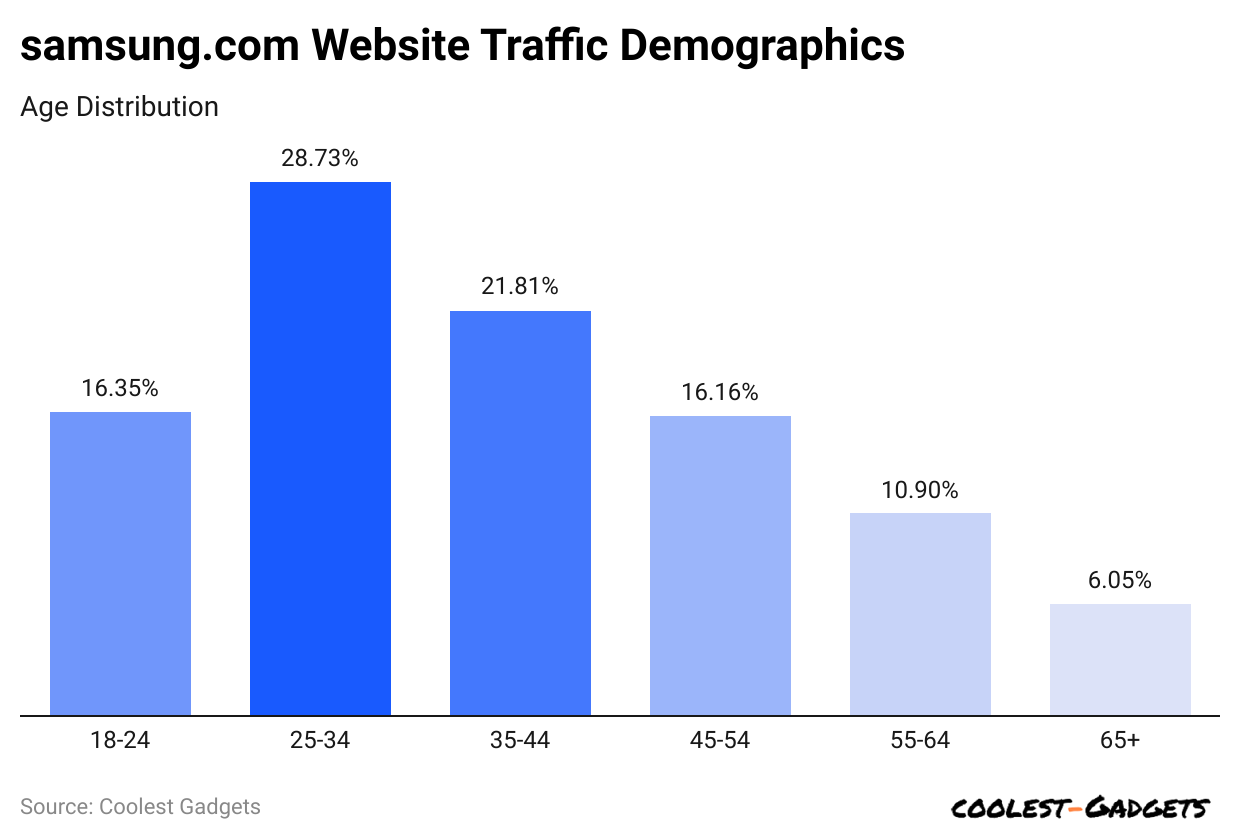
- Samsung Statistics by demographic states that the highest number of website users observed is between 25 and 34 years old, resulting in 28.73%.
- Of the users, 21.81% are aged 35 years and 44 years.
- 35% and 16.16% belong to 18 to 24 years and 45 to 54 years respectively.
- 9% of website users are aged 55 to 64 years.
- Around 6.05% of user shares contributed from the age group of 65 years.
By Traffic Source
(Reference: similarweb.com)
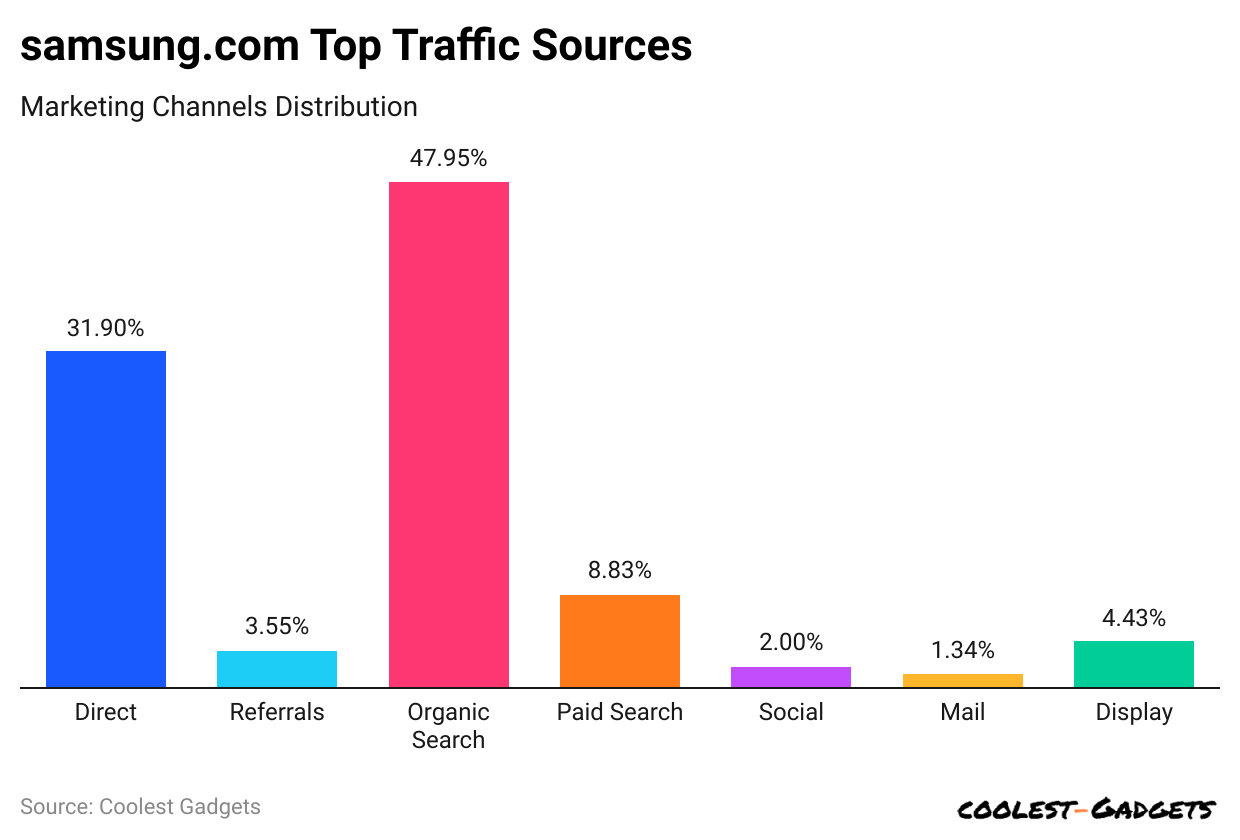
- As per Samsung statistics, the highest traffic rate towards samsung.com is by organic search, resulting in 47.95%.
- 9% is direct traffic, while 8.83% is from paid search from the website.
- Furthermore, other traffic sources towards samsung.com are display (4.43%), referral (3.55%), social (2%), and mail (1.34%).
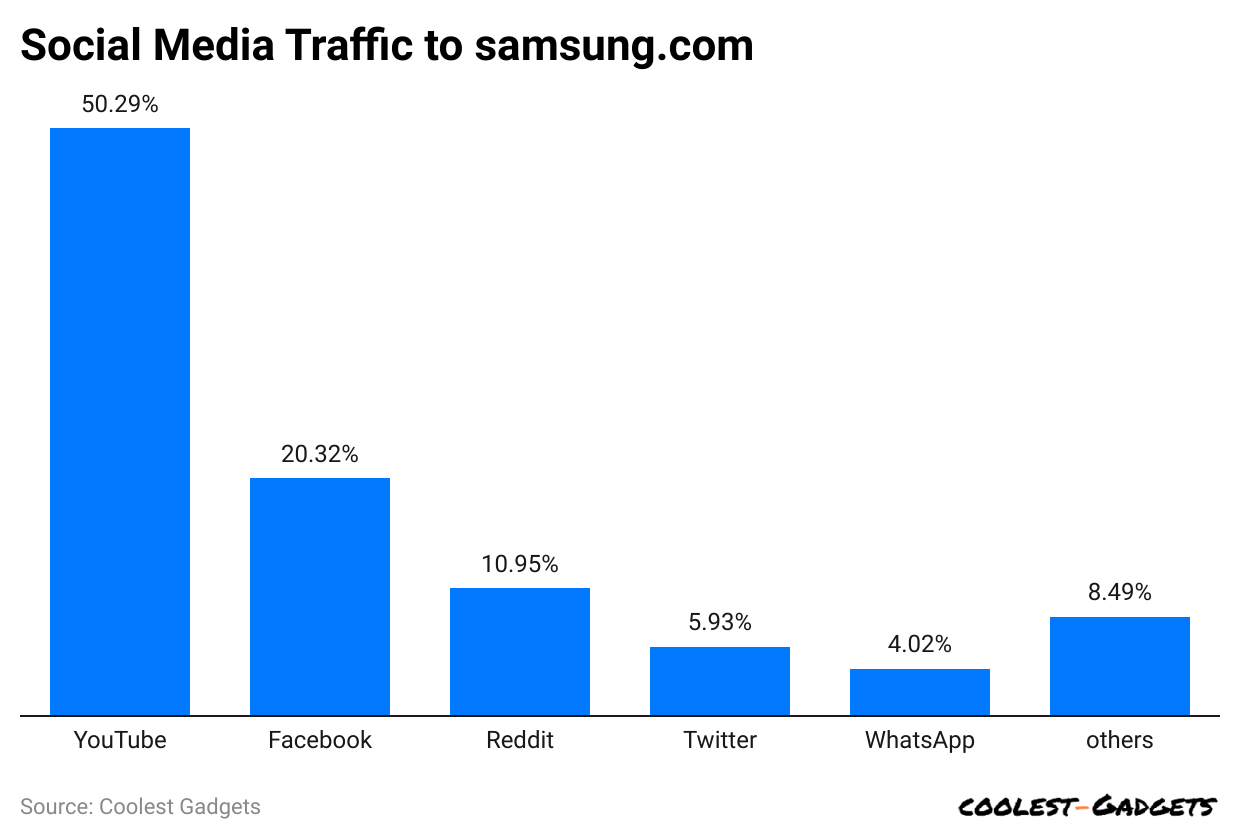
By Social Media Referral Rate
(Reference: similarweb.com)
- YouTube has the highest social media referral rate, resulting in 50.29% than other social networks.
- Facebook and Reddit contribute by 20.32% and 10.95% respectively.
- Traffic sent by Twitter is 5.93%, and WhatsApp contributes 4.02%.
- Other social media networks have a nominal contribution, collectively around 8.49%.
Samsung Life Insurance Statistics
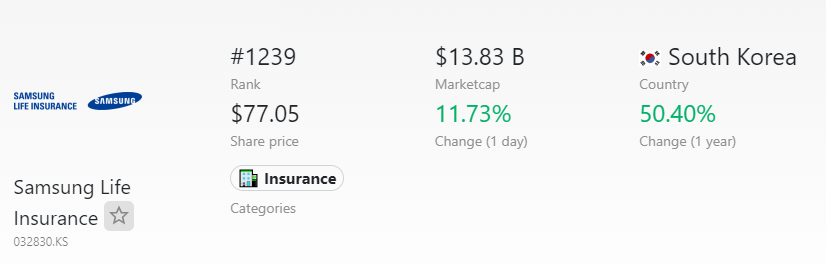
(Source: companiesmarketcap.com)
- Samsung Life Insurance ranked 1239th and is expected to make a market capitalization of USD 13.83 billion with a 44.37% change in February 2024.
- In 2023, the total market cap was $9.58 billion, which has decreased by 4.65%
- The market cap has started increasing again since 2024, on 13 January (USD 8.65 billion) and 3 February (USD 11.19 billion).
- Annual earnings turned out to be USD 3.16 billion in 2023, with an increment of 32.95% from the previous year.
- According to the latest financial report, the company’s revenue was USD 18.49 billion during the same period.
The Most Valuable Electronic Brand
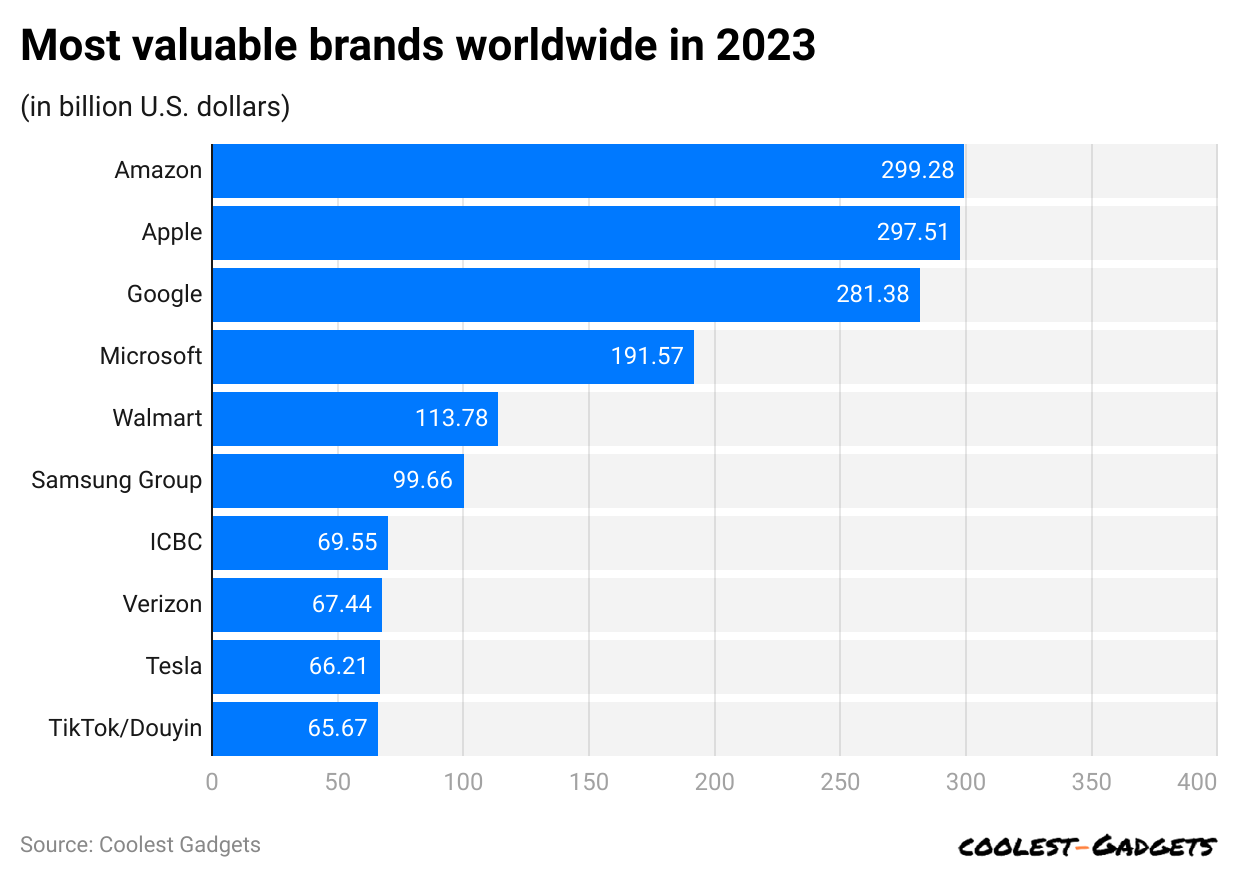
(Reference: statista.com)
- In 2023, Samsung Group ranked 6th best valuable brand worldwide, worth USD 99.66 billion.
- The top-ranked brand was Amazon, with a USD 299.28 billion brand valuation. In contrast, other brand valuations are followed by Apple (USD 297.51 billion), Google (USD 297.51 billion), Microsoft (USD 191.57 billion), Walmart (USD 1133.78 billion), ICBC (USD 69.55 billion), Verizon (USD 67.44 billion), Tesla (USD 66.21 billion), and TikTok/Duoyin (USD 65.67 billion).
Samsung’s Involvement with the Olympics
- Samsung began sponsoring the Olympics in 1988, starting with the Seoul Olympic Games.
- By 1998, during the Nagano Winter Olympics, Samsung became a Worldwide Olympic Partner, specializing in wireless communications equipment.
- Their sponsorship has grown to include other IT products like tablets, laptops, personal computers, and printers by the 2022 Beijing Winter Olympics.
- In 2022, Samsung also supported the Olympics with the Team Samsung Galaxy athletes, a Virtual Media Center, and the #CheerTogether campaign.
- Every athlete at the 2022 Olympics and Paralympics received a special Olympic-edition Galaxy Z Flip3 5G, a foldable smartphone with essential apps for the participants.
- Samsung has committed to continue its Olympic sponsorship with a USD 50 million contract extension, ensuring its presence as a top sponsor until the 2028 Los Angeles Games.
Conclusion
After completing the paper, Samsung includes different product lines, but in recent days, the company has been the leading brand for smartphones, including high-end specifications and advanced features. The company has evolved extensively in the technical world with its latest innovations and products.
There are many Samsung rival companies, but the main competitor is Apple. This article has covered all possible current statistical analyses, such as the company and its products. All this information will help you understand the topic better.
Sources
Joseph D'Souza started Coolest Gadgets in 2005 to share his love for tech gadgets. It has since become a popular tech blog, famous for detailed gadget's reviews and companies statistics. Joseph is committed to providing clear, well-researched content, making tech easy to understand for everyone. Coolest Gadgets is a trusted source for tech news, loved by both tech fans and beginners.