Huawei Statistics By Revenue, Business Segment, Smartwatch, Tablet Market and Facts

Updated · Mar 13, 2025


TABLE OF CONTENTS
- Introduction
- Editor’s Choice
- Facts About Huawei
- General Huawei Statistics
- China Huawei Mobile Market Share
- India Huawei Mobile Market Share
- Latin America Huawei Market Share
- Huawei Mobile Statistics by Country
- Huawei’s Revenue By Geographical Region
- Huawei Phone Statistics by Region
- Huawei Statistics by Tablet Market
- Huawei Statistics by Smartwatch
- Telecom Equipment Market Analysis
- Huawei Country Patent Statistics
- Leading 5G Patent Technology
- Huawei Statistics by Operating System
- Huawei Statistics by Business Segment
- The Website Traffic of Huawei Statistics
- The Best Huawei Phones to Buy in 2024
- Huawei’s Statistics by Career Market
- Conclusion
Introduction
Huawei Statistics: Huawei is one of the world’s largest technology companies, known for its smartphones, telecommunications equipment, and cloud services. It has a strong global presence, with operations in many countries. Huawei has grown financially over the years and increased its market share in different industries. The company spends a lot on research, especially in 5G, artificial intelligence, and smart devices.
Even with challenges like trade restrictions, it continues to develop and succeed. Its financial reports show stable income and progress. With millions of users worldwide, Huawei stays strong in the tech industry, competing with top brands through innovation and smart partnerships.
Editor’s Choice
- Huawei Statistics of 2024 shows that the company’s annual revenue surpassed 860 billion yuan (approximately USD 118.27 billion), marking a 22% increase from the previous year.
- In the first half of 2024, Huawei reported revenues of 417.5 billion yuan, reflecting a 34.3% year-on-year growth, with a net profit margin of 13.2%.
- Huawei reclaimed the top position in China’s smartphone market, capturing an 18.1% market share in the fourth quarter of 2024.
- The company invested USD 22.1 billion in R&D, accounting for 22.4% of its net sales.
- For the seventh consecutive year, Huawei led in international patent applications under the Patent Cooperation Treaty, with 6,494 published applications in 2023.
- Huawei maintained its leadership in 5G technology, building approximately 70% of worldwide 5G base stations.
- By June 2024, Huawei’s HarmonyOS was installed on over 900 million devices, becoming the second most popular mobile operating system in China.
- In the first quarter of 2024, Huawei’s profits increased nearly six-fold compared to the previous year, reaching just under USD 2.7 billion.
- In 2023, Huawei manufactured 58% of all 5G base stations in China.
- Huawei’s revenue from smartphone sales reached USD 98.5 billion in 2023, marking a 9% increase from the previous year.
- As of the fourth quarter of 2023, Huawei holds a 7.6% share in global tablet shipments and a 17% share in smartphone shipments.
- By the end of October 2023, Huawei’s market share in smartphone shipments had surged to 83%.
- The age demographic of 30% of Huawei users falls between 24 and 29 years old.
- Huawei’s app store ranks as the world’s third-largest, with approximately 421.8 million monthly active users.
- Huawei employed 197,000 people as of the latest reports.
- In 2023, Huawei was the leading smartphone vendor in China with a 23.22% share, although this was down 10.24% from the previous year.
- Desktop and mobile users of Huawei.com consist of 16.98% and 83.02%, respectively, as of 2023.
- In July 2023, Huawei ranked as the sixth largest smartphone manufacturer globally, capturing a market share of 4%.
- Huawei’s financial and ownership structure reveals it is not shareholder-owned but controlled by its employees, with 98.99% of shares held by the Trade Union Committee of Huawei and over 121,000 participating employees.
- The Middle East and Africa were significant overseas markets for Huawei in 2023, generating over 145 billion yuan in revenue.
- Huawei has consistently broken its own revenue records every year since 2007, driven by its three core business segments: carrier network, enterprise, and consumer business, with the carrier network being the most lucrative.
- Internationally, Huawei was recognized as a leader in 5G technology, having filed the most 5G patents globally and manufactured 60% of China’s 5G base stations, despite facing international challenges due to its ownership structure and alleged ties to China’s communist party.
- In 2023, Huawei’s revenue in China was approximately 471 billion yuan.
You May Also Like To Read
- Anker Statistics
- Sennheiser Statistics
- Seagate Statistics
- Razer Statistics
- Motorola Statistics
- Samsung Statistics
- Garmin Statistics
- Panasonic Statistics
- LG Statistics
- Oppo Statistics
- iPhone Statistics
Facts About Huawei
- In 2024, Huawei is recognized as China’s second-leading smartphone brand with a market share of 22.68%.
- Huawei Technologies Co. plans to invest approximately USD 100 billion in research from 2022 to 2026.
- The company’s newest slogan is “Building a Fully Connected, Intelligent World.”
- Huawei operated in over 170 countries and regions in 2023.
- Huawei’s AppGallery, the company’s app store, has over 580 million active monthly users.
- The Mate 60 Pro helped Huawei become the No.1 Chinese mobile brand.
- Huawei’s market share in China grew from 10% in the first quarter to 14% in the third quarter of 2023.
- In March 2024, Huawei was named the “Top Employer” for the fifth consecutive year in Europe.
- In 2023, Huawei invested CNY 164.7 billion (approximately USD 23.2 billion) in research and development, representing 23.4% of its annual revenue.
- Over the past decade, Huawei’s total R&D investment reached CNY 1.11 trillion (approximately USD 156.8 billion).
- By the end of 2023, Huawei held over 140,000 active patents and had signed more than 200 patent licensing and cross-license agreements.
- Huawei is ranked as the world’s 8th most innovative company by the Boston Consulting Group (BCG).
- In the 2023 EU Industrial R&D Investment Scoreboard, Huawei ranked 5th.
General Huawei Statistics
- In 2023, Huawei played a major role in 5G development, producing 58% of all 5G base stations in China.
- The company’s smartphone business performed well, generating USD 98.5 billion in revenue, a 9% increase from 2022.
- By the fourth quarter of 2023, Huawei held 7.6% of the global tablet market and 17% of the smartphone market. Its smartphone shipments also grew significantly, reaching an 83% market share by the end of October.
- However, despite being the top smartphone brand in China with a 23.22% market share, this was still 10.24% lower than the previous year.
- Regarding website visitors, 83.02% accessed Huawei.com from mobile devices, while 16.98% used desktops.
- In July 2023, Huawei ranked as the world’s sixth-largest smartphone maker with a 4% market share.
- Instead, the Trade Union Committee controls 98.99% of the company’s shares, and over 121,000 employees participate in ownership.
- The Middle East and Africa were key international markets, generating over 145 billion yuan in revenue.
- In 2023, its revenue in China alone was around 471 billion yuan. Despite global challenges, Huawei led in 5G technology, manufacturing 60% of China’s 5G base stations and filing the most 5G patents worldwide.
- Revenue observed for the first three quarters of 2023 was USD 62.4 billion, an increase of 2.4% from last year.
- During the same period, Huawei shipped around 14.3 million smartphones in China, with an increase of 40%.
- In the 1st half of 2023, Huawei’s worldwide revenue was around CNY 310.9 billion (USD 42.9 billion), and its net profit margin rose by 15%.
- Huawei’s consumer revenue turned out to be USD 14.27 billion.
- Moreover, Huawei Statistics show that revenue generated by the Company’s other sectors is ICT infrastructure (USD 23.05 billion), Consumer (USD 14.3 billion), Cloud (USD 3.3 billion), Digital power (USD 3.3 billion), and Intelligent automotive solution (USD 137.8 million).
(Reference: businesswire.com)
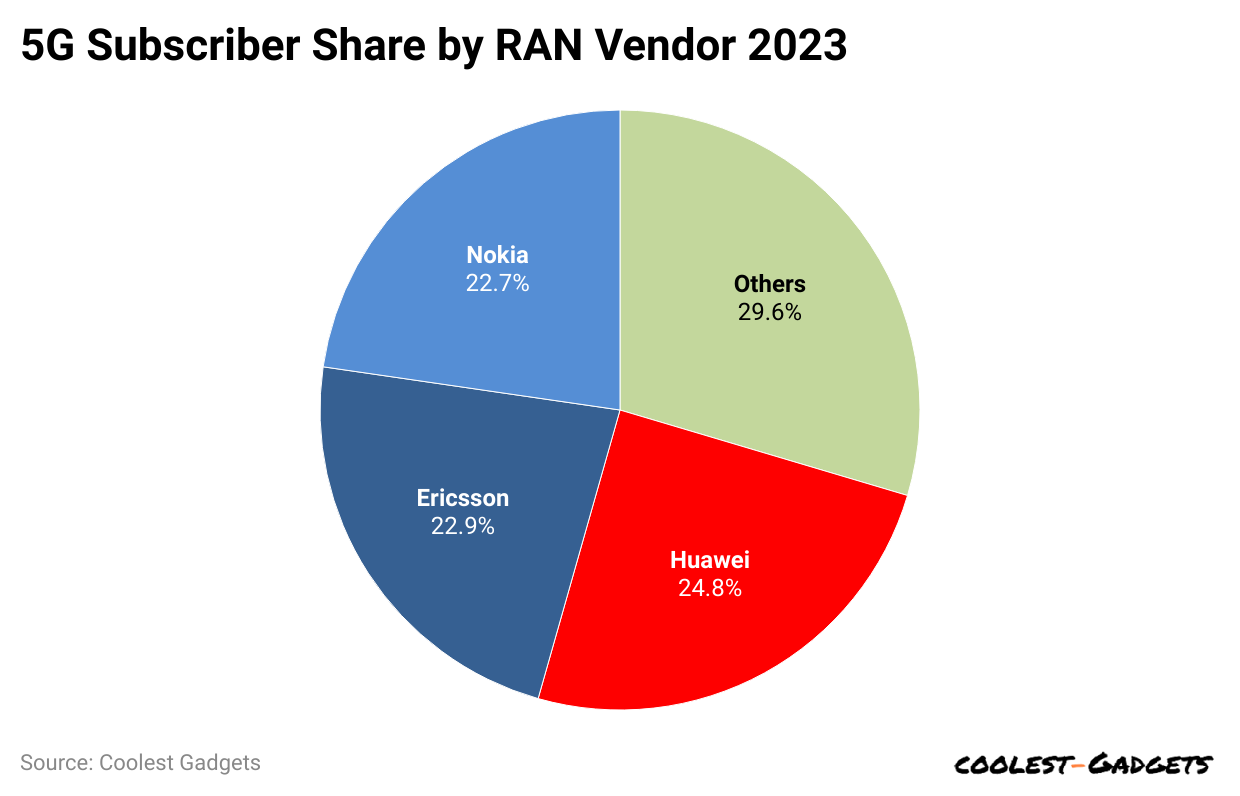
- Based on the RAN vendor, 5G subscriber share in 2023 is highest in Huawei with 24.8%; others are by Ericsson (22.9%), Nokia (22.7%), and others (29.6%).
- Henceforth, Huawei’s market share in Asia will decrease, resulting in a 3.71% share by March 2024.
- In the first three months of 2023, Huawei’s smartphone sales increased by 41% year over year.
- Huawei Statistics further stated that Huawei Mobile’s worldwide market share in February 2024 was 3.62%.
(Reference: bankmycell.com)
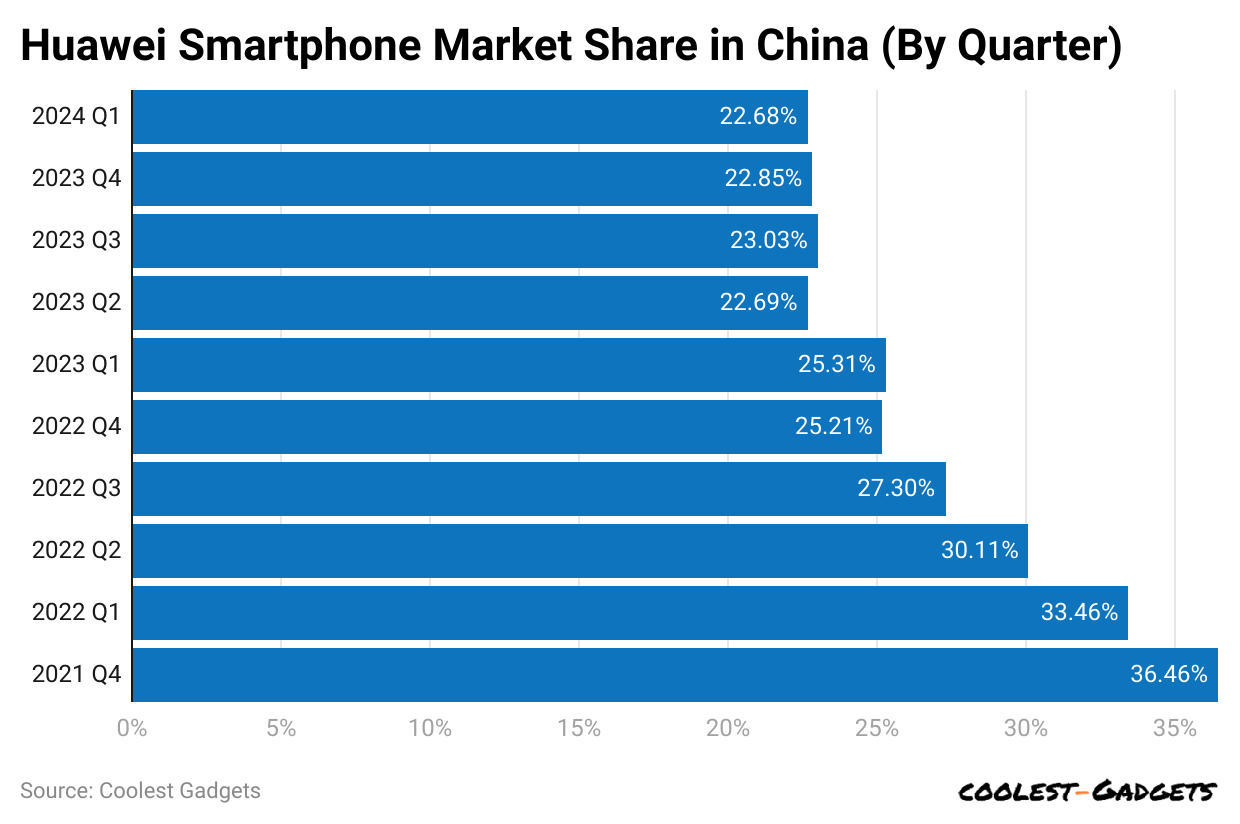
- In Q1 of 2023, Huawei’s smartphone market share in China resulted in 25.31%.
- Other quarterly market share are Q2 (22.69%), Q3 (23.03%), and Q4 (22.85%).
- Huawei’s market share is expected to be 22.68% in the first quarter of 2024, a slight decline of 2.63% from 2023.
- As of 2024, Huawei ranked second in the Chinese smartphone market, shipping 46.0 million units, reflecting a 37% year-on-year growth.
- Huawei’s smartphone shipments grew by over 50% in 2024.
- In 2024, the market grew by 4% year-over-year, reaching 151 million units shipped.
(Reference: bankmycell.com)
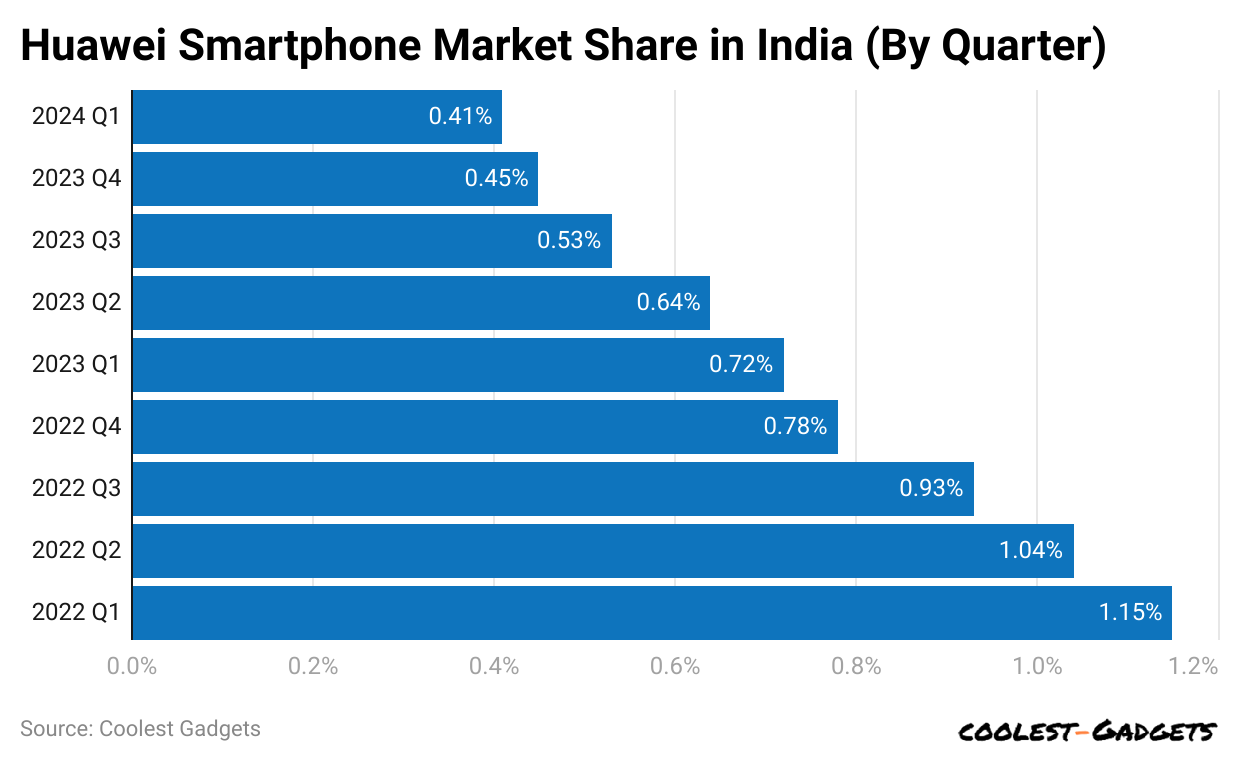
- In 2023, Huawei’s Indian smartphone market in the Q1 of 2023 has reduced to 0.72%
- In the following quarters, the market share went downward more, such as Q2 (0.64%), Q3 (0.53%), and Q4 (0.45%).
- It is predicted that the market share will increase to 0.41% by the first quarter of 2024.
- As of 2024, Huawei is known to be the 11th top smartphone manufacturer brand in India.
 (Reference: statista.com)
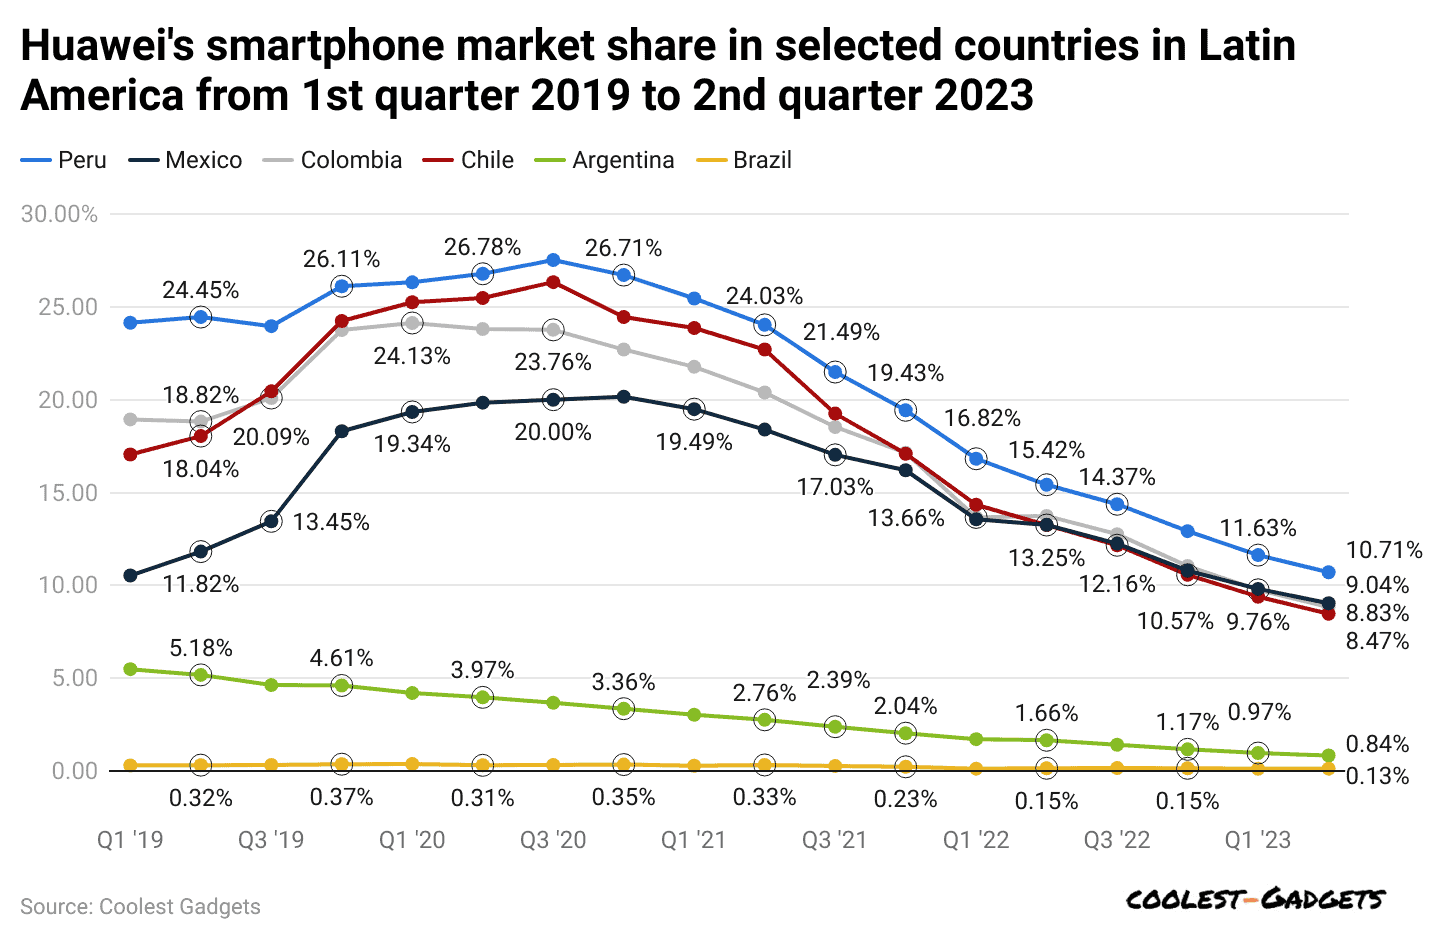
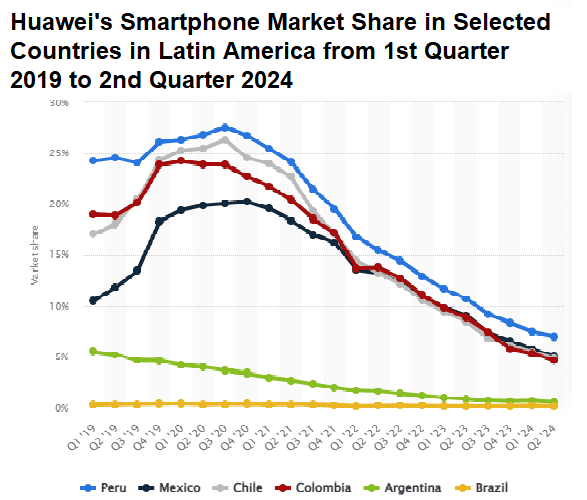
- In Latin America, Peru recorded the largest share of Huawei’s smartphone market in the 1st quarter of 2023 with 11.63%.
- Furthermore, market share by other countries of Latin America is followed by Mexico (9.81%), Colombia (9.76%), Chile (9.39%), Argentina (0.97%), and Brazil (0.12%).
- In the 2nd quarter of 2023, Peru (10.71), Mexico (9.04%), Colombia (8.83%), Chile (8.47%), Argentina (0.84%), and Brazil (0.13%).
Huawei Mobile Statistics by Country
 (Source: statista.com)
- In the second quarter of 2024, Huawei’s smartphone market share in Latin American countries was 7.04%, followed by Peru (5.05%), Mexico (5.05%), Chile (4.88%), Colombia (4.63%), Argentina (0.51%), and Brazil (0.09%).
- In February 2024, the United States of America had 0.41% of Huawei Mobile’s market share Huawei Mobile’s market share.
- Moreover other countries market shares are the United Kingdom (2.13%), Canada (0.88%), Germany (3.78%), Australia (0.92%), Belgium (2.64%), China (20.88%), Denmark (2.35%), Egypt (9.72%), France (4.35%), Hong Kong (3.77%), Indonesia (0.28%), Italy (4.825), Japan (1.89%), Mexico (5.75%), Netherlands (1.9%), New Zealand (2.19%), North Korea (10.43%), Norway (2.33%), South Africa (14.35%), and Switzerland (2.4%).
Huawei’s Revenue By Geographical Region
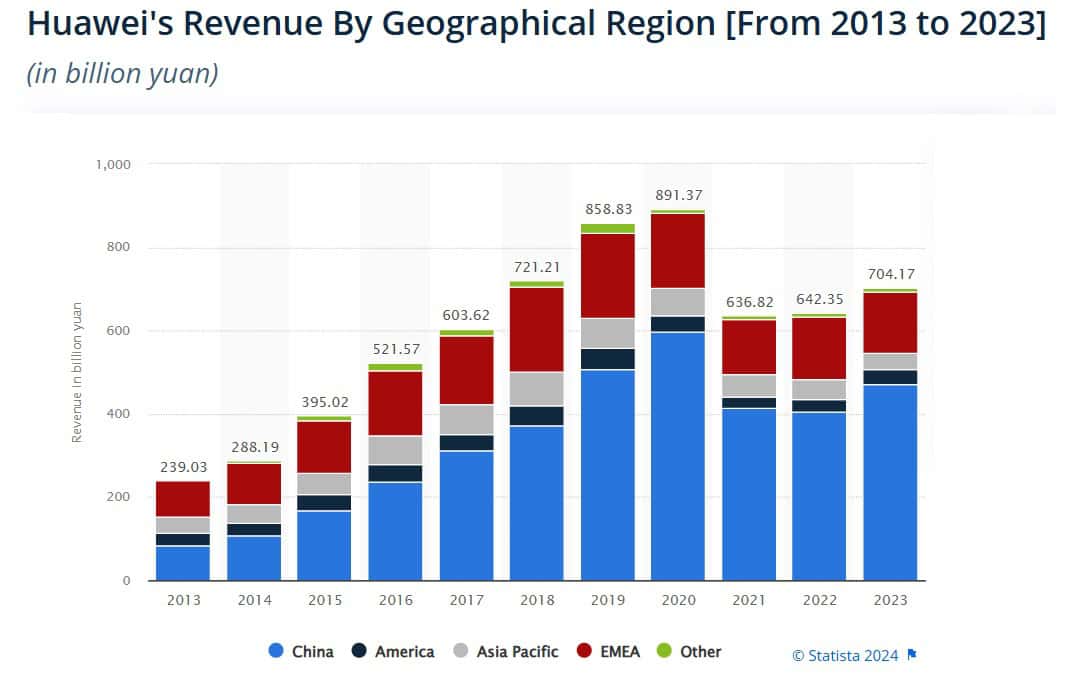
- In 2023, Huawei generated a revenue of approximately 471 billion yuan (about USD 66.2 billion) from its operations in China.
- Huawei’s headquarters is located in Shenzhen, China, a major hub for technological advancement.
- The company has shifted its business focus from carrier networks to technological innovations in recent years.
- From its ICT infrastructure business, Huawei earned over 360 billion yuan (about USD 50.6 billion).
- Huawei’s spending on research and development has increased significantly since 2012, from nearly 30 billion yuan (about USD 4.2 billion) to over 162 billion yuan (about USD 22.8 billion).
- Huawei’s brand recognition globally has significantly improved, making it a well-known technology brand worldwide.
- In the first quarter of 2012, Huawei’s smartphones accounted for about 3% of global shipments.
- Huawei’s global market share peaked at 20%, but the company experienced a significant loss in market position by 2021.
You May Also Like To Read
- Xiaomi Statistics
- Lenovo Statistics
- Asus Statistics
- Toshiba Statistics
- Intel Statistics
- Dell Statistics
- HP (Hewlett-Packard) Statistics
- Philips Statistics
- Apple Statistics
- Google Statistics
- Sony Statistics
- Microsoft Statistics
- Airbnb Statistics
- Google Revenue Statistics
- Amazon Statistics
- Tencent Statistics
Huawei Phone Statistics by Region
Africa:
- In February 2023, Huawei’s market share was 11.34%.
- However, it gradually dropped throughout the year, reaching 8.04% by December.
- In 2024, the market share stood at 7.96% in January but slightly increased to 8.43% in February.
Asia:
- Market share in 2023 began at 4.93% in February, decreasing to 3.59% by December.
- In 2024, the market share was 3.85% in January and 3.62% in February.
Europe:
- Market share in 2023 started at 6.39% in February, declining to 4.38% by December.
- In 2024, the market share was 4.22% in January and 4.14% in February.
North America:
- Market share in 2023 started at 1.12% in February, decreasing to 0.82% by December.
- In 2024, the market share was stable at 0.85% in January and February.
Oceania:
- Market share in 2023 started at 1.82% in February, decreasing to 1.28% by December.
- In 2024, the market share was 1.16% in January and February.
South America:
- Market share in 2023 began at 3.46% in February, declining to 2.17% by December.
- In 2024, the market share was 2.04% in January and 1.92% in February.
Huawei Statistics by Tablet Market
- As per worldwide tablet shipment Statistics, in the 4th quarter of 2023, Huawei shipped around 2.815 million tablets, holding a market share of 7.5%.
- Huawei’s tablet market share in Q1 of 2024 will be 2.34%, down 0.10% from last quarter.
- Based on Huawei Statistics, the quarterly market share of tablets in 2023 is Q1 (2.55%), Q2 (2.39%), Q3 (2.17%), and Q4 (2.34%).
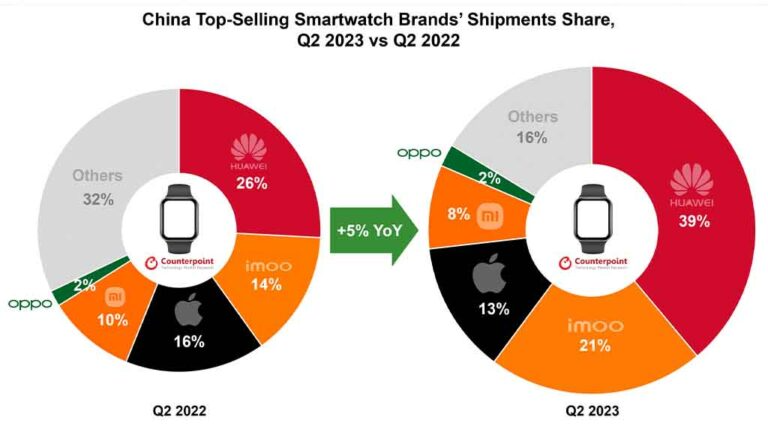
Huawei Statistics by Smartwatch
(Source: huaweicentral.com)
- Huawei Statistics show that in the first and second quarters of 2023, Huawei was the top-selling smartwatch brand, with a 37% and 39% market share, respectively.
- Meanwhile, the shipment share of Huawei smartwatches has increased by 58%.
- In the 3rd quarter of 2023, the global shipment share of Huawei smartwatches was 14%, an increase of 56% year over year.
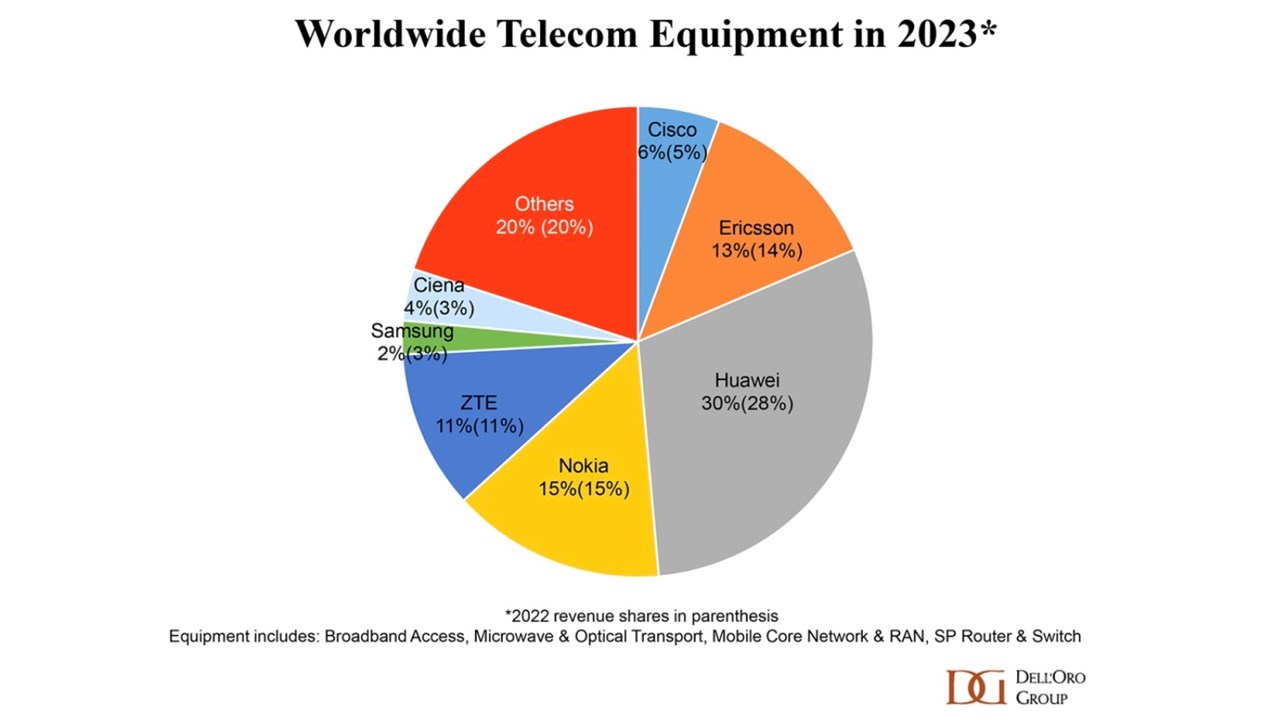
Telecom Equipment Market Analysis
(Source: telecomtv.com)
- A research firm, Dell’Oro Group has stated that Telcom spending on network technology has decreased by 5% in 2023
- Huawei Technologies turned out to be the biggest single vendor, with a global market share of 30%.
- Other brands’ shares are followed by Nokia (15%), Ericsson (13%), ZTE (11%), Cisco (6%), Ciena (4%), Samsung (2%), and others (20%).
Huawei Country Patent Statistics
(Reference: insights.greyb.com)
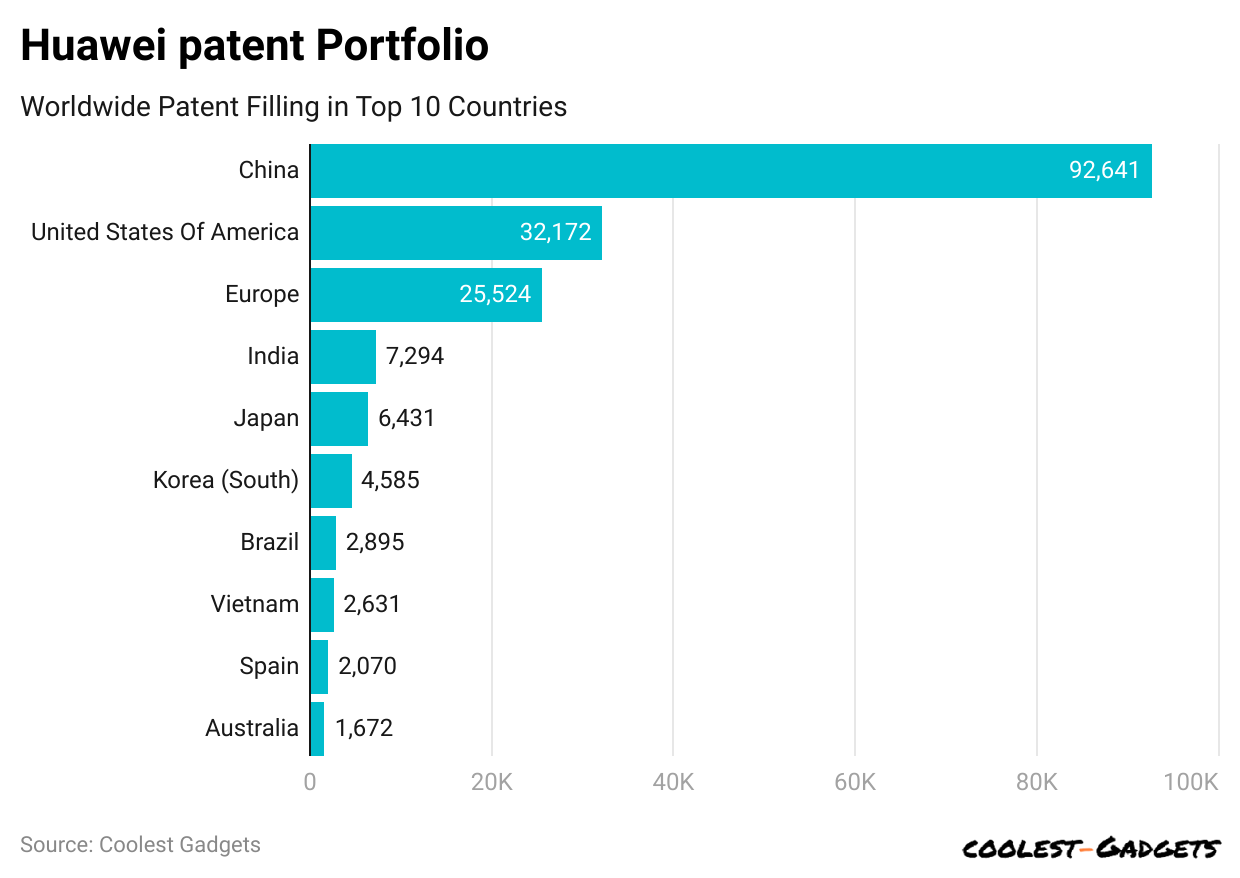
- Considering Huawei Statistics in China, the total number of active patents was around 92,641 in 2023.
- The following top patent-filling countries by total active patents are the United States of America (32,172), Europe (25,524), India (7,294), Japan (6,431), South Korea (4,585), Brazil (2,895), Vietnam (2,631), Spain (2,070), and Australia (1,672).
Leading 5G Patent Technology
(Source: Statista.com)
- Huawei Statistics show that revenue earned from Huawei’s information and communications technology business in 5G network gear reached $23.22 billion.
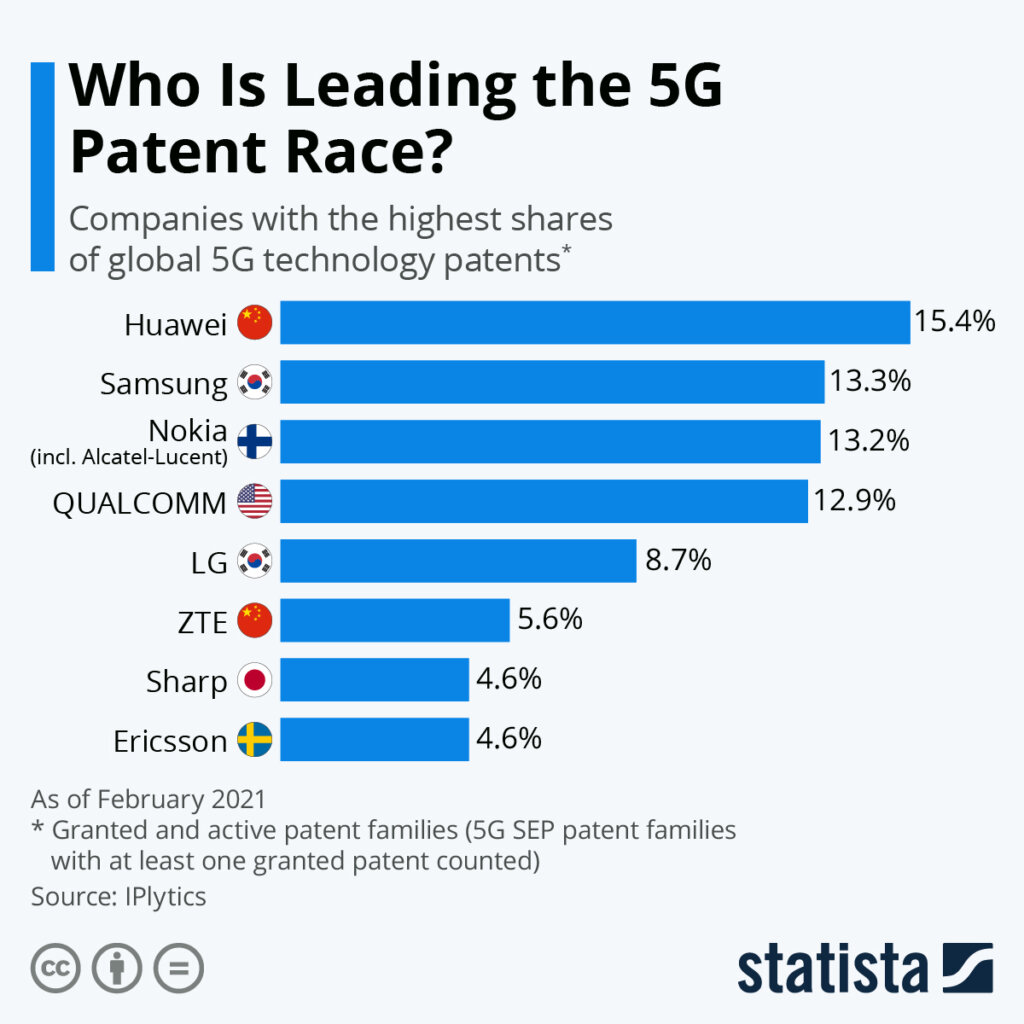
- Huawei made the highest shares with 15.4% in the global 5G technology patent in 2023.
- Meanwhile, other brands shared by 5G patent technology are Samsung (13.3%), Nokia (13.2%), QUALCOMM (12.9%), LG (8.7%), ZTE (5.6%), Sharp (4.6%), and Ericsson (4.6%).
Huawei Statistics by Operating System
- Harmony OS is known to be the third largest mobile operating system after Android and iOS.
- Huawei Statistics affirms that in the 2nd quarter of 2023, Huawei’s Harmony OS was considered a 10% market share.
- Around 60 million users were using Harmony OS 4 in 2023.
- In Q3 of 2023, Harmony OS held a 3% global market share of smartphone operating systems and a 13% share in the Chinese market.
Huawei Statistics by Business Segment
- According to Huawei Statistics, ICT infrastructure generated revenue of CNY167.2 billion in the first half of 2023.
- Similarly, revenue earned by other business segments was Consumer (CNY103.5 billion), Cloud Computing business (CNY24.1 billion), Digital Power business (CNY24.2 billion), and Intelligent Automotive Solutions (CNY1 billion).
The Website Traffic of Huawei Statistics
By Geography
(Source: similarweb.com)
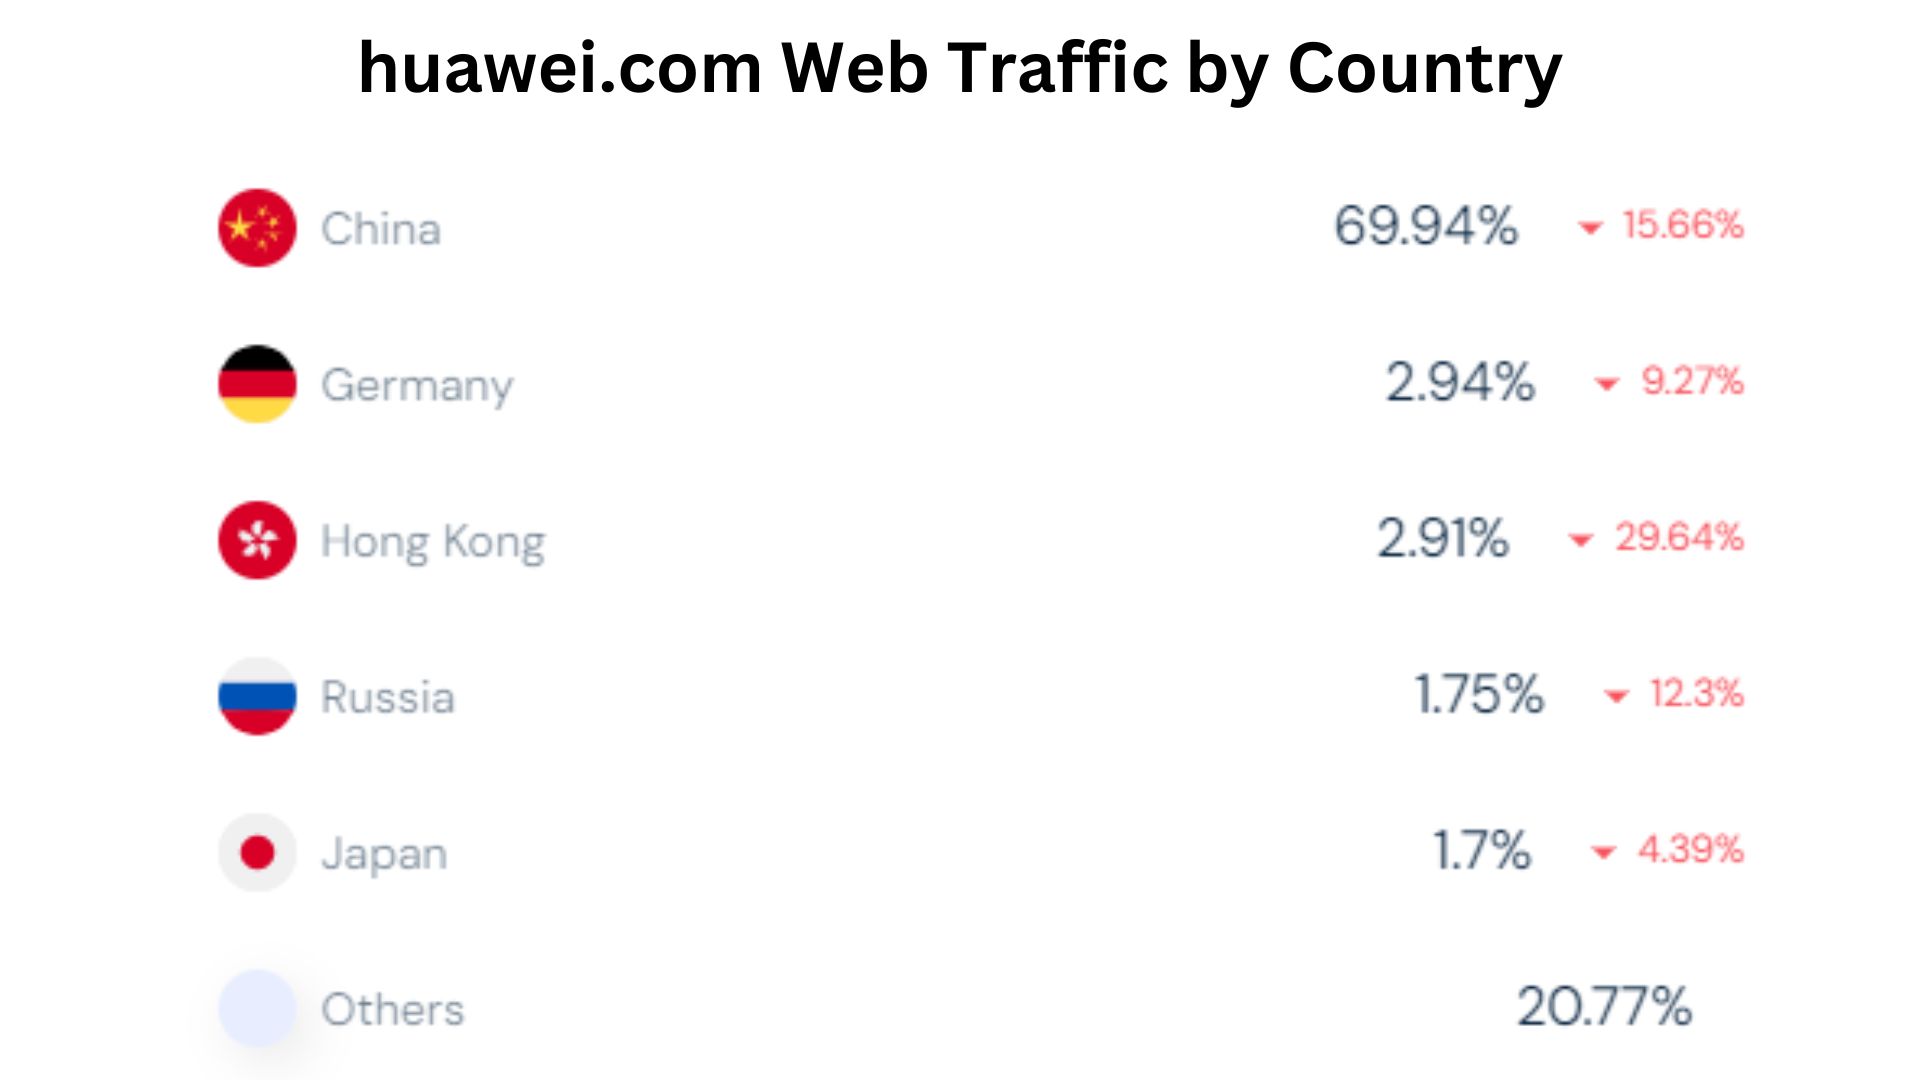
- As explained by Huawei Statistics, China recorded 69.94% of total traffic on huawei.com, but it reduced the total website visitors by 15.66%.
- Furthermore, other countries recorded the following contribution in total traffic: Germany = 2.94% (-9.27%), Hong Kong = 2.91% (-29.64%), Russia = 1.75% (-12.3%), and Japan = 1.7% (-4.39%).
- Other countries collectively made up around 20.77% of visitors to Huawei.com.
By Demographics
(Reference: similarweb.com)
- As of February 2024, the total number of users shared by gender on the website is 64.44% male and 35.56% female.
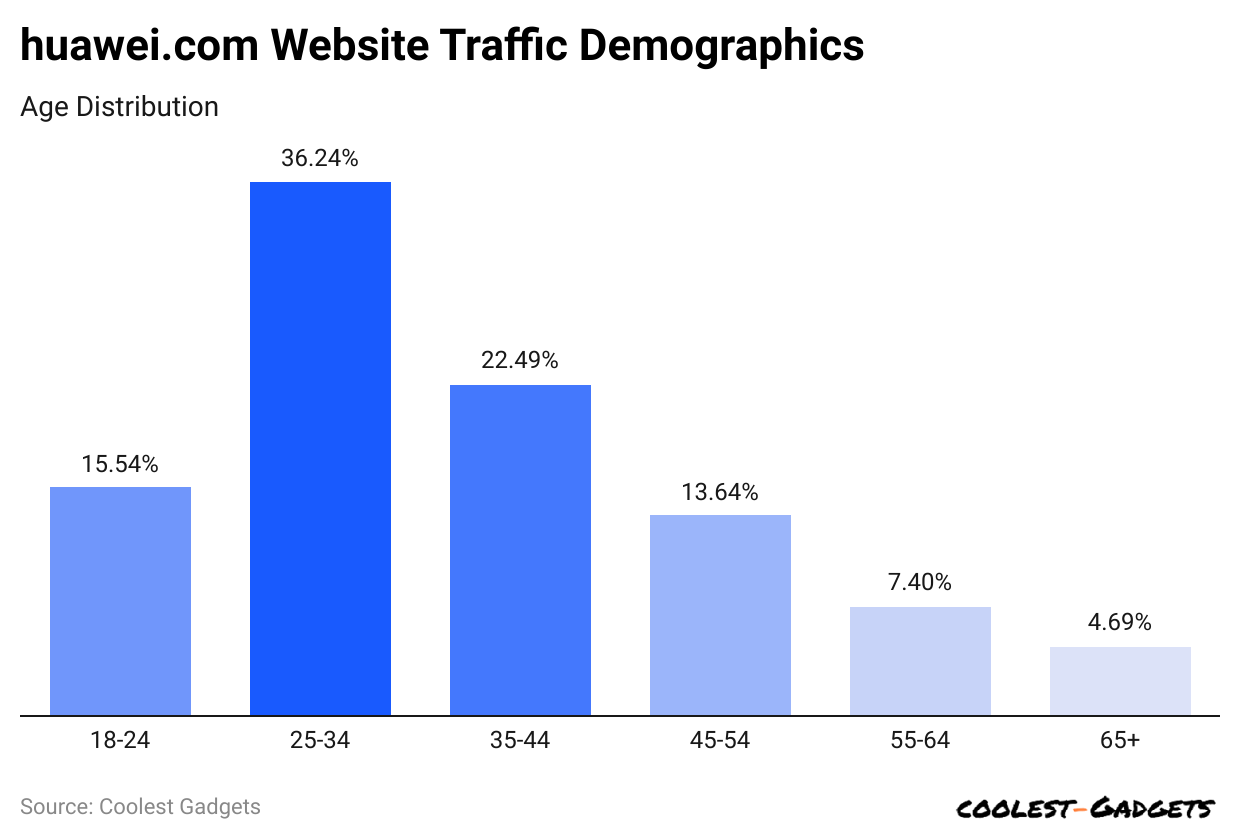
- Huawei Statistics by age group states that the highest number of website users observed between 25 and 34 years old, resulting in 36.24%.
- The following user share belongs to the 35 to 44 years age group with 22.49%.
- 54% and 13.64% belong to 18 to 24 years and 45 to 54 years respectively.
- 4% of Huawei.com users are aged from 55 to 64 years.
- Around 4.69% of user shares lie between the age group of 65 years and above.
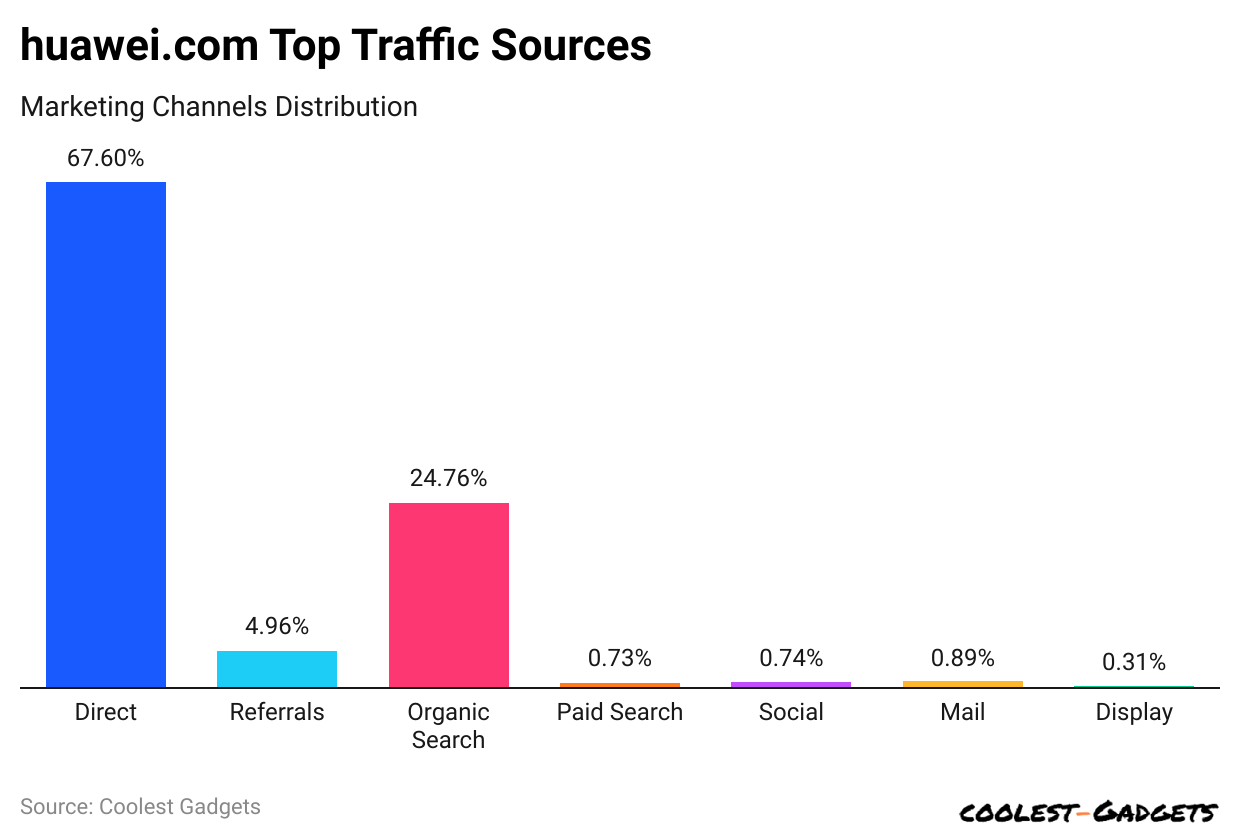
By Traffic Source
(Reference: similarweb.com)
- The highest traffic rate towards huawei.com was deemed by direct search, with 67.6%.
- The following share was generated by Organic search with 24.76%.
- Meanwhile, 4.96% of traffic share is from referrals.
- Furthermore, other traffic sources towards huawei.com are Paid Search (0.73%), Social (0.74%), Mail (0.89%), and Display (0.31%).
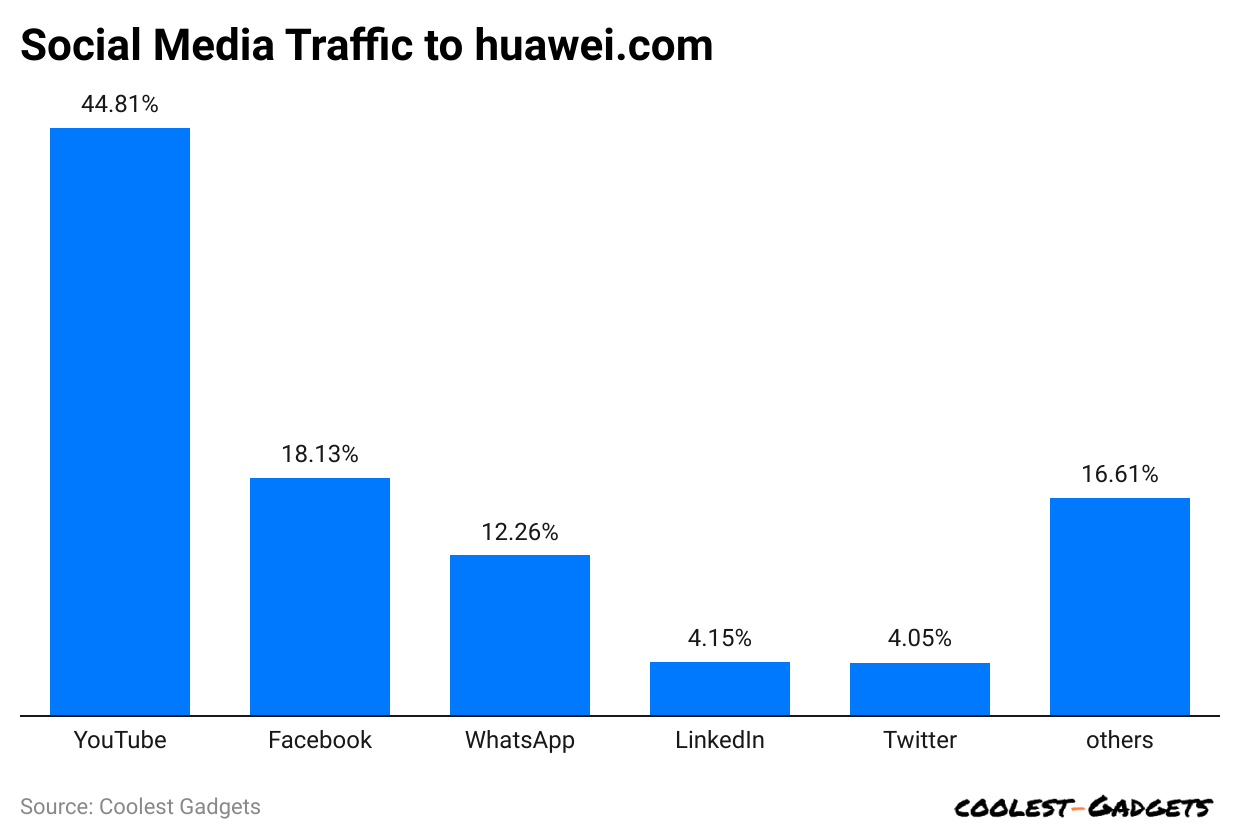
By Social Media Referral Rate
(Reference: similarweb.com)
- YouTube holds the highest social media referral rate, with 44.81%.
- Meanwhile, Facebook and WhatsApp contribute around 18.13% and 12.26% share respectively.
- Traffic share sent by LinkedIn was 4.15%, and Twitter was 4.05%.
- Other social media networks have a nominal contribution, collectively around 16.61%.
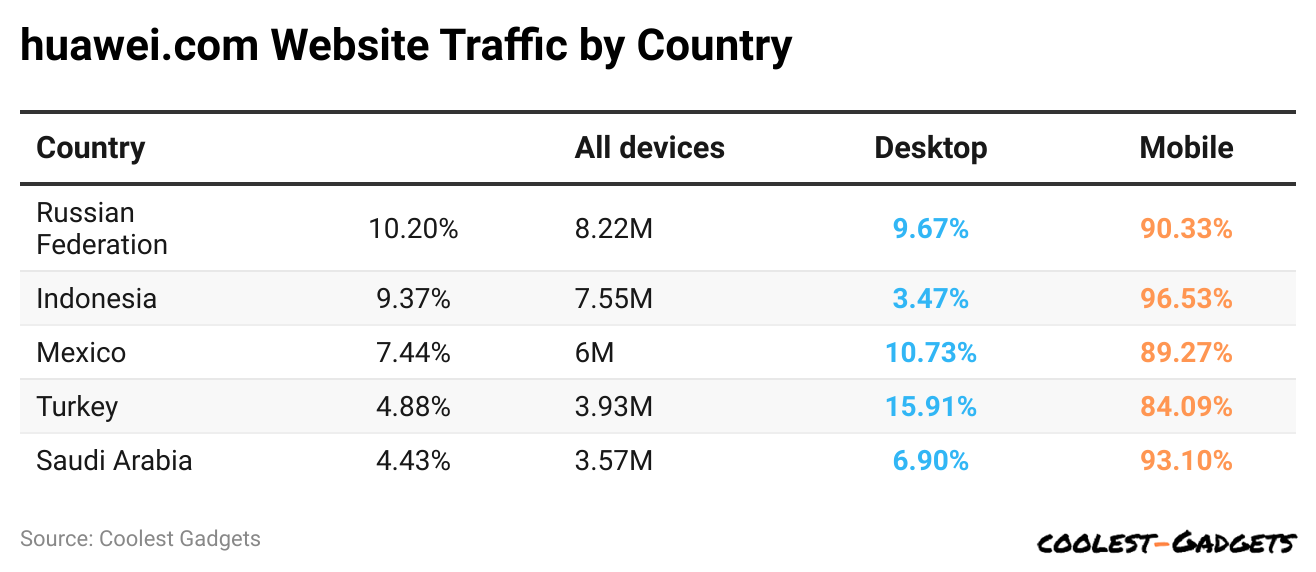
By Device
(Reference: semrush.com)
- In huawei.com, 83.02% of traffic comes from mobile users and 16.98% of desktop visits.
- 2% of Huawie’s share belongs to the Russian Federation, which holds 8.22 million devices. 9.67% of visitors’ share comes from desktop, while 90.33% comes from mobile.
- Indonesia has 7.55 million users, which accounts for 9.37% of the market’s share. Of these, 3.47% and 96.53% belong to desktop and mobile users, respectively.
- Out of the total players, 7.44% come from Mexico, resulting in 6 million devices, with 10.75% access to the desktop version and 89.27% to mobile devices.
- Turkey and Saudi Arabia have around 3.39 million and 3.57 million devices, respectively, which results in a 4.88% and 4.43% user share, respectively.
- 91% of desktop and 84.09% of mobile share in Mexico; on the other side, 6.9% of desktop and 93.1% of mobile share in Saudi Arabia.
The Best Huawei Phones to Buy in 2024
- Huawei P60 Pro (overall best phone), Price: USD 1,190
- Huawei Mate 50 Pro (best value phone), Price: USD 890
- Huawei Mate X3 (best productivity phone), Price: USD 1,999
- Huawei P40 Pro (best camera phone), Price: USD 789
- Huawei P30 Lite (best budget phone), Price: USD 389.99
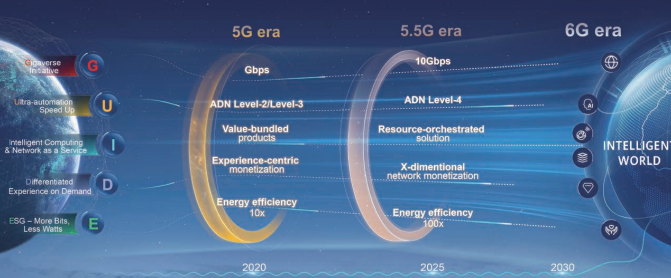
Huawei’s Statistics by Career Market
(Source: huawei.com)
- Huawei has started developing its green indicator system, which features three-layered architecture solutions such as green sites, green networks, and green operations.
- By the end of 2025, Huawei is looking forward to the 5.5G era from the 5G era. The features of the 5.5G era include 10Gbps, ADN Leve-4, Resource-orchestrated solution, X-dimensional network monetization, and Energy efficiency 100x.
- Huawei has also worked with other Chinese carriers to implement autonomous networks fully.
Conclusion
Globally, Huawei Statistics states that Huawei is one of the leading global technological companies. It is best known for its telecommunications equipment and consumer electronics, which have high-quality devices and cutting-edge features.
The Company has a strong presence in Europe, Asia, and Africa and a small share in America. This article includes all essential analyses and current Huawei trends; I hope all the detailed stats will help you better understand the market in recent years.
Sources
Pramod Pawar brings over a decade of SEO expertise to his role as the co-founder of 11Press and Prudour Market Research firm. A B.E. IT graduate from Shivaji University, Pramod has honed his skills in analyzing and writing about statistics pertinent to technology and science. His deep understanding of digital strategies enhances the impactful insights he provides through his work. Outside of his professional endeavors, Pramod enjoys playing cricket and delving into books across various genres, enriching his knowledge and staying inspired. His diverse experiences and interests fuel his innovative approach to statistical research and content creation.