Google Statistics By Revenue, Nation, Region, Operating Income, Users, Applications and Facts

Updated · Mar 10, 2025


TABLE OF CONTENTS
- Introduction
- Editor’s Choice
- Google Facts
- Google Statistics By Revenue
- Google’s Revenue Breakdown, 2023
- Google Workspace Websites Statistics By Nation
- Revenue Breakdown By Region
- By Operating Income
- Google Search Statistics, 2024
- Google Search Volume Statistics
- Google Search Engine Statistics
- By The Most Searched Term
- Google Local Searches Statistics By Time Frame
- By Keyword Distribution
- Google Searches Users’ Decisions Per Second.
- Google Search Result Position By CTR Rate
- By Voice Search
- Google Home Device Statistics By Users
- By Desktop Search Engine
- Google Play Store Statistics By Applications
- Google Bard Statistics
- Users Share By Age Group.
- By Website Traffic
- Conclusion
Introduction
Google Statistics: Google is one of the biggest technology companies in the world. It was founded in 1998 by Larry Page and Sergey Brin. Google started as a search engine, helping people find information online. Over time, it grew into a company that offers many services like Gmail, YouTube, Google Maps, and Android. It also develops new technology, such as artificial intelligence and cloud computing.
Google’s mission is to make information easy to access for everyone. Today, billions of people use Google’s services daily. The company continues to innovate and improve technology to make life easier for users worldwide.
Editor’s Choice
- Google Statistics show that in 2024, Alphabet, Google’s parent company, reported a net profit exceeding USD 100 billion.
- The company’s annual revenue grew by 14% in 2024, reaching USD 350 billion.
- Alphabet plans to invest approximately USD 75 billion in capital expenditures in 2025.
- Meanwhile, Google’s search operations continue to grow. Annual searches surpass 5 trillion, reflecting a growth rate exceeding 20% over the past two years.
- Google Cloud’s revenue was USD 11.96 billion in the fourth quarter of 2024, slightly below the projected USD 12.16 billion.
- Digital advertising revenue grew by 10.6% in the fourth quarter of 2024, totaling USD 72.46 billion.
- YouTube’s advertising revenue increased by 13.8% in the fourth quarter of 2024, driven by heightened political advertising.
- In September 2024, the EU Court of Justice upheld a €2.4 billion fine against Google for favoring its shopping services, citing an illegal monopoly.
- In October 2024, Google expanded its AI Overviews feature to 100 additional countries, including Australia and New Zealand.
- Google’s self-driving car unit, Waymo, announced plans to launch services in Tokyo, marking its first international expansion.
You May Also Like To Read
- Google Pixel Smartphones Statistics
- Google Stadia Statistics
- Google Home Smart Device Statistics
- Google Search Statistics
- Google Smartphone Statistics
- Google Lens For iPhone
- Alexa vs Google Home vs Siri
- Popular Google Doodle Games
- Google My Business Statistics
- Google Shopping Statistics
- Google Revenue Statistics
- Google Chrome Statistics
Google Facts
- Do you know who founded Google? Two Ph.D. students, Stanford University’s Larry Page and Sergey Brin, created Google in 1998.
- According to Google, the original name was BackRub.
- The name ‘Google’ is based on math, a mathematical expression for one followed by 100 zeros.
- In 2006, the word Google was officially added to Oxford English dictionaries.
- Google is banned in North Korea, China, and Iran.
- More than 70 Google offices are available in 50 countries worldwide, except Antarctica.
(Source: buttercms.com)
- Google is considered the world’s top search engine to date.
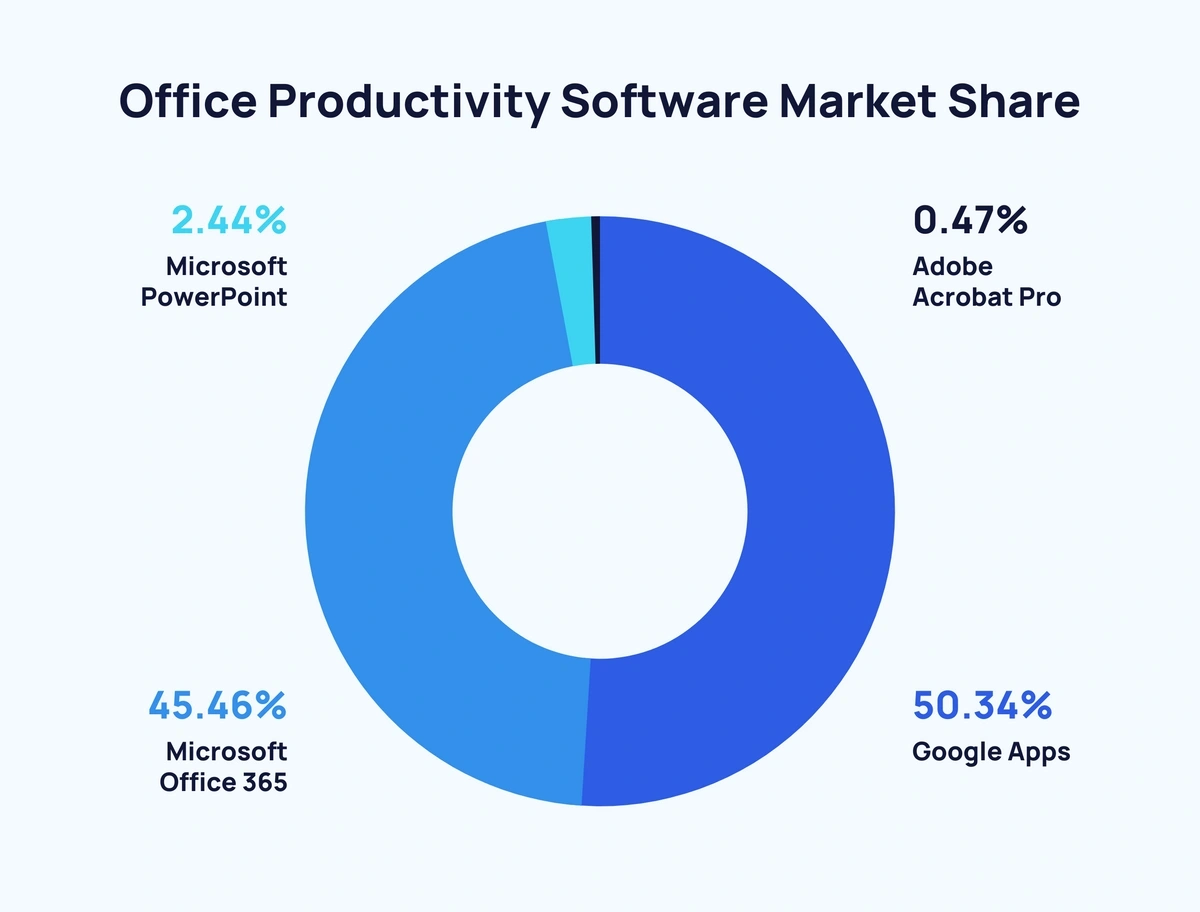
- The market share of Google Apps accounted for more than 50.34% of the share.
- Approximately 15 million websites use Google Workshops, of which 6 million belong to the United States.
- There are around 2 billion users available on Google Drive.
Google Statistics By Revenue
| Quarter | Google Services (USD billion) |
Google Cloud (USD billion) |
Total Revenue (USD billion) |
| Q1 | 70.0 | 9.5 |
81.0 |
|
Q2 |
8.67 | 10.35 | 84.74 |
| Q3 | 76.5 | 11.4 |
88.3 |
|
Q4 |
84.1 | 12.0 |
96.5 |
(Reference: statista.com)
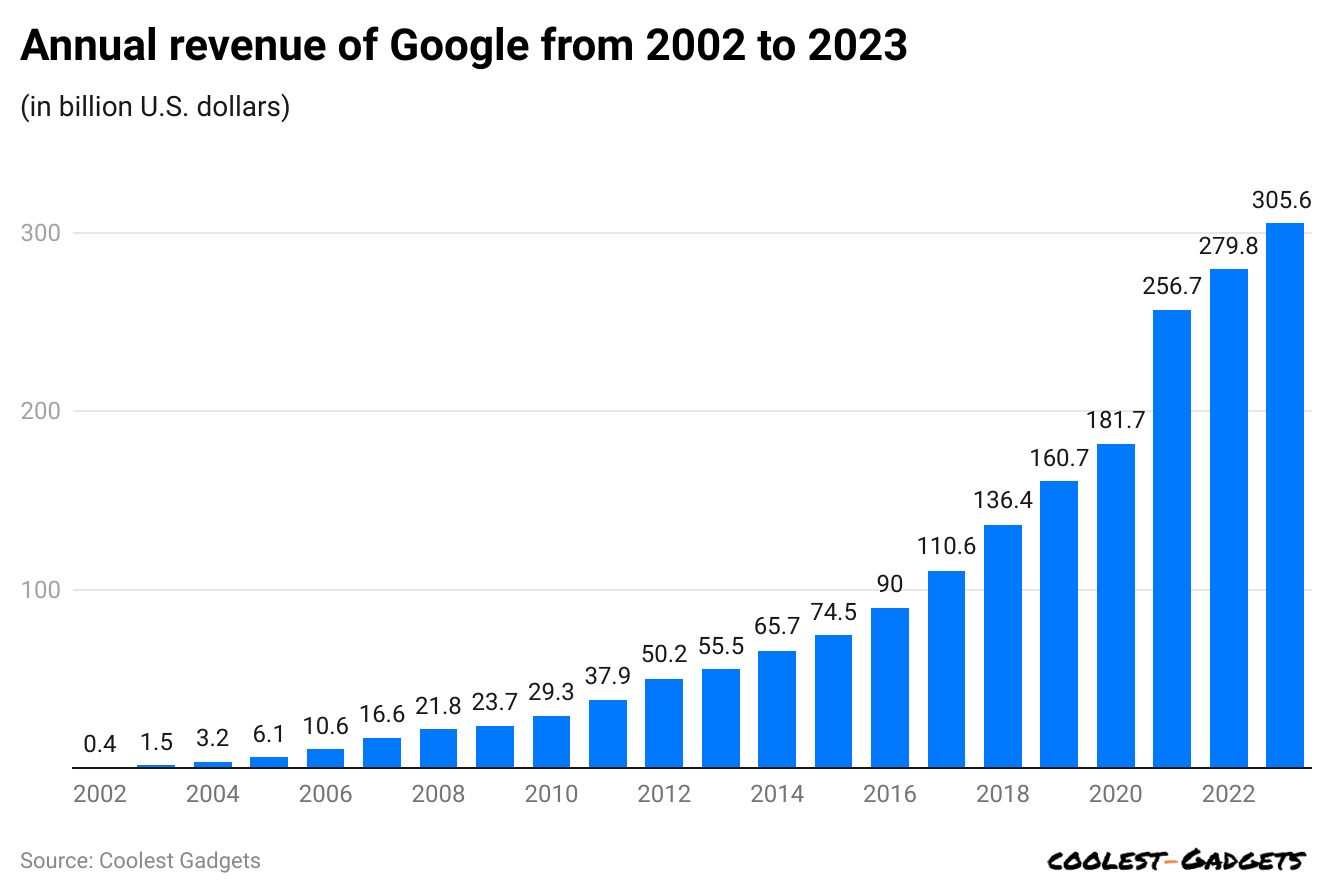
- According to a report published by Statista, Google’s global annual revenue in 2023 amounted to USD 305.6 billion.
- As of August 2023, the world’s biggest internet company was Alphabet, with more than USD 1.6 trillion market capitalization, and it is termed the parent company of Google.
(Reference: statista.com)
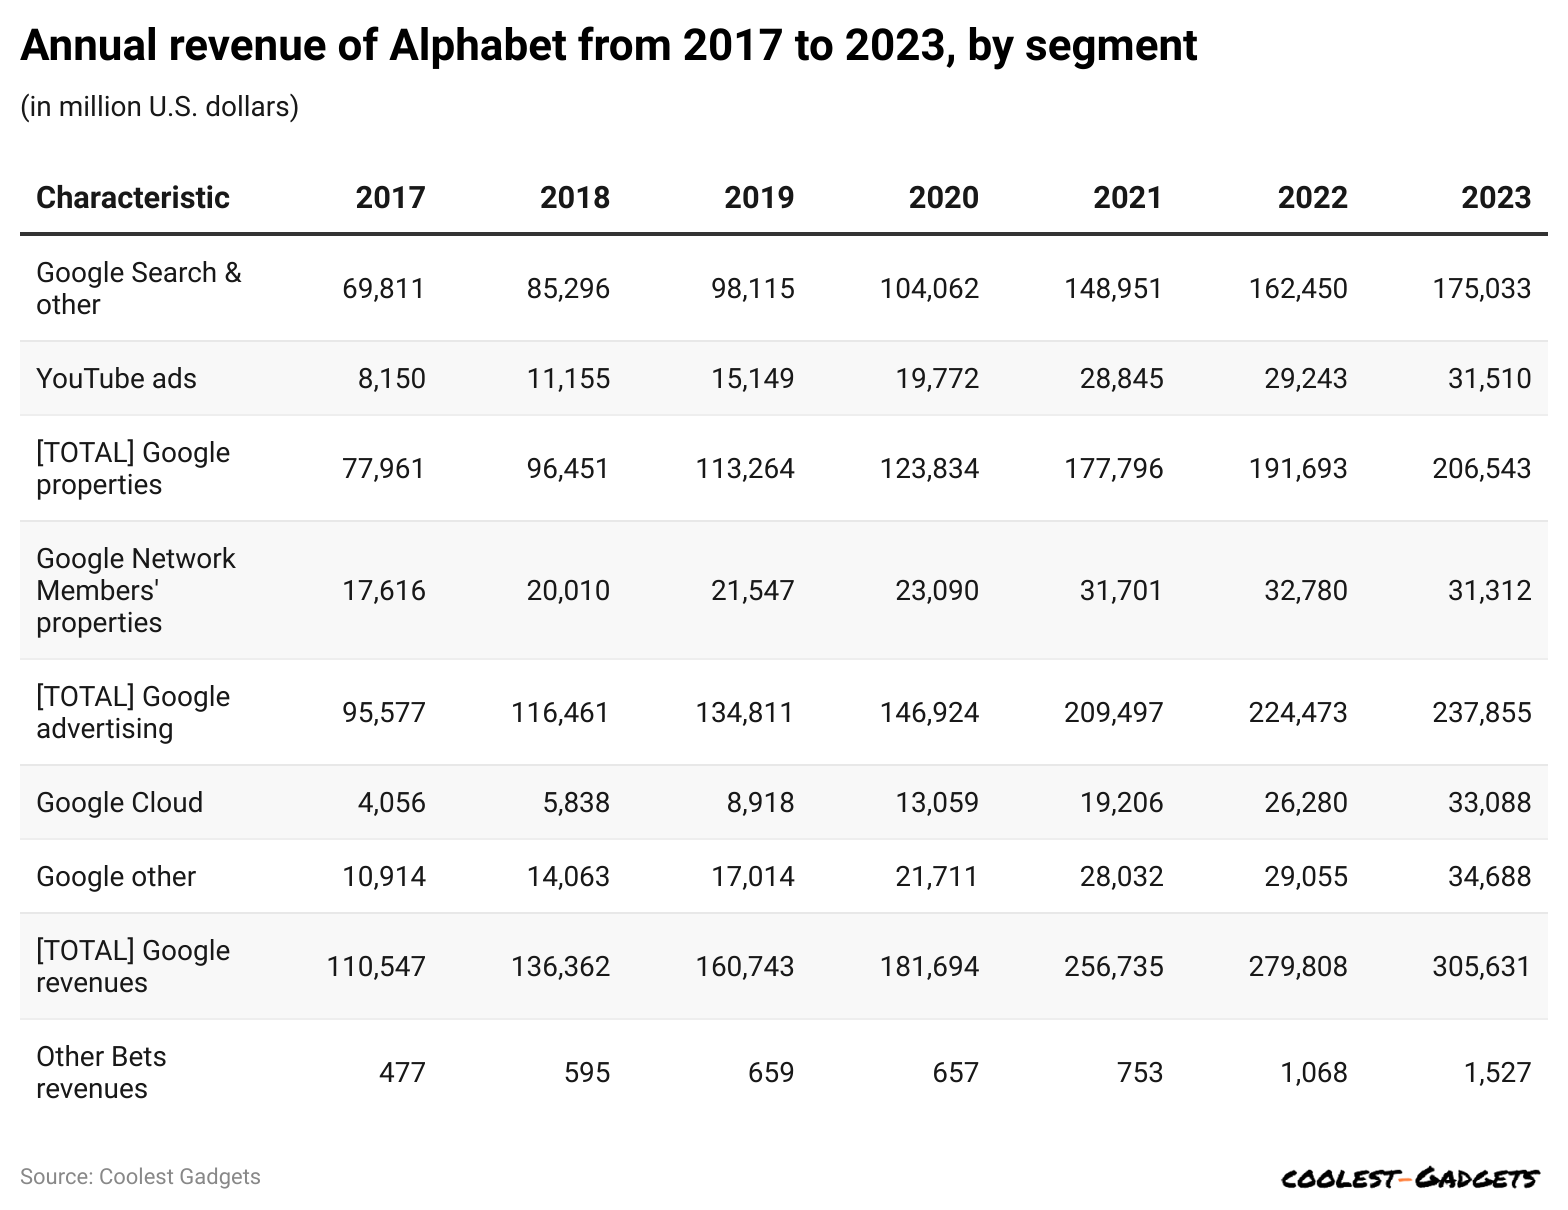
- In 2023, based on segments, Alphabet’s highest annual revenue was earned by Google search and others; YouTube ads amounted to USD 175,033 million and USD 31,510 million, respectively.
You May Also Like To Read
- Xiaomi Statistics
- Lenovo Statistics
- Asus Statistics
- Toshiba Statistics
- Intel Statistics
- Dell Statistics
- HP (Hewlett-Packard) Statistics
- Philips Statistics
- Apple Statistics
- Sony Statistics
- Microsoft Statistics
- Airbnb Statistics
- Google Revenue Statistics
- Amazon Statistics
- Tencent Statistics
(Reference: statista.com)
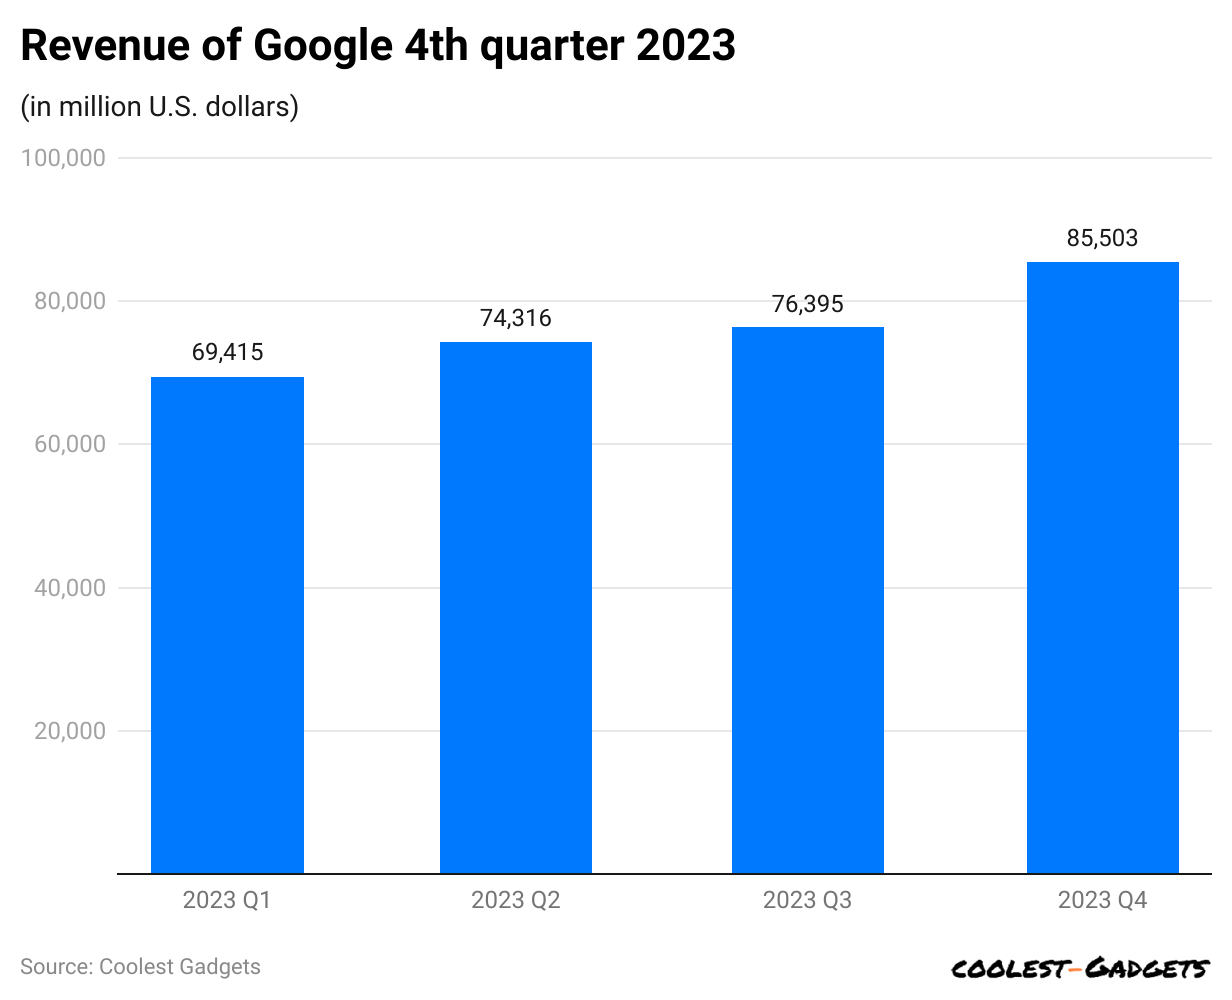
- Quarterly revenue generated by Google in 2023 are Q1 (USD 69.4 billion), Q2 (USD 74.3 billion), Q3 (USD 76.3 billion), and Q4 (USD 85.5 billion).
(Reference: statista.com)
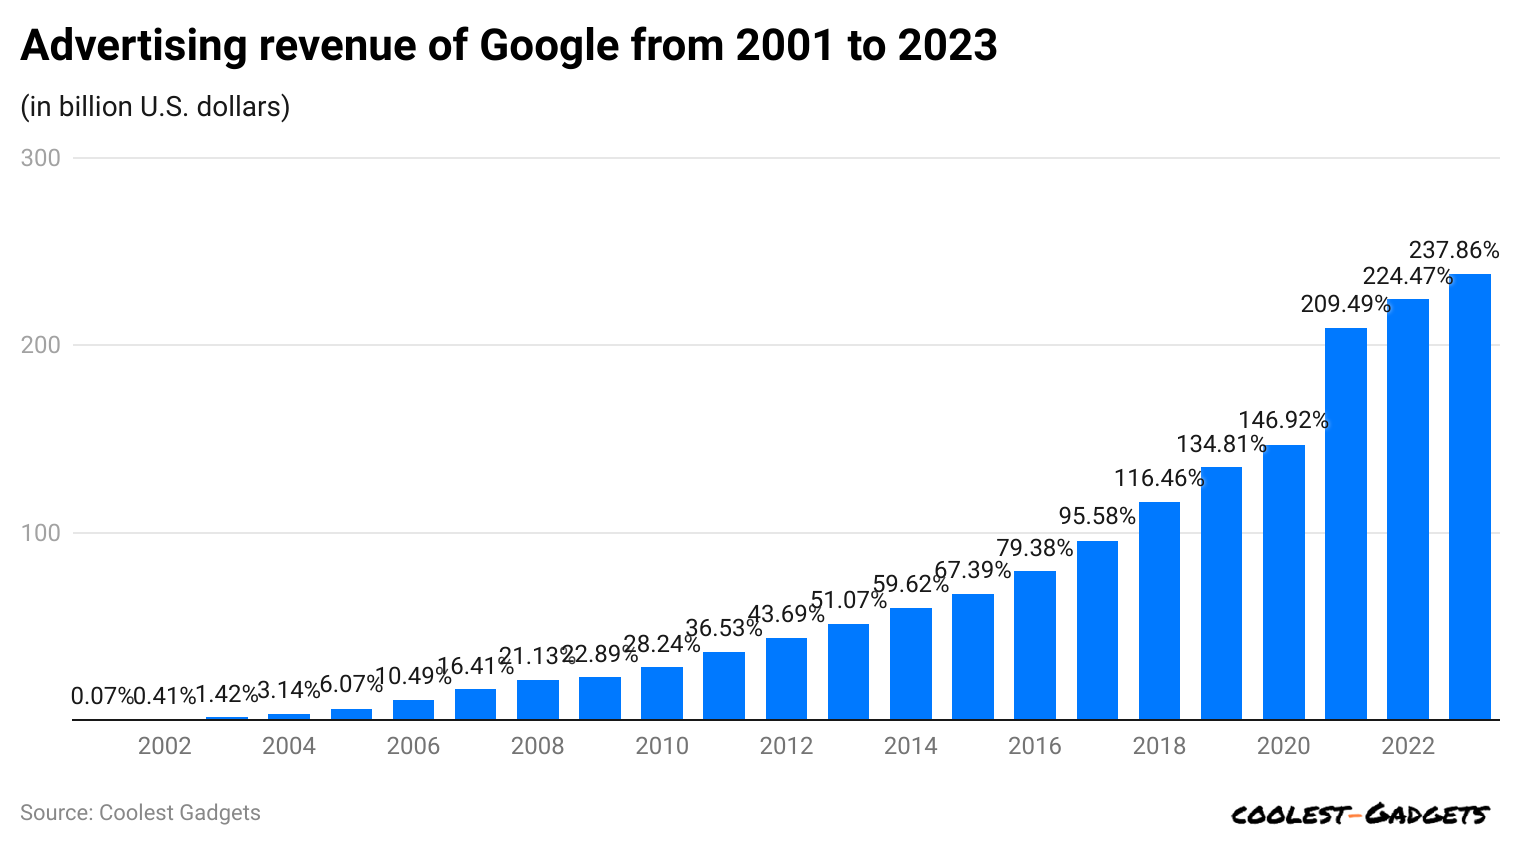
- The larger revenue share of Google is made up of advertising platforms, resulting in USD 237.86 billion in 2023.
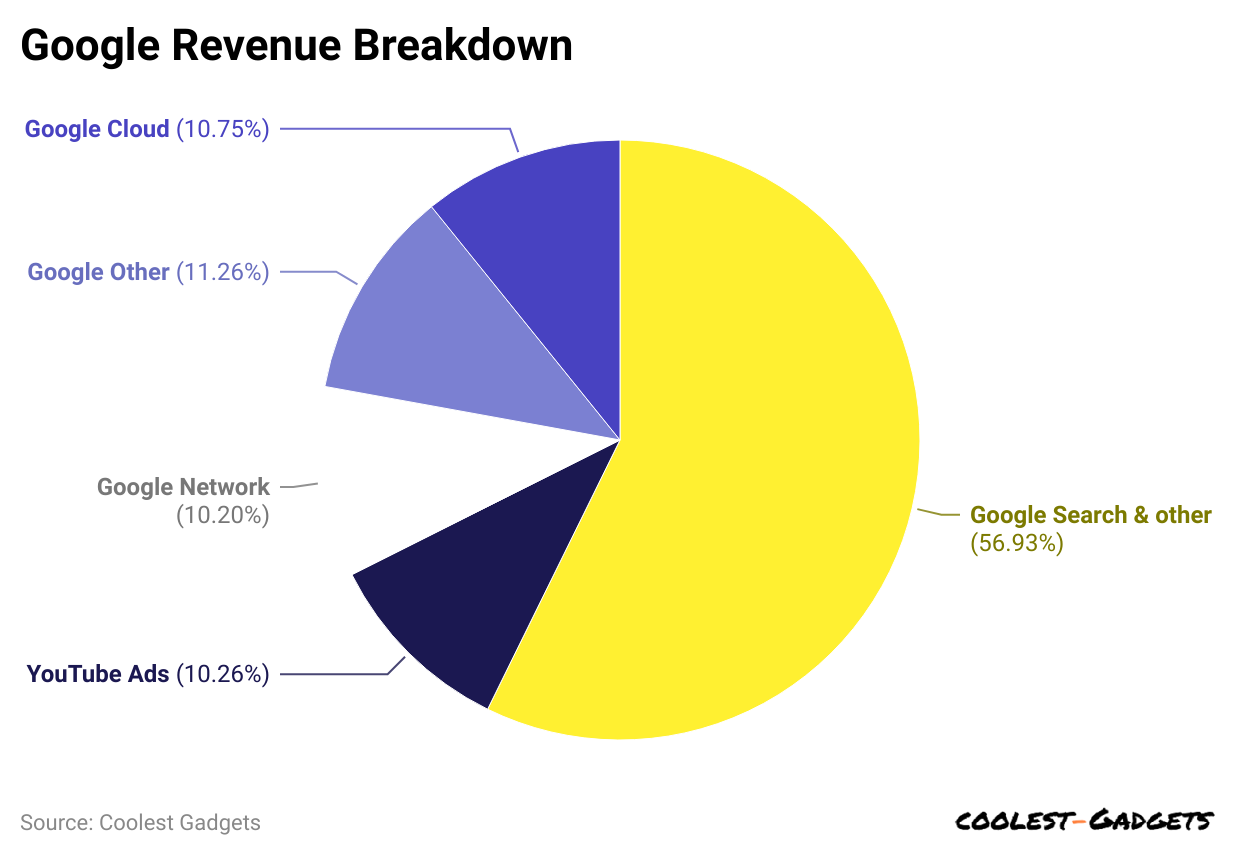
Google’s Revenue Breakdown, 2023
(Reference: doofinder.com)
- The advertising revenue is segmented into Google search, YouTube ads, and Google Network Members properties.
- The highest revenue and YoY increase amounted to Google Search and Others, around USD04 billion (56.93%).
- Whereas others are followed by YouTube ads = USD 51 billion (10.26%), Google Network = USD 31.316 billion (10.20%), Google Other = USD 34.68 billion (11.26%), and Google Cloud = USD 33.08 billion (10.75%).
In 1st quarter
Google Search & Other (USD 40.36 billion), YouTube Ads (USD 6.69 billion), Google Network (USD 7,496 million), Google Advertising (USD 54.55 billion), Google Other (USD 7.41 billion), Google Services Total (USD 61.96 billion), Google Cloud (USD 7.45 billion), Other Bets (USD 288 million), and Hedging Gains (USD 84 million).
2nd quarter
Google Search & Other (USD 42.63 billion), YouTube Ads (USD 7.67 billion), Google Network (USD 7.85 billion), Google Advertising (USD 58.14 billion), Google Other (USD 8.14 billion), Google Services Total (USD 66.29 billion), Google Cloud (USD 8.03 billion), Other Bets (USD 285 million), and Hedging Gains (USD 3 million).
3rd quarter
Google Search & Other (USD 44.03 billion), YouTube Ads (USD 7.95 billion), Google Network (USD 7.67 billion), Google Advertising (USD 59.65 billion), Google Other (USD 8.34 billion), Google Services Total (USD 67.99 billion), Google Cloud (USD 8.41 billion), and Other Bets (USD 297 million).
4th quarter
Google Search & Other (USD 48.02 billion), YouTube Ads (USD 9.20 billion), Google Network (USD 8.29 billion), Google Advertising (USD 65.52 billion), Google Subscriptions, Platforms, and Devices (USD 10.79 billion), Google Services Total (USD 76.31 billion), Google Cloud (USD 9.19 billion), Other Bets (USD 675 million), and Hedging Gains (USD 150 million).
You May Also Like To Read
- Anker Statistics
- Sennheiser Statistics
- Seagate Statistics
- Razer Statistics
- Motorola Statistics
- Samsung Statistics
- Garmin Statistics
- Panasonic Statistics
- LG Statistics
- Huawei Statistics
- Oppo Statistics
- iPhone Statistics
Google Workspace Websites Statistics By Nation
- As per Google Statistics, in 2024, Google Workspace is used by over 14.5 million websites globally.
- The United States leads with approximately 6 million websites utilising the service, accounting for over one-third of the total.
| Country | Number of Websites |
| Japan |
1,000,000 |
|
Germany |
700,000 |
| United Kingdom |
500,000 |
|
France |
400,000 |
| Canada |
300,000 |
|
Australia |
250,000 |
| Netherlands |
200,000 |
|
Brazil |
150,000 |
| India |
100,000 |
Revenue Breakdown By Region
- In the United States, Google has earned USD 74.3 billion in revenue, with a share of 57.1% in 2023.
- The total revenue earned by Europe, the Middle East, and Africa was USD 79 billion (30%), Asia Pacific resulting USD 10.45 billion (19%), and Canada and Latin America together made a revenue of USD 14 billion (5%).
By Operating Income
- During the first three quarters of 2024, the operating income for Google Services (Android, Chrome, hardware, Google Maps, Google Play, Search, and YouTube) was nearly USD 88.4 billion.
- Meanwhile, Google Cloud’s OI exceeded USD 4 billion.
(Reference: statista.com)
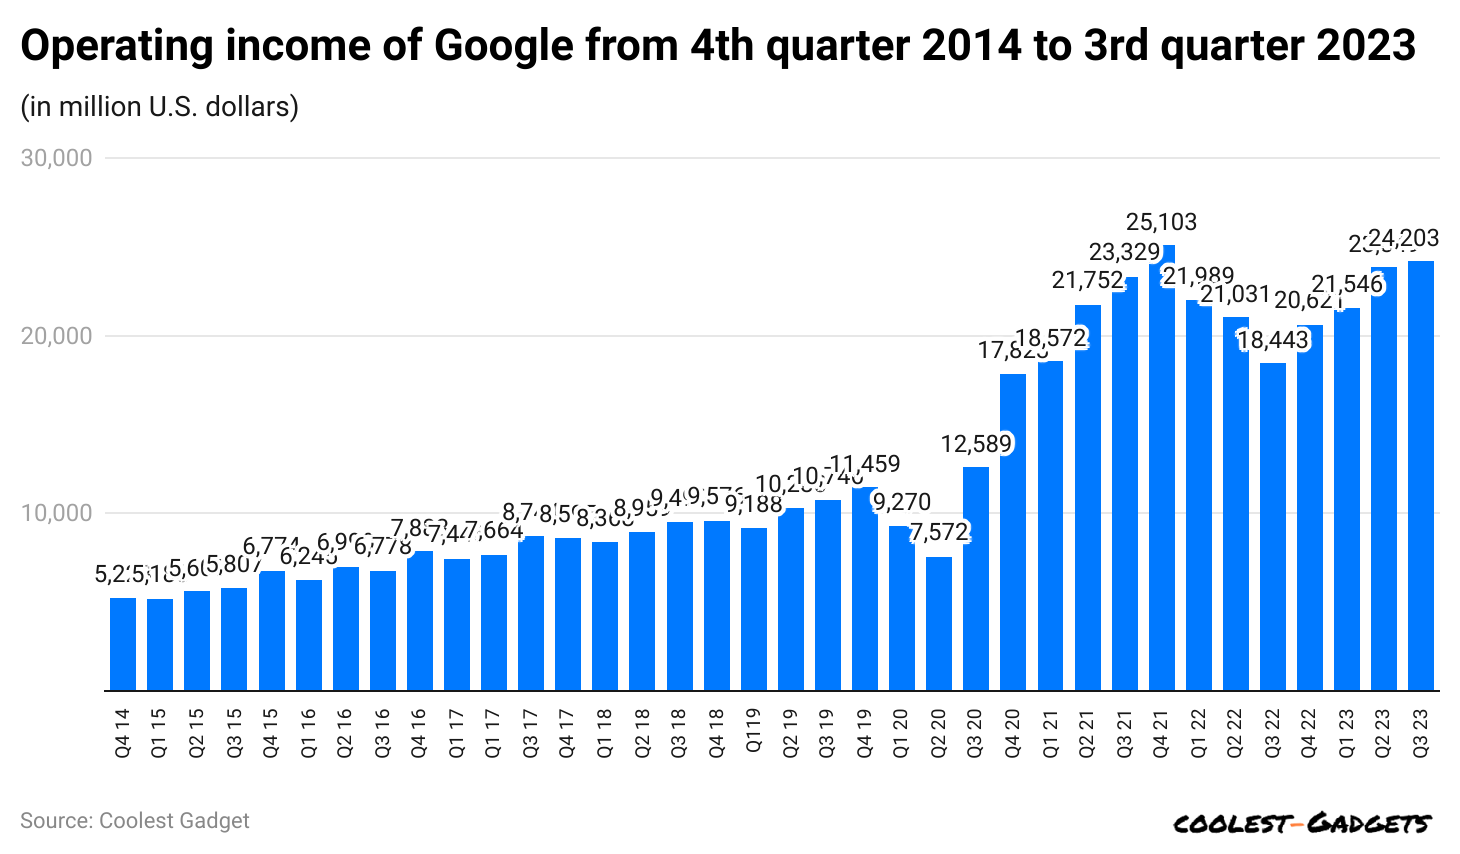
- California-based web company Google’s operating income in the 1st quarter of 2023 was USD 21.5 billion, which has slightly decreased from Q1 of 2022.
- Google’s other quarterly income in 2023 was Q2 (USD 23.8 billion) and Q3 (USD 24.2 billion), with an increase of around USD 18.4 billion in the previous fiscal quarter.
Google Search Statistics, 2024
- Every day, more than 90% of people are using Google to get an answer to their queries.
- The average time required by Google to answer a query is 36 seconds.
- Per day, Google is used more than three times by 84% of Google searchers, which results in around 1095 to 1460 searches per year by an average person.
- In the Google App, approximately 20% of searches are done via voice search.
- 46% of searches start on Google if the topic is a product search.
- Google’s 78% of local mobile searches finally turn into offline purchases.
- In January, nearly 500 million users were using Google Assistant.
- If considering a smart speaker, Google Home is the top priority as it understands 100% of the queries.
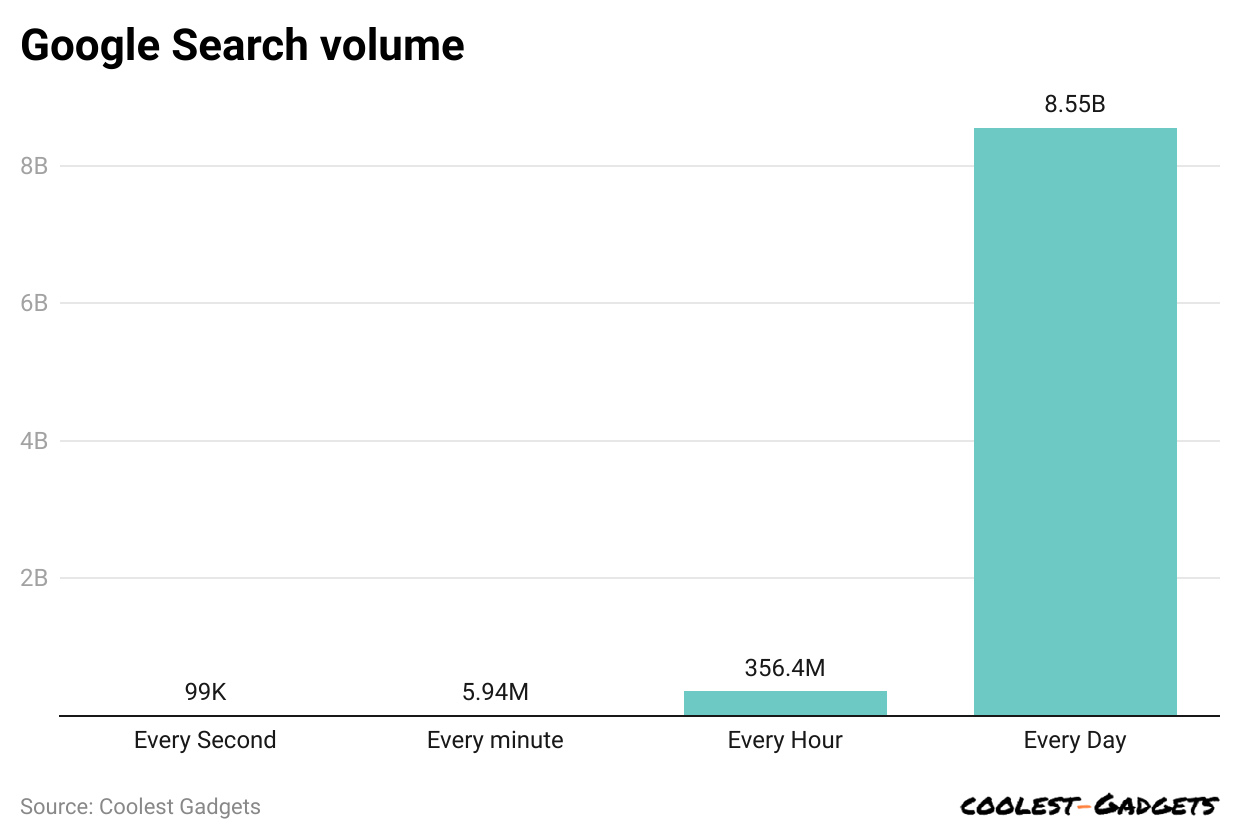
Google Search Volume Statistics
(Reference: demandsage.com)
- Google processes 8.55 billion searches daily as of January 2024.
- Other Google search volumes are 99,000 searches (per second), 5.94 million (per minute), 356.4 million (per hour), and 2 trillion searches (annually).
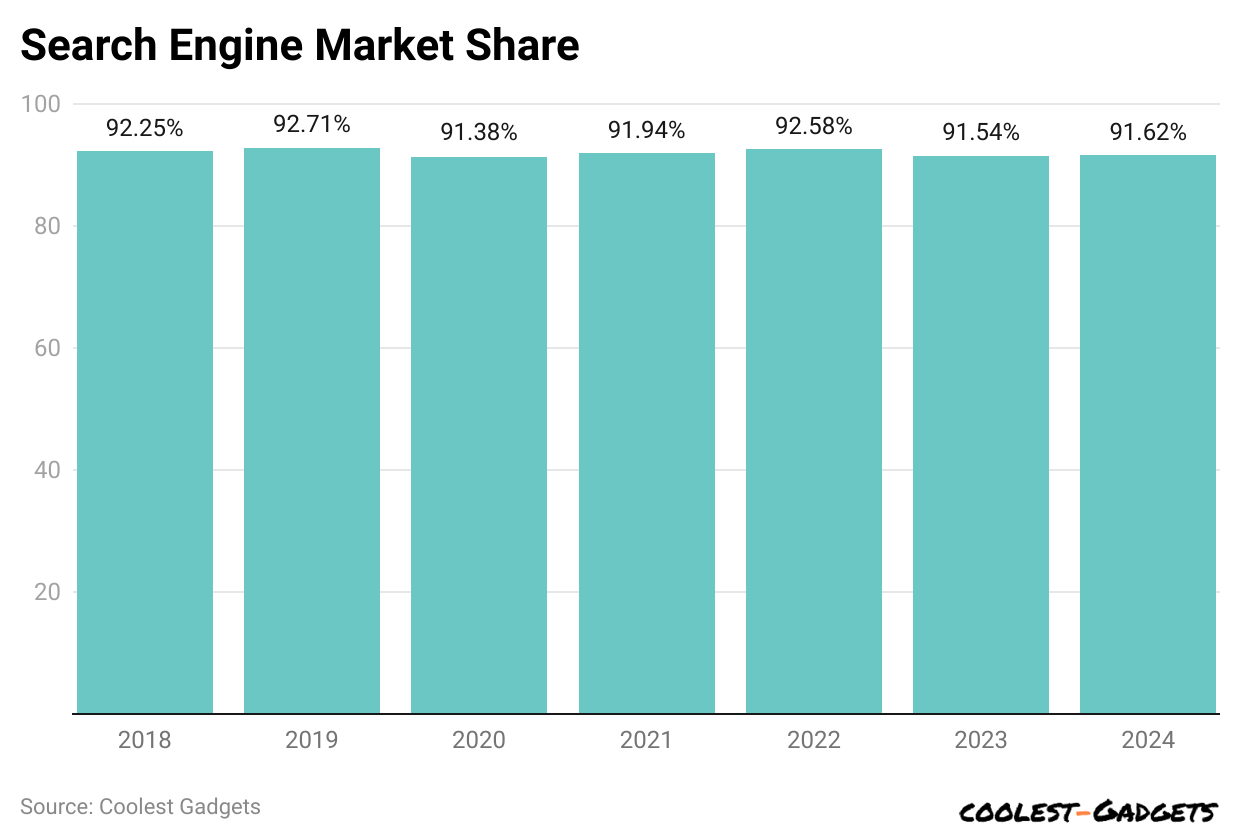
Google Search Engine Statistics
(Reference: demandsage.com)
- DemandSage published a report stating that in 2023, Google’s search engine market share accounted for 91.54%.
- The market share of Google search engines is expected to rise from the previous year to 91.62% by 2024.
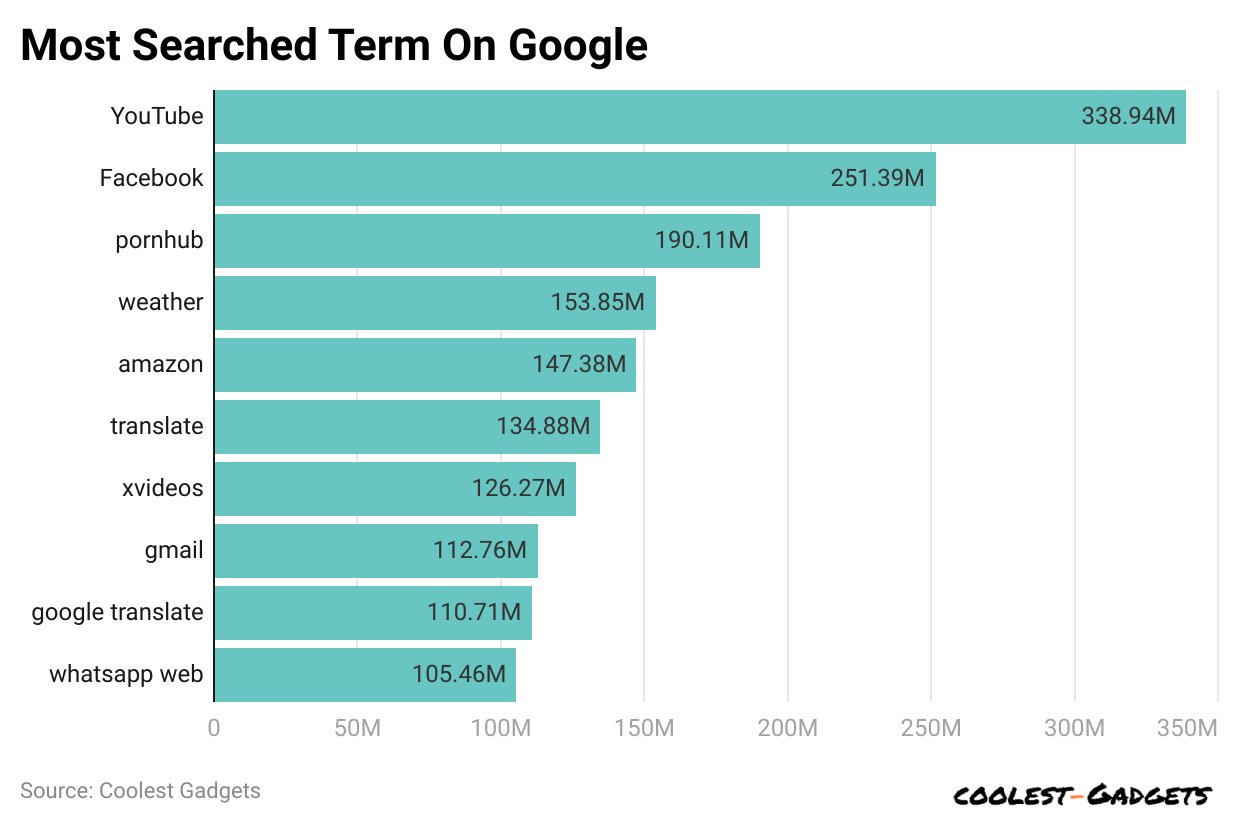
By The Most Searched Term
(Reference: demandsage.com)
- The most searched term on Google in January 2024 was YouTube, with 38.94 million monthly volumes.
- Meanwhile, other search terms volume by month volume is Facebook (251.39 million), Porn Hub (19.11 million), weather (153.85 million), Amazon (147.38 million), translate (134.88 million), xvideos (126.27 million), Gmail (112.76 million), Google translate (110.71 million), and Whatsapp Web (105.46 million).
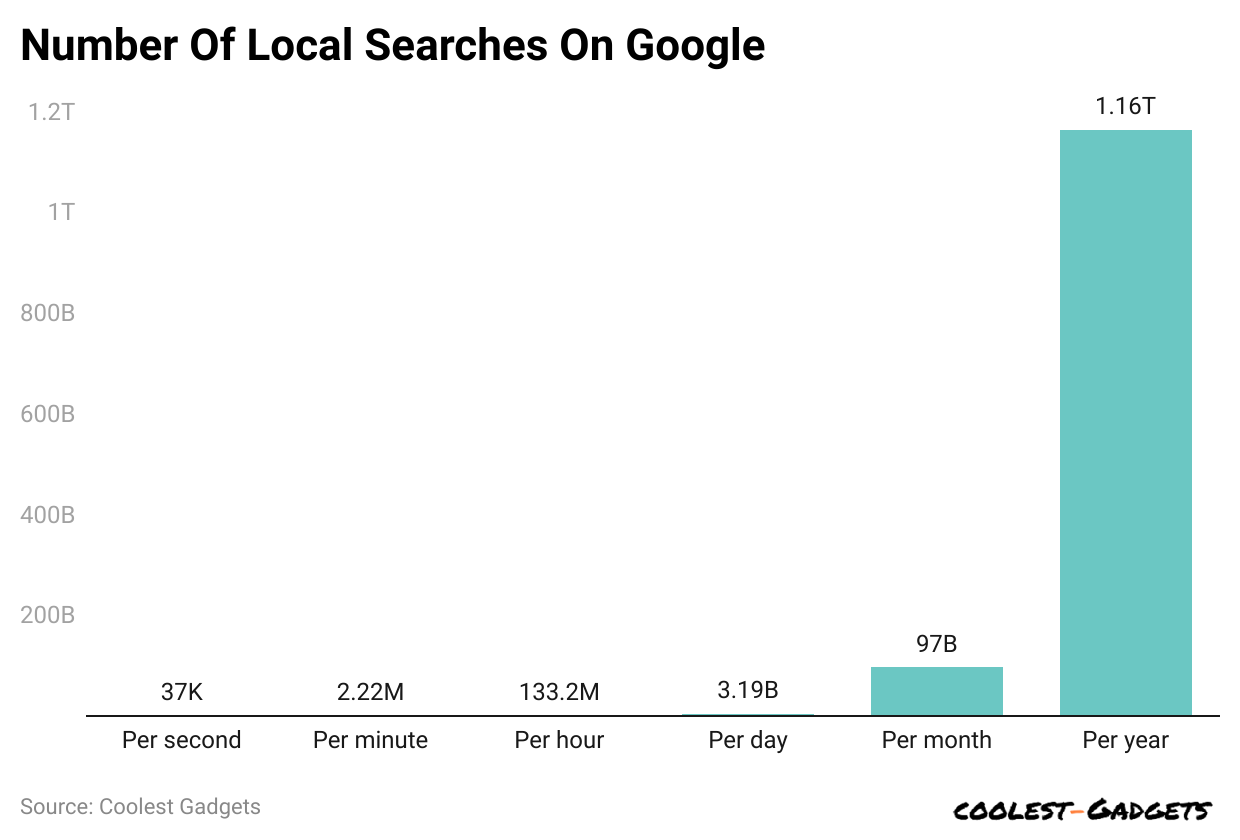
Google Local Searches Statistics By Time Frame
(Reference: demandsage.com)
- Yearly local searches on Google will account for 1.164 trillion.
- Other top local searches are observed monthly (97 million) and per day (3.19 billion).
- The remaining time frames are per hour (133.2 million), per minute (2.22 million), and per second (37,000).
By Keyword Distribution
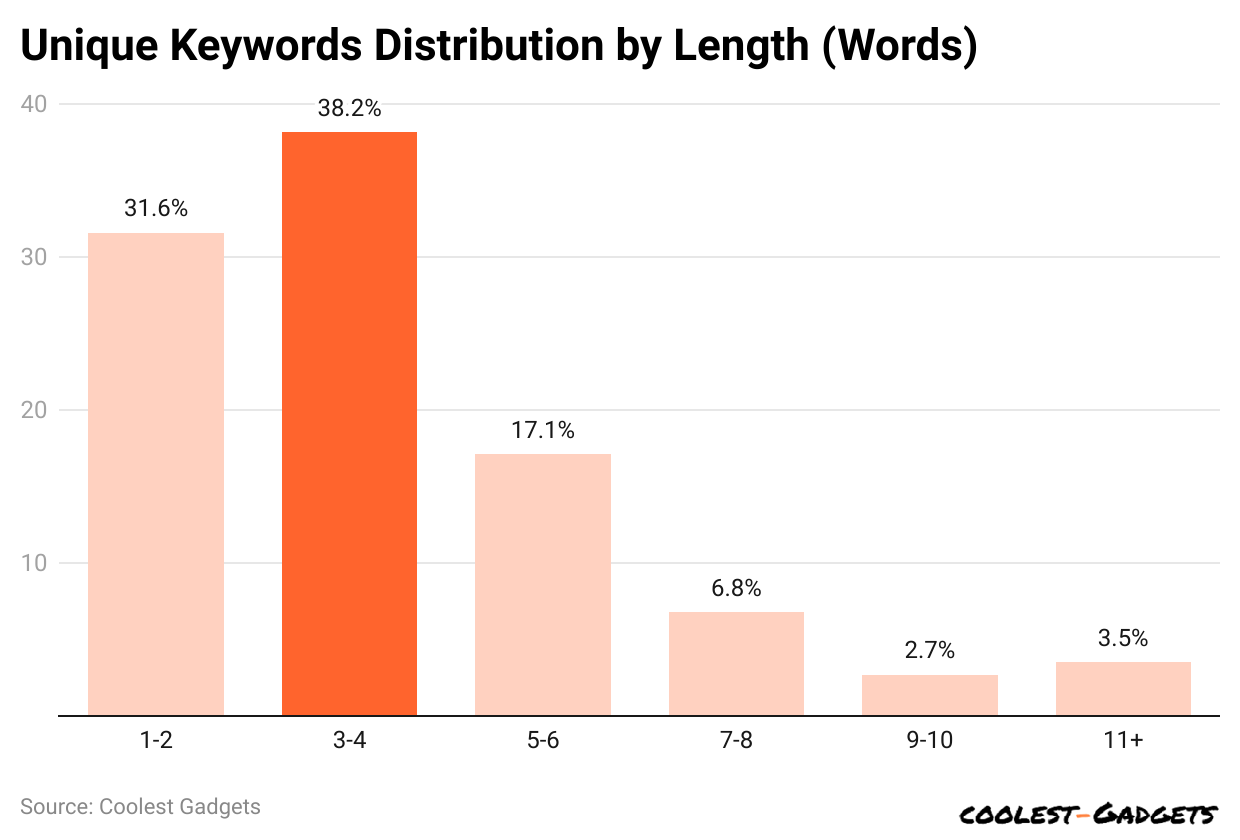
(Reference: techopedia.com)
- The maximum number of Google queries are with 3 to 4 words, accounting for a share of 38.2%.
- Other keyword distributions are 1 to 2 words (31.6%), 5 to 6 words (17.1%), 1 to 2 words (31.6%), 7 to 8 words (6.8%), 9 to 10 words (2.7%), and more than 11 words (3.5%).
Google Searches Users’ Decisions Per Second.
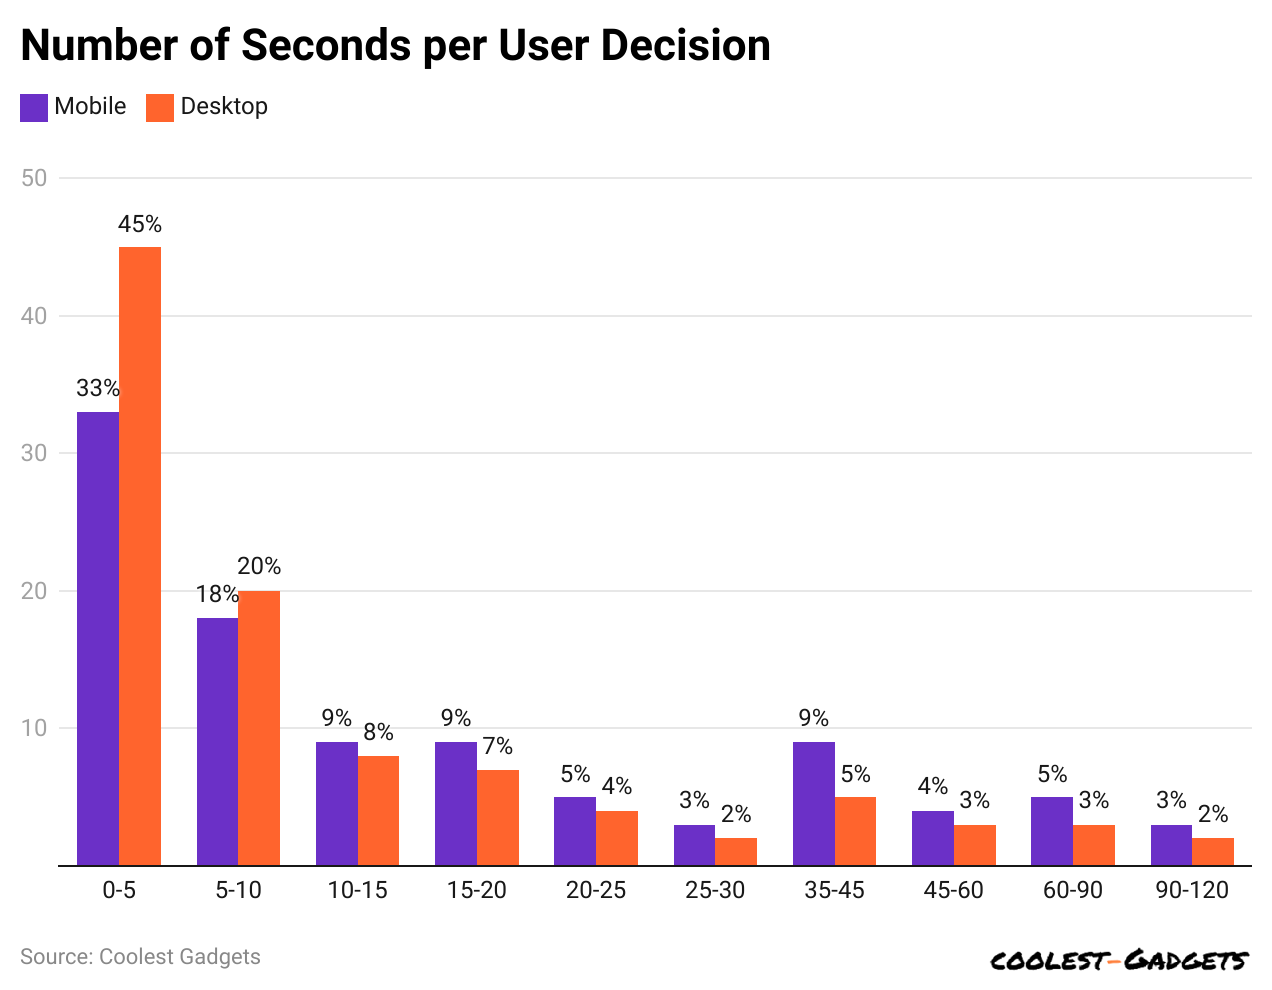
(Reference: techopedia.com)
- 33% of mobile and 45% of desktop users make decisions within 0-5 seconds.
- Other numbers of seconds per mobile and desktop user decision are 5 to 10 sec (18% and 20% ), 10 to 15 sec (9% and 8%), 15 to 20 sec (9% and 7%), 20 to 25 sec (5% and 4%), 25 to 30 sec (3% and 2% ), 30 to 45 sec (9% and 5%), 45 to 60 sec (4% and 3%), 60 to 90 sec (5% and 3%), and 90 to 120 sec (3% and 2%) respectively.
Google Search Result Position By CTR Rate
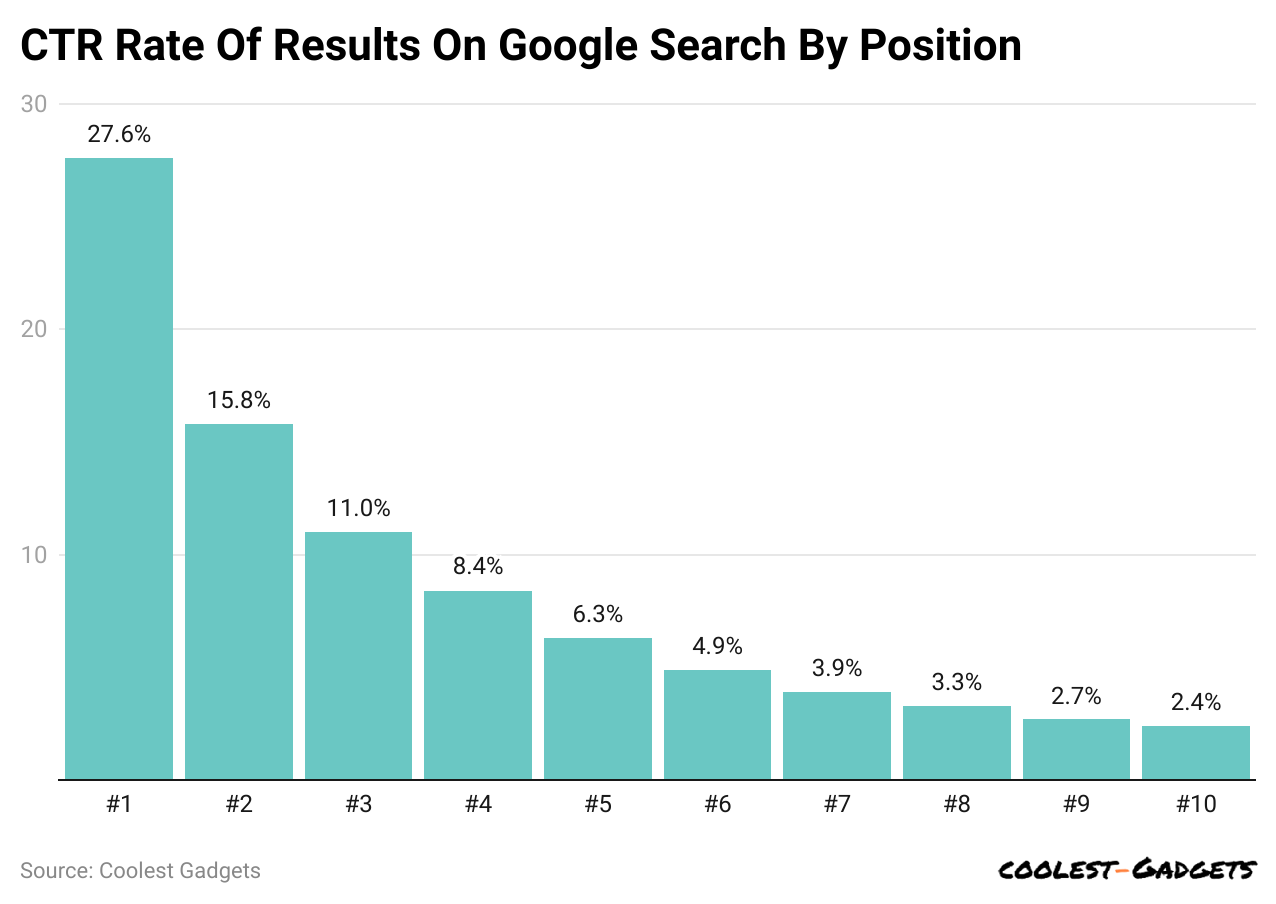
(Reference: demandsage.com)
- #1 position on Google’s search results in 27.6% average click-through rate.
- A huge difference has been observed in the CTR of other positions of Google search are #2 (15.8%), #3 (11%), #4 (8.4%), #5 (6.3%), #6 (4.9%), #7 (3.9%), #8 (3.3%), #9 (2.7%), and #10 (2.4%).
By Voice Search
- As of January 2024, nearly 500 million users were using Google Assistant.
- Almost 36% of digital assistants preferred using Google Assistant.
- In 2023, the most popular voice assistant in the United States of America was used by 85.4 million users.
- By the end of 2024, it is expected to reach 88.7 million users in the U.S.
- It has been analyzed that Google Assistant correctly answered 87.9% of queries.
Google Home Device Statistics By Users
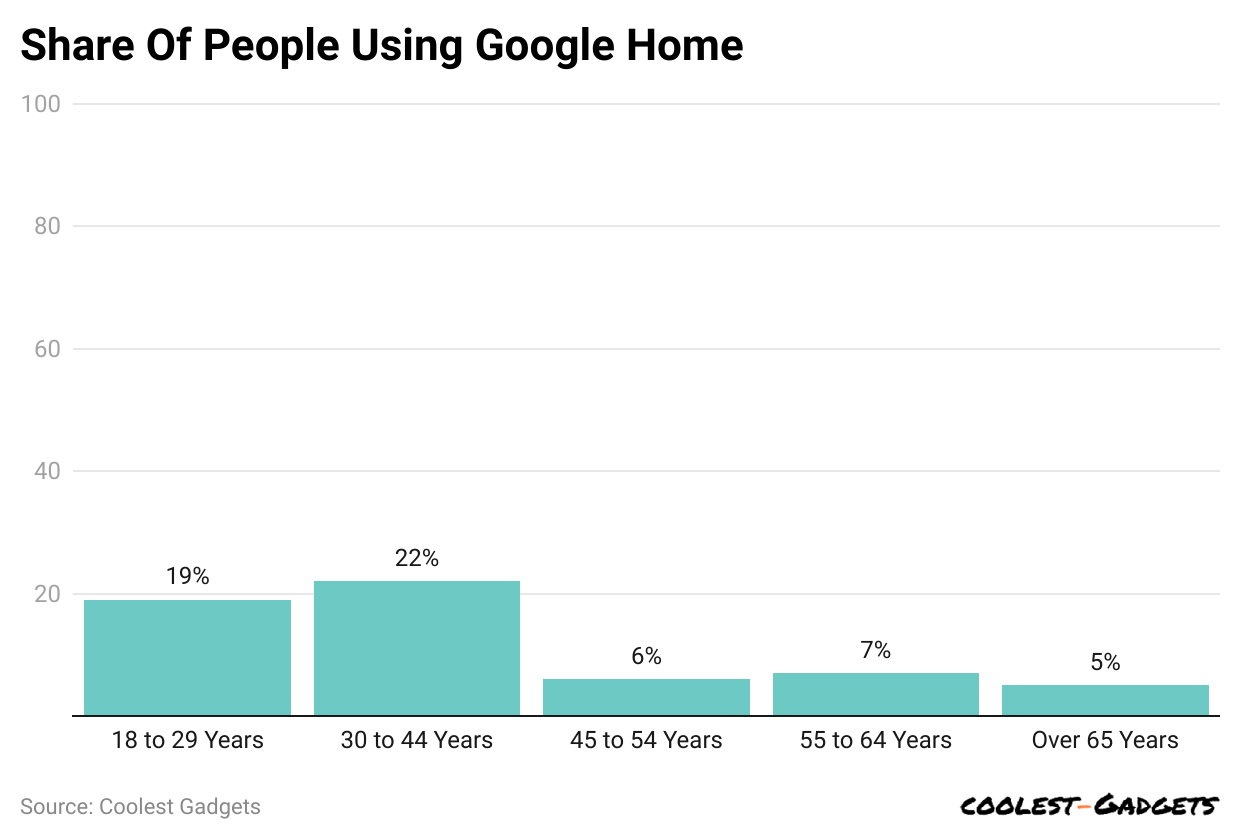
(Reference: demandsage.com)
- In the U.S., 22% of Americans preferred using Google Home in January 2023, aged between 30 and 44 years.
- Other shares of people using Google Home by age group are 19% (18 to 29 years), 6% (45 to 54 years), 7% (55 to 64 years), and 5% (over 65 years).
You May Also Like To Read
- Apple Customer Loyalty Statistics
- Apple Smartphone Statistics
- Apple MacBook Statistics
- Google Smartphone Statistics
- (Advanced Micro Devices) AMD Statistics
- Xiaomi Smartphone Statistics
By Desktop Search Engine
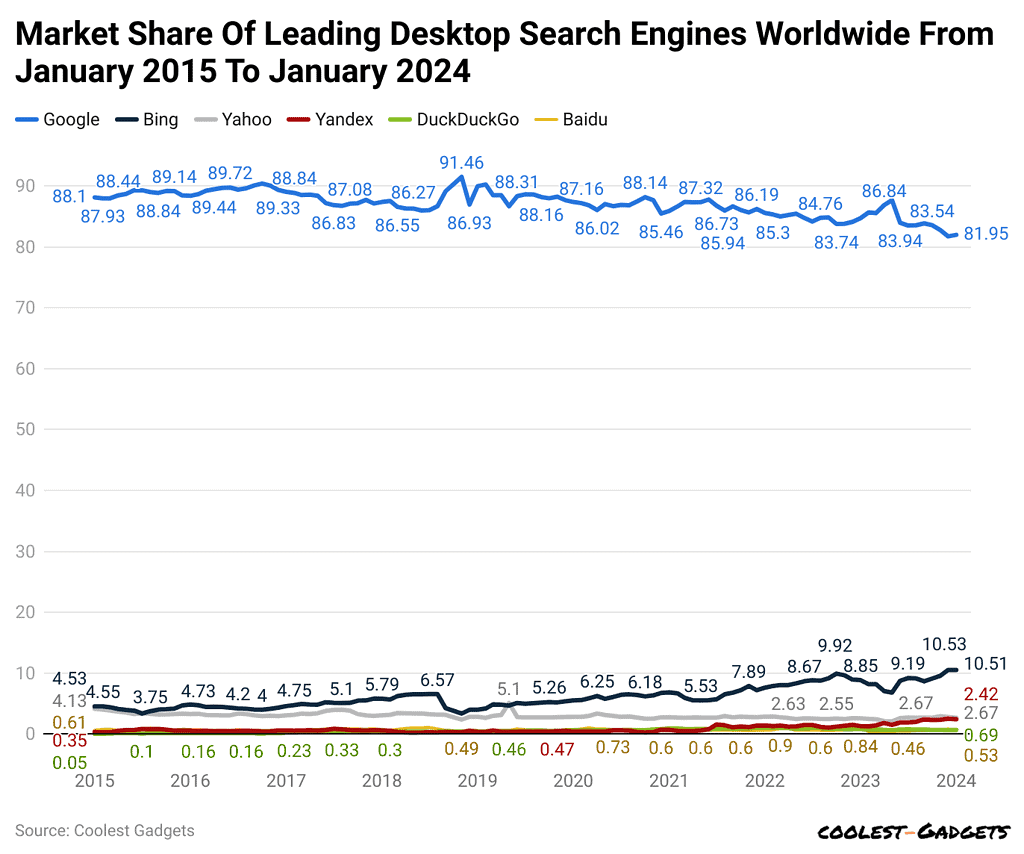
(Reference: statista.com)
- As of the above graph analyses, in January 2024, the market share of Google’s desktop search engines was 81.71%.
- In 2023, monthly market share of Google’s desktop search engines is followed by January (84.69%), February (85.64%), March (85.5%), April (86.84%), May (87.65%), June (83.94%), July (83.49%), August (83.53%), September (83.84%), October (83.54%), November (82.75%), and December (81.71%).
By Country
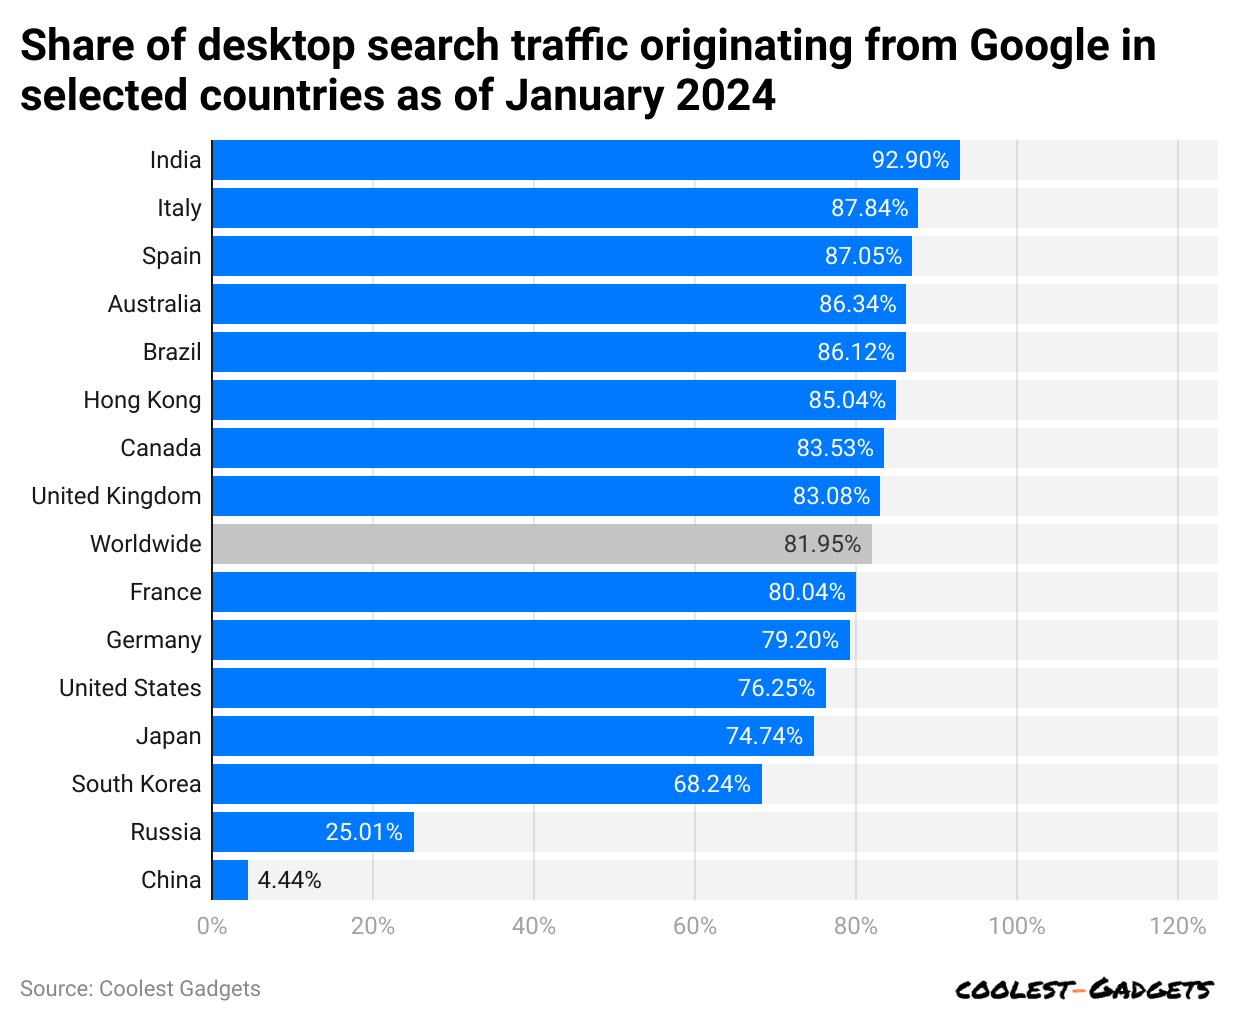
(Reference: statista.com)
- Google’s desktop search traffic market remained highest in India, with a market share above 92% in January 2024.
- Furthermore, the desktop search traffic market share of Google by countries is followed by Italy (87.84%), Spain (87.05%), Australia (86.34%), Brazil (86.12%), Hong Kong (85.04%), Canada (83.53%), the United Kingdom (83.08%), France (80.04%), Germany (79.2%), the United States (76.25%), Japan (74.74%), South Korea (68.24%), Russia (25.01%), and China (4.44%).
Google Play Store Statistics By Applications
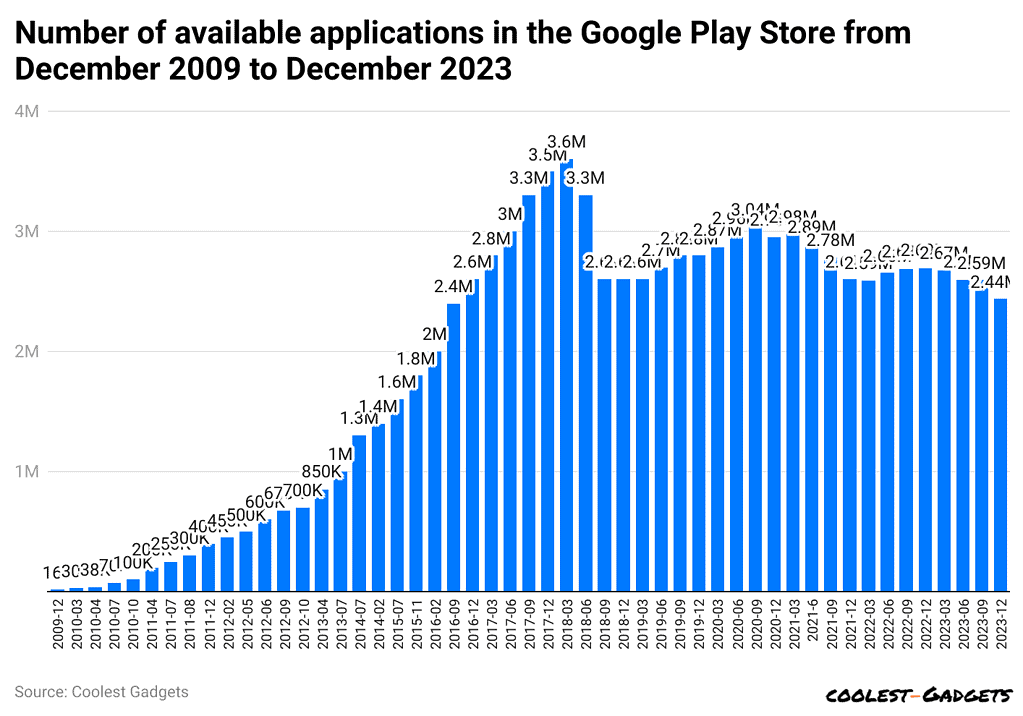
(Reference: statista.com)
- According to a Statista report analysis, in March 2023, the total number of applications available in Google was 2.67 million, a decrease from the previous year.
- In the same year, the quarterly availability of apps was Q2 (2.59 million), Q3 (2.59 million), and Q4 (2.43 million).
By Category
- Google Statistics states that in the second quarter of 2024, the Google Play Store offered a diverse range of applications, including games (11.7%), education (11.5%), and business (6.4%).
- Furthermore, other categories of app share were entertainment (6.0%), lifestyle (5.9%), tools (5.8%), music and audio (5.4%), personalisation (5.3%), health and fitness (4.3%), and productivity (3.9%).
- Q2 of 2024, the Google Play Store offered approximately 2.26 million apps across various categories.
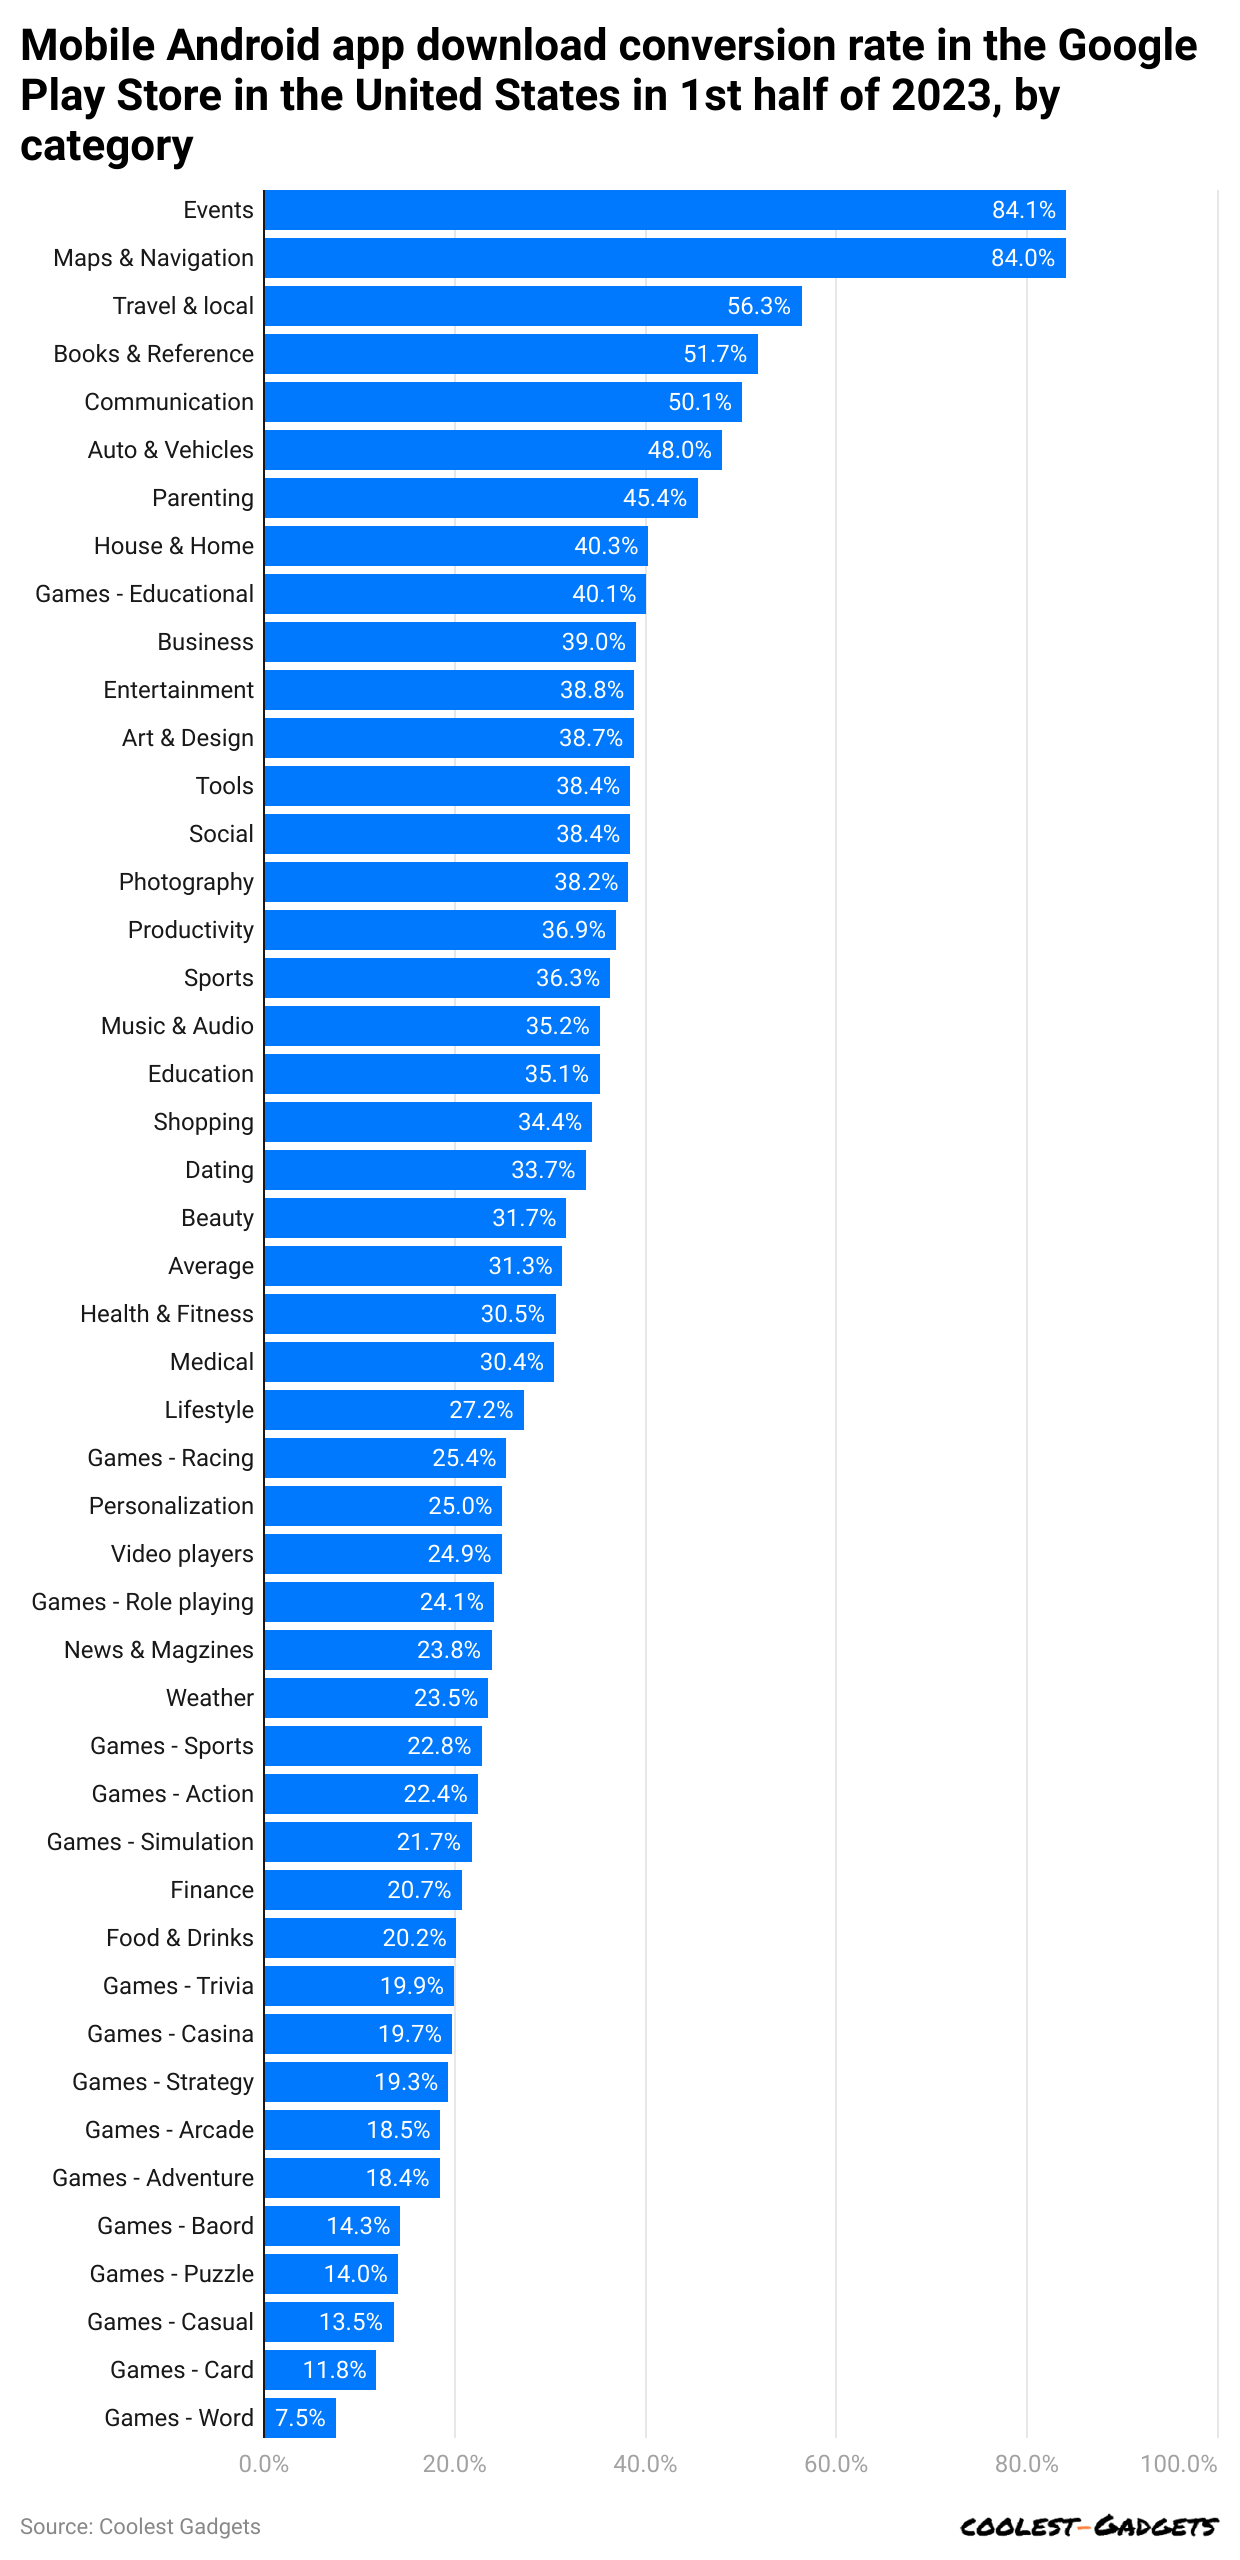
(Reference: statista.com)
- In the 1st half of 2023, Android mobile apps’ highest download conversion rate in the Google Play Store in the United States was Events, Maps, and Navigation, accounting for 84.1% and 84%, respectively.
- Meanwhile, other categories wise app downloaded conversion rate is Travel and Local (56.3%), Books and Reference (51.7%), Communication (50.1%), Auto and Vehicles (48%), Parenting (45.4%), House and Home (40.3%), Games-Education (40.1%), Business (39%), Entertainment (38.8%), Art and Design (38.7%), Tools (38.4%), Social (38.4%), Photography (38.2%), Productivity (36.9%), Sports (36.3%), Music and Audio (35.2%), Education (35.1%), Shopping (34.4%), Dating (33.7%), Beauty (31.7%), Average (31.3%), Health and Fitness (30.5%), Medical (30.4%), Lifestyle (27.2%), Games-Racing (25.4%), Personalization (25%), Video players (24.9%), Games-Role playing (24.1%), New and Magazines (23.8%), Weather (23.8%), Finance (20.7%), Food and Drinks (20.2%)Games: Sports (22.8%), Action (22.4%), Simulation (21.7%), Trivia (19.9%), Casino (19.7%), Strategy (19.3%), Arcade (18.5%), Adventure (18.4%), Board (14.3%), Puzzle (14%), Casual (13.5%), Card (11.8%), and Word (7.5%).
(Reference: bigohtech.com)
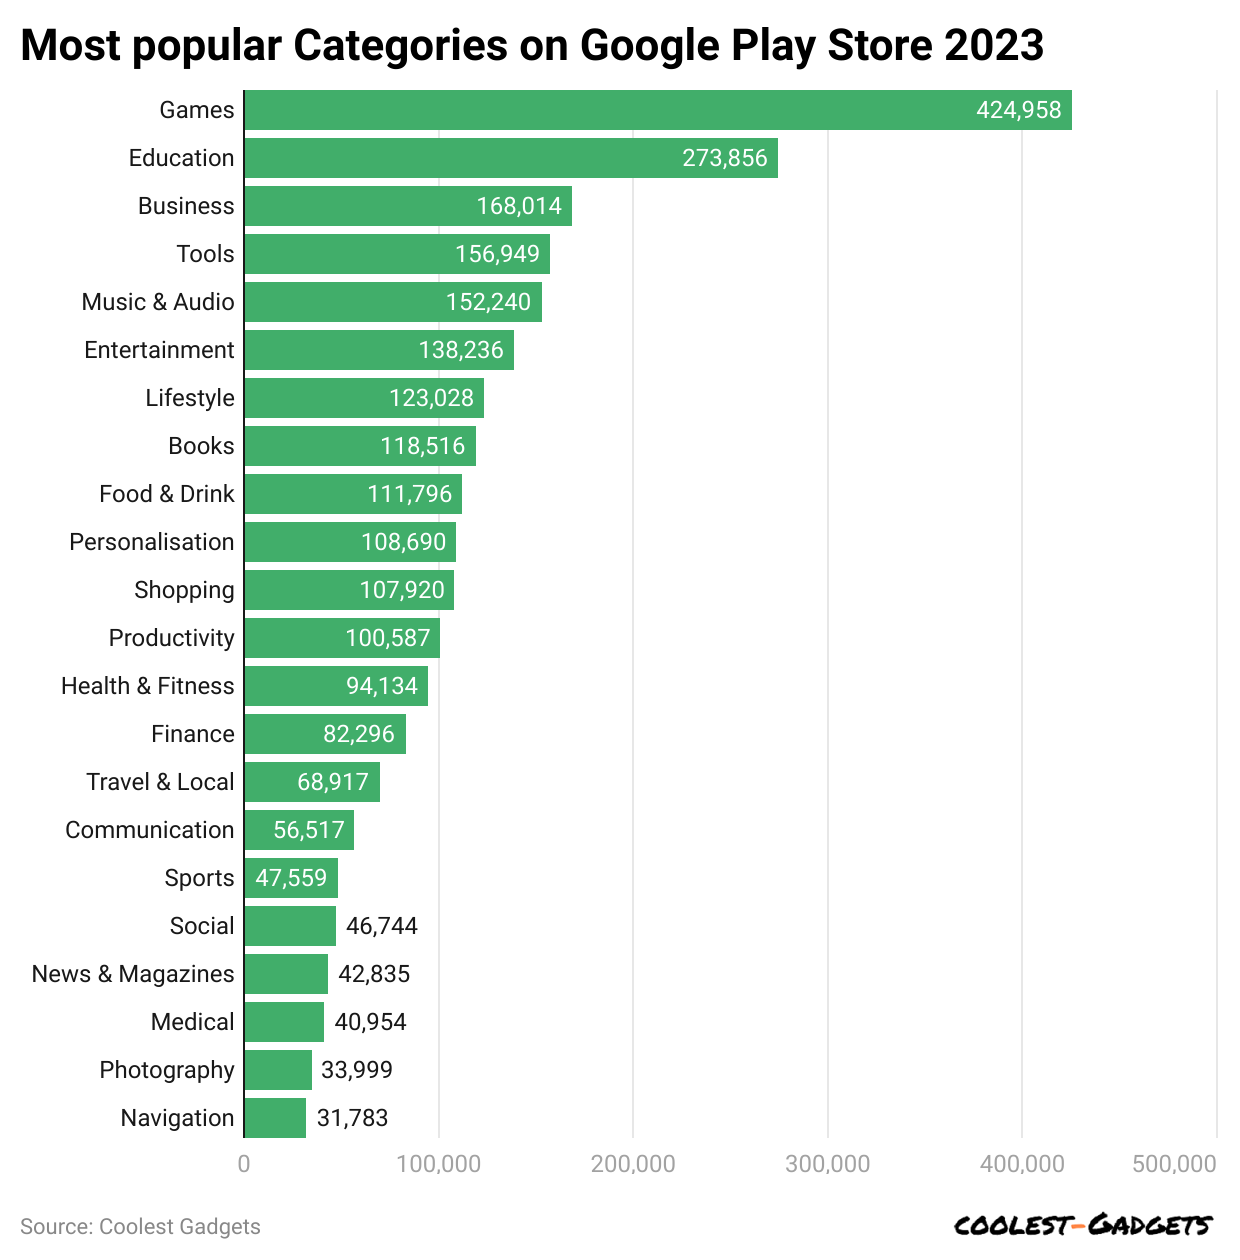
- The total number of apps available on Google Play Store in March 2023 are Games (424958), Education (273856), Business (168014), Tools (156949), and Music and Audio (152240).
- Others are Entertainment (138236), Lifestyle (123028), Books (118216), Food and Drinks (111796), Personalization (108690), Shopping (107920), Productivity (100587), Health and Fitness (94134), Finance (82296), Travel and Local (68917), Communication (56517), Sports (47559), Social (46744), News and Magazines (42835), Medical (40954), Photography (33999), and Navigation (31783).
(Reference: statista.com)
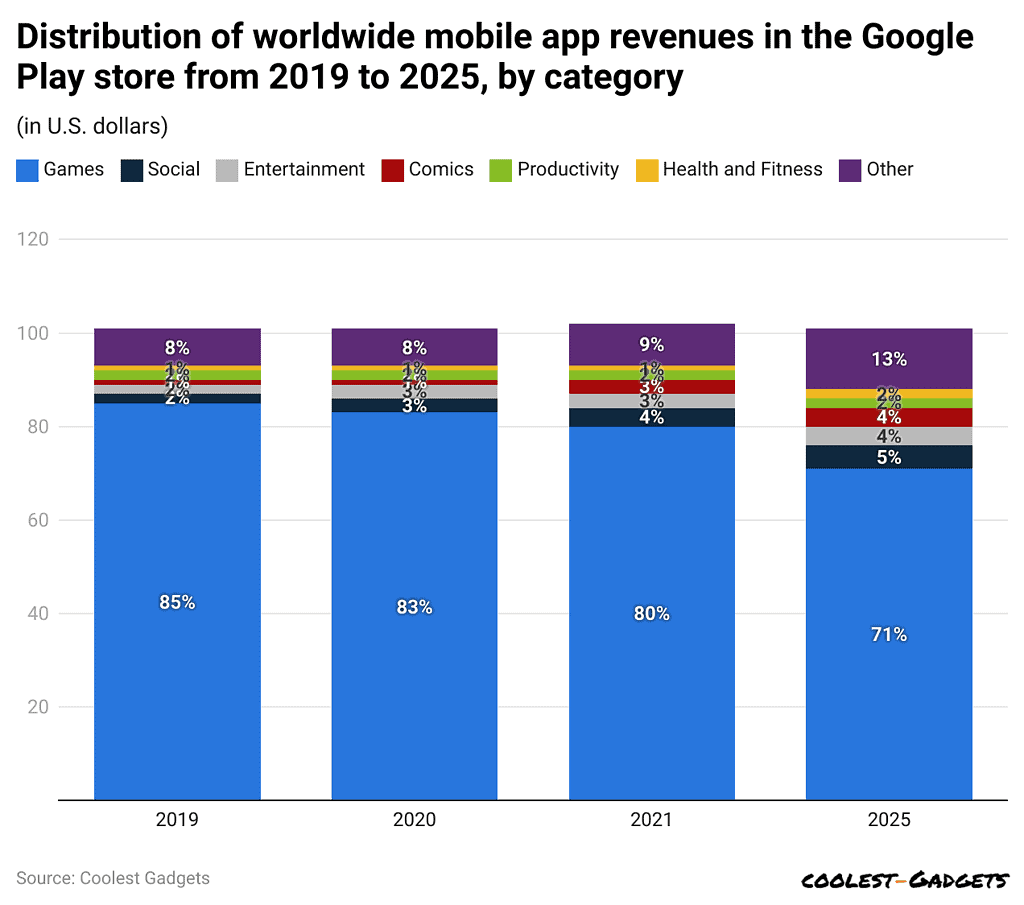
- The estimated global Google Play app revenue share in 2025 will remain highest in the Games category at 71%.
- Other categories of revenue shares of apps are Social (5%), Entertainment (4%), Comics (4%), Productivity (2%), Health and Fitness (2%), and Others (13%).
Google Bard Statistics
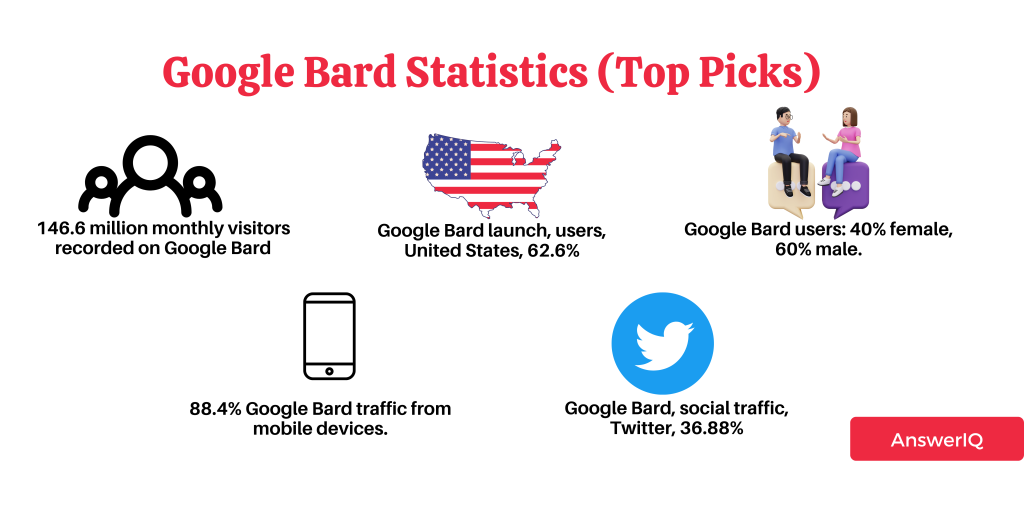
- In February 2024, Bard was rebranded as Gemini, and its search base averaged approximately 220 million monthly visitors.
- Moreover, users from over 230 countries and territories accessed the chatbot.
(Source: answeriq.com)
- In 2023, the average monthly users of the Google brand was 142.4 million.
- The United States gained 62.6% of users when it was first launched.
- Based on gender, users of Google Bard are 60% female and 40% male.
- Traffic generated by mobiles turned out to be 88.4%.
- Google Bard is available in around 43 languages.
- The largest segment, 35%, was aged between 25 and 34 years; the 18 to 24 age group followed.
- The United States accounted for 15.94% of traffic, while India contributed 10.38%.
- Accessible in over 230 countries and territories.
By country
(Source: answeriq.com)
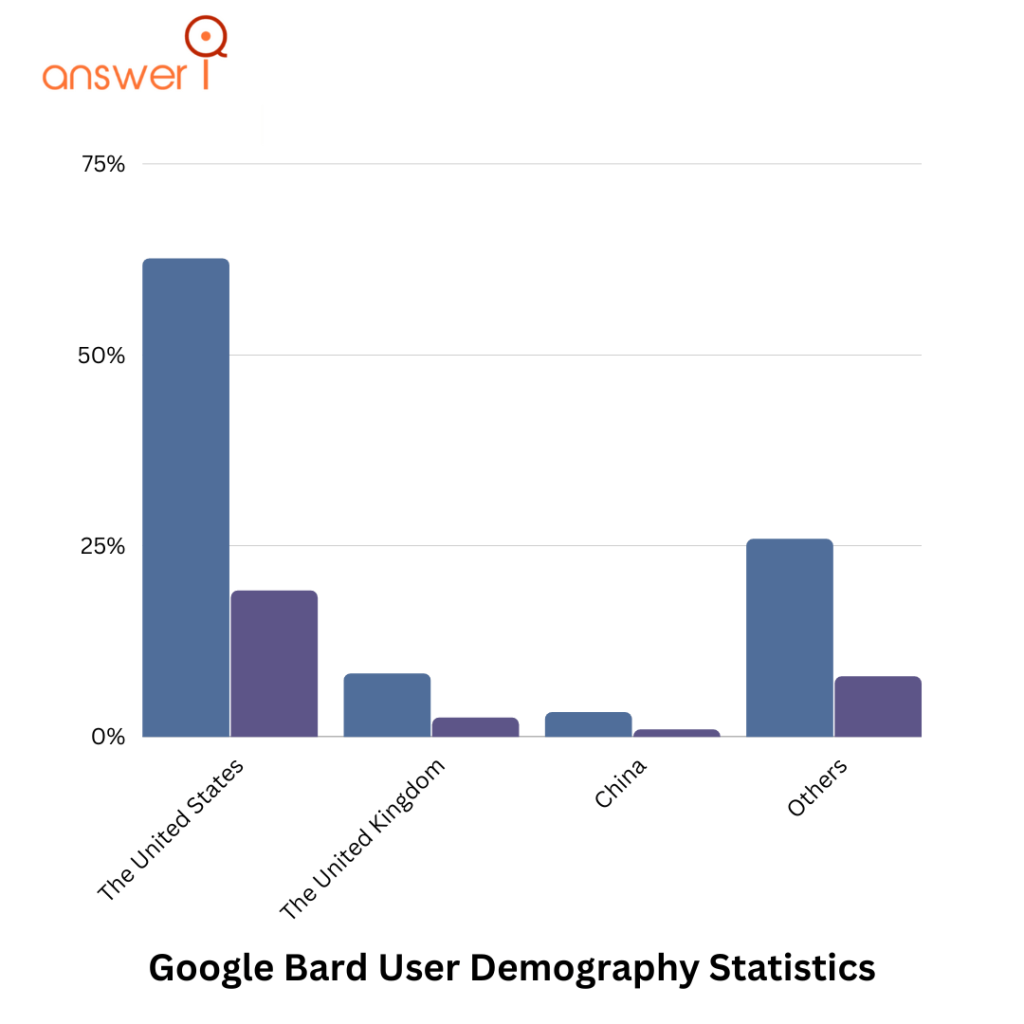
- The most traffic to Google Bard worldwide comes from the United States, with 21.66% share and 19.15 million users in 2023.
- Country-wise, the total number of users and shares in Google Bard are the United Kingdom (2.53 million and 8.29%), China (0.98 million and 3.22%), and others (7.29 million and 25.89%), respectively.
- The maximum number of users of Google Bard ranges from 25 to 34 years, with a share of 32.79%.
- Other user share is represented as 25.24% (18 to 24 years), 35 to 44 years (19.24%), 45 to 55 years (12.29%), 55 to 64 years (6.58%), and above 65 years (3.85%).
By Category
(Source: answeriq.com)
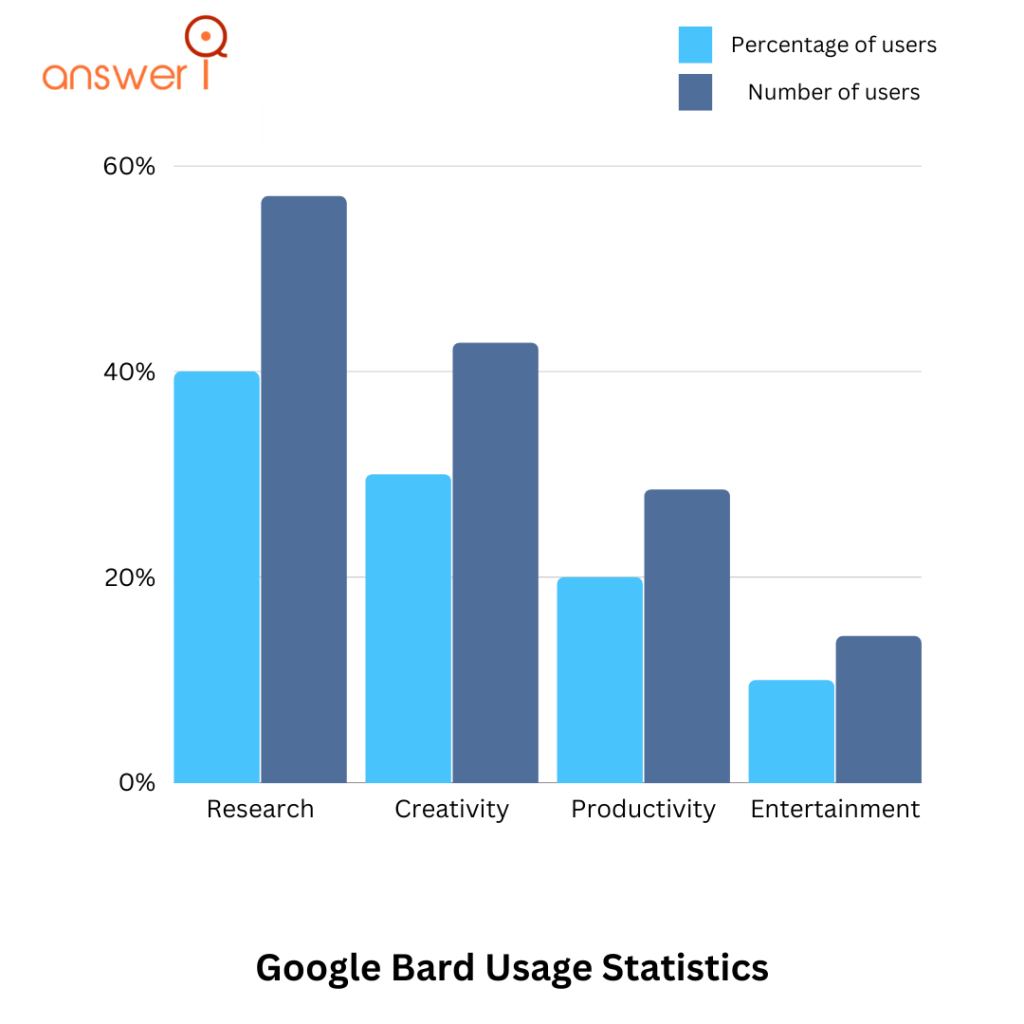
- Currently, 57.04 million people use Google Bard for research, resulting in a user share of 40%.
- Category-wise, the number of users and shares is followed by Creativity (42.78 million and 30%), Productivity (28.52 million and 20%), and Entertainment (14.26 million and 10%), respectively.
By Website Traffic
(Source: similarweb.com)
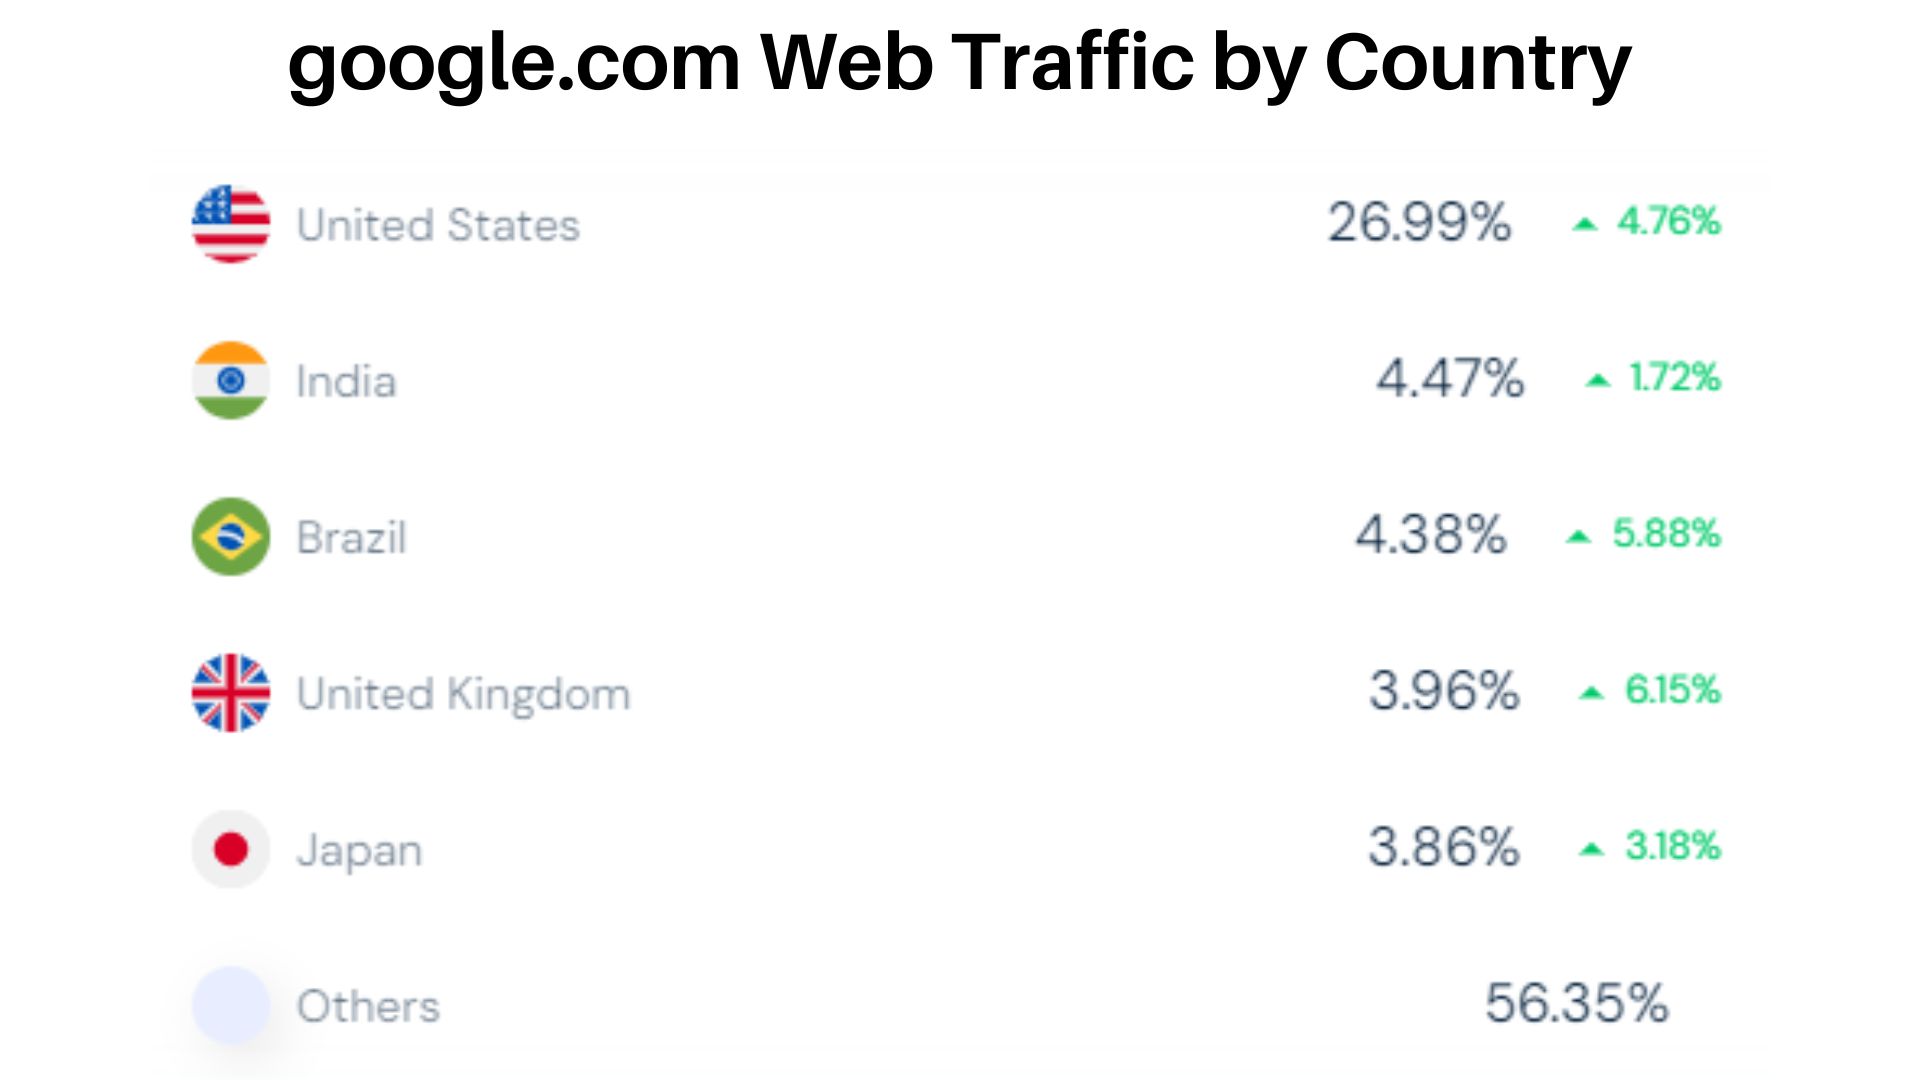
- In January 2024, the United States contributed 26.99% of all traffic on Google.com, with a 4.76% rise in website visitors.
- India had the highest share, 47% of total traffic, which increased by 1.72%. Brazil followed with 4.38%, showing a 5.88% growth.
- The United Kingdom accounted for 3.96% of traffic, gaining 6.15%, while Japan contributed 3.86%, with a slight rise of 0.18%.
- All other countries together made up 56.35% of Google.com’s total traffic.
By Device Traffic
(Reference: semrush.com)
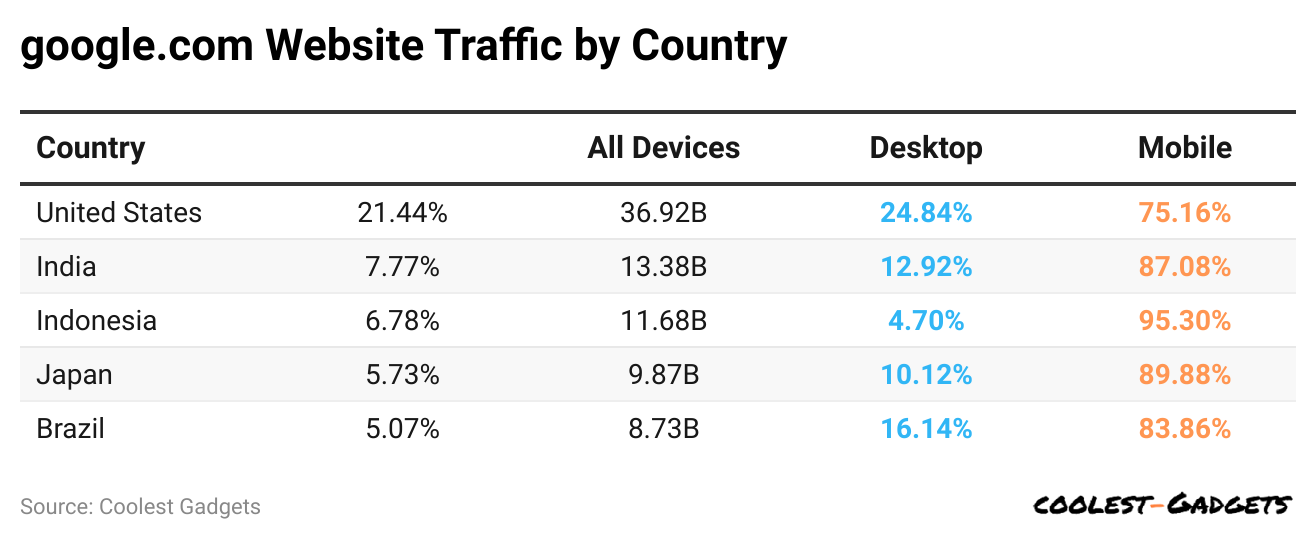
- In the same duration, desktop and mobile device traffic of google.com accounted for 17.77% and 82.23%, respectively.
- The United States holds the highest traffic at 21.44%, resulting in 36.92 billion, in which desktop and mobile visitors have a share of 24.84% and 75.16%, respectively.
- Other countries’ device traffic are India = 7.77% (13.38 billion), Indonesia = 6.78% (11.68 billion), Japan = 5.73% (9.87 billion), and Brazil = 5.07% (8.73 billion).
- Country-wise desktop and mobile visitors shares are India = (12.92% and 87.08%), Indonesia = (4.7% and 95.3%), Japan = (10.12% and 89.88%), and Brazil = (16.14% and 83.86%,) respectively.
By Demographics
(Reference: similarweb.com)
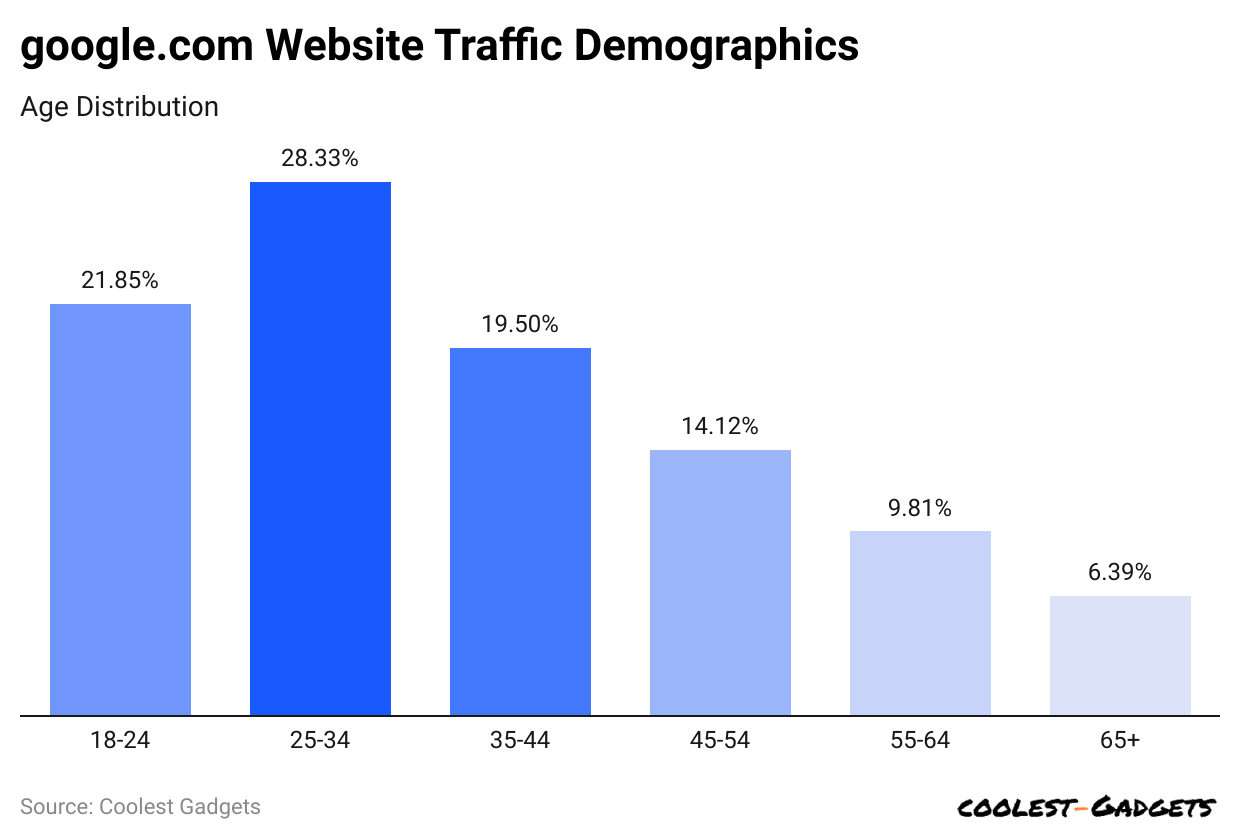
- According to Google Statistics, the highest number of users observed on google.com is between 25 and 34 years old, accounting for 28.33% of the share.
- Around 21.85% of website users are between 18 and 24 years old.
- 5% and 14.12% belong to 35 – 44 years and 45 – 54 years age groups, respectively.
- 81% of users are aged between 55 and 64 years.
- And 6.39% of users are from the age group above 65 years.
- The gender share of Google.com users is 57.23% male and 42.77% female.
By Traffic Sources
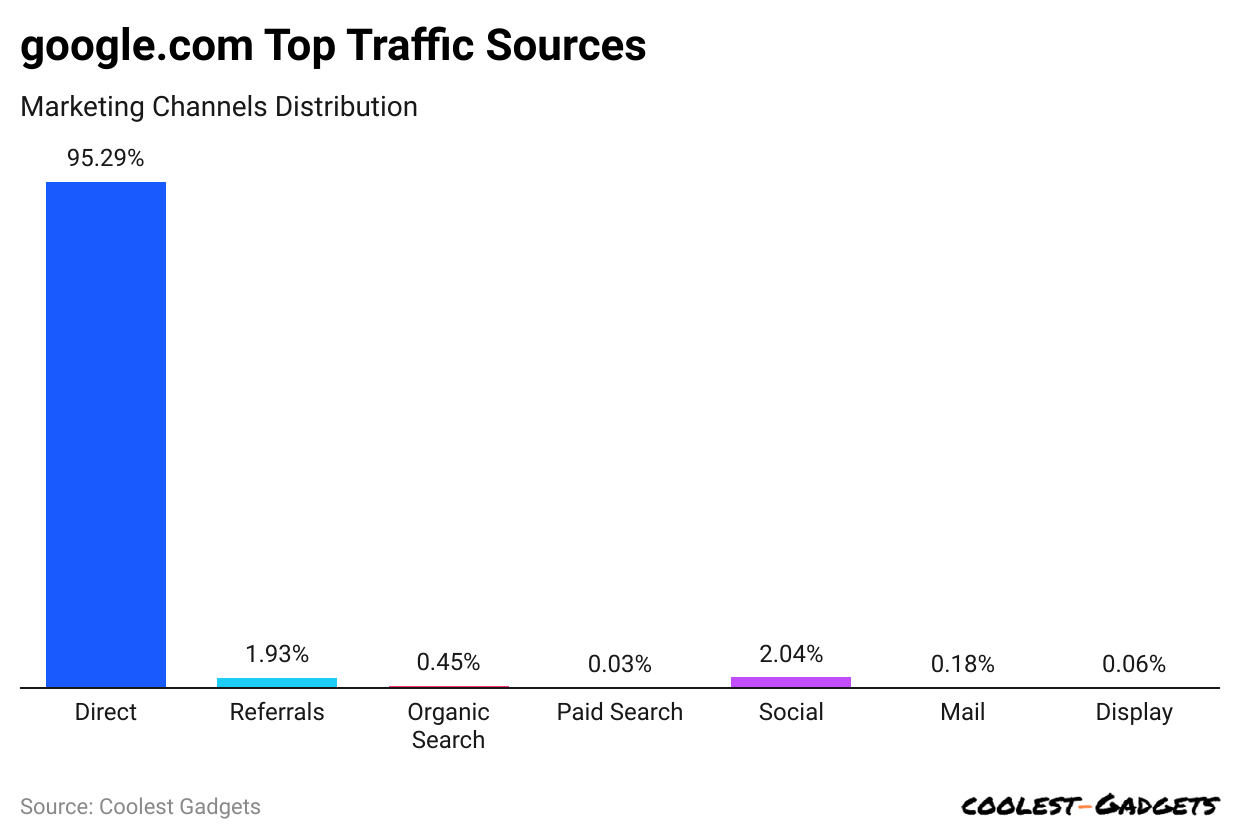
(Reference: similarweb.com)
- Direct search accounted for the highest traffic rate towards google.com, resulting in 95.29% desktop visits.
- Meanwhile, 2.04% share via social traffic, followed by referral search with 1.93%.
- Furthermore, other traffic sources towards google.com are organic search (0.45%), mail (0.18%), paid search (0.03%), and display (0.06%).
By Social Media Traffic
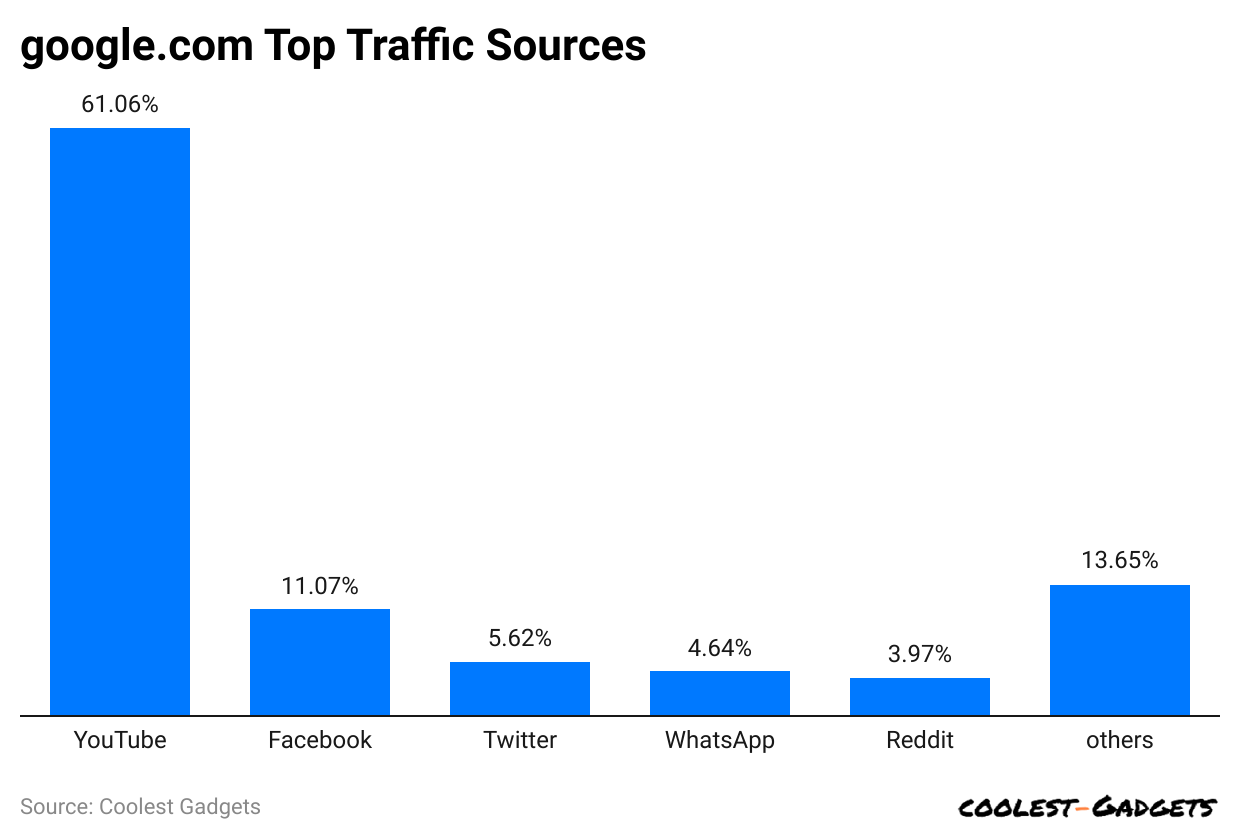
(Reference: similarweb.com)
- YouTube drives the most traffic to Google, contributing 61.06% of social media referrals.
- Facebook accounts for 11.07% of the traffic, while Twitter accounts for 5.62% of the traffic.
- WhatsApp follows with a 4.64% share, and Reddit sends 3.97% of users.
- Other social media platforms together make up the remaining 13.65%.
Conclusion
After completing the article on Google Statistics, the Company has changed rapidly over the years, maintaining and creating its differentiation with a competitive advantage by making the fastest and most aggressive moves compared to other companies. This paper has explained all detailed analyses of Google’s products, market share, Google Apps, usage share, etc.
It is also predicted that in the coming year, the market share of the Company is going to increase. If you consider investing in Google, all the above statistics will help you better understand the Google market in 2023 and 2024.
Sources
Joseph D'Souza started Coolest Gadgets in 2005 to share his love for tech gadgets. It has since become a popular tech blog, famous for detailed gadget's reviews and companies statistics. Joseph is committed to providing clear, well-researched content, making tech easy to understand for everyone. Coolest Gadgets is a trusted source for tech news, loved by both tech fans and beginners.