Amazon Statistics By Apps, Demographics, Consumer Trends and Facts

Updated · Dec 27, 2024


TABLE OF CONTENTS
- Introduction
- Editor’s Choice
- General Amazon Statistics
- Amazon Revenue
- Amazon Revenue Breakdown
- Amazon Market Share
- Amazon User Statistics
- Most Downloaded Amazon Apps Worldwide
- Average Monthly Sales of Amazon Sellers Worldwide
- Reasons for Joining Amazon Prime in The US
- Amazon Seller Demographics
- Amazon.com Website Traffic By Country
- Amazon Search Statistics
- Amazon Advertising Statistics
- Amazon Customer Loyalty Statistics
- Most Valuable Retail Brands Worldwide By Brand Value
- Most Profitable Sellers Worldwide By Category
- Top Categories Purchased On Amazon Prime Day Shoppers
- Reasons Online Shoppers Purchased on Amazon
- Largest Internet Companies Worldwide
- Payment Methods Used at Amazon Prime Days
- Share of Amazon Sellers And Brands Using AI
- Conclusion
Introduction
Amazon Statistics: Amazon, a global e-commerce giant, has revolutionized the way people shop and consume, transforming the retail industry in the process. Starting as an online bookstore, Amazon has grown into a powerhouse with unparalleled influence on the global market. In 2023, Amazon achieved nearly 575 billion USD in net sales revenue, demonstrating its immense reach and impact. This success is driven by Amazon’s innovative approach to customer experience, which has redefined standards for online retail and shopping services.
The company has introduced groundbreaking features such as one-click purchasing, personalized recommendations, and customer reviews, enhancing convenience and trust for millions of users. Its vast product catalog and competitive pricing have established Amazon as a go-to platform for shoppers worldwide. Amazon’s business model thrives on multiple revenue streams, including e-retail sales, third-party seller revenue, media subscriptions, and AWS cloud services. Third-party sellers contribute significantly, accounting for approximately 60% of total paid units on Amazon’s marketplace. The Fulfilled-by-Amazon (FBA) program, which offers sellers logistics support from order picking to delivery, has further streamlined operations, distributing about half of the units sold in Amazon’s major markets.
Over 100 strategic mergers and acquisitions have solidified Amazon’s dominance. Notable investments include the 13.7 billion USD acquisition of Whole Foods in 2017 and the recent acquisition of AI startup Perceive in 2024. Amazon’s intense patent activity highlights its focus on innovation, from drone delivery services branded as “Prime Air” to the use of generative AI for personalization and predictive logistics models. Despite economic challenges in 2022 and early 2023, Amazon has shown resilience, with recent financial results indicating a strong recovery and optimistic prospects for 2024.
Editor’s Choice
- According to a report from The State of the Amazon Seller in 2024, nearly 50% of Amazon businesses have implemented AI to manage their operations.
- Currently, Amazon Statistics show that there are more than 300 million customers around the world.
- 54% of businesses on the platform said they will try new marketing strategies in 2024, supporting it, and 20% said they are looking forward to investing in TV and radio advertising.
- A large share of Amazon sellers are based in the US, contributing 55%. However, showing a major difference, the United Kingdom follows with merely 7%, Canada at 6%, and India at 5%.
- As of July 2024, Amazon Shopping, Amazon Prime Video, and Amazon Alexa are the most downloaded apps worldwide, with total downloads amounting to 3,30,54,065.
- Debit and credit cards were the most common methods of completing a purchase on Amazon during Amazon Prime days in the US in 2024, contributing 52.2% and 45.9%, respectively.
- According to a survey by Statista, the most common reason to join Amazon is free shipping, with 79.9% of respondents voting it as ‘most important’.
- The majority of Amazon sellers, on average, around 31% of sellers—earn less than $500. Furthermore, 22% said they earn $1,001- $5,000.
- This Commerce company is the most valuable retail brand in the world, with a brand value of 185 billion US dollars.
- In 2024, Amazon held around 50% of the U.S. e-commerce market, with revenue from North America estimated at approximately $400 billion.
You May Also Like To Read
- Amazon Buy Box Statistics
- Amazon Prime Video Statistics
- Xiaomi Statistics
- Lenovo Statistics
- Asus Statistics
- Toshiba Statistics
- Intel Statistics
- Dell Statistics
- HP (Hewlett-Packard) Statistics
- Philips Statistics
- Apple Statistics
- Google Statistics
- Sony Statistics
- Microsoft Statistics
- Airbnb Statistics
- Google Revenue Statistics
- Tencent Statistics
General Amazon Statistics
- According to a report from The State of the Amazon Seller in 2024, nearly 50% of Amazon businesses have implemented AI to manage their operations.
- 54% of businesses on the platform said they will try new marketing strategies in 2024, supporting it, and 20% said they are looking forward to investing in TV and radio advertising.
- On average, amazon.com receives more than 2.7 billion traffic every month.
- 50% of shoppers prefer Amazon for their online product research.
- Currently, Amazon Statistics show that there are more than 300 million customers around the world.
- US sellers sell around 7,800 products on Amazon per minute.
- There are more than 500,000 brands registered in the Amazon Brand Registry.
- Amazon Statistics shows that 60% of Amazon sales belong to third-party sellers.
- The United States is the biggest market for Amazon.
- Every day, around 3,700 sellers register their business on Amazon.
Amazon Revenue
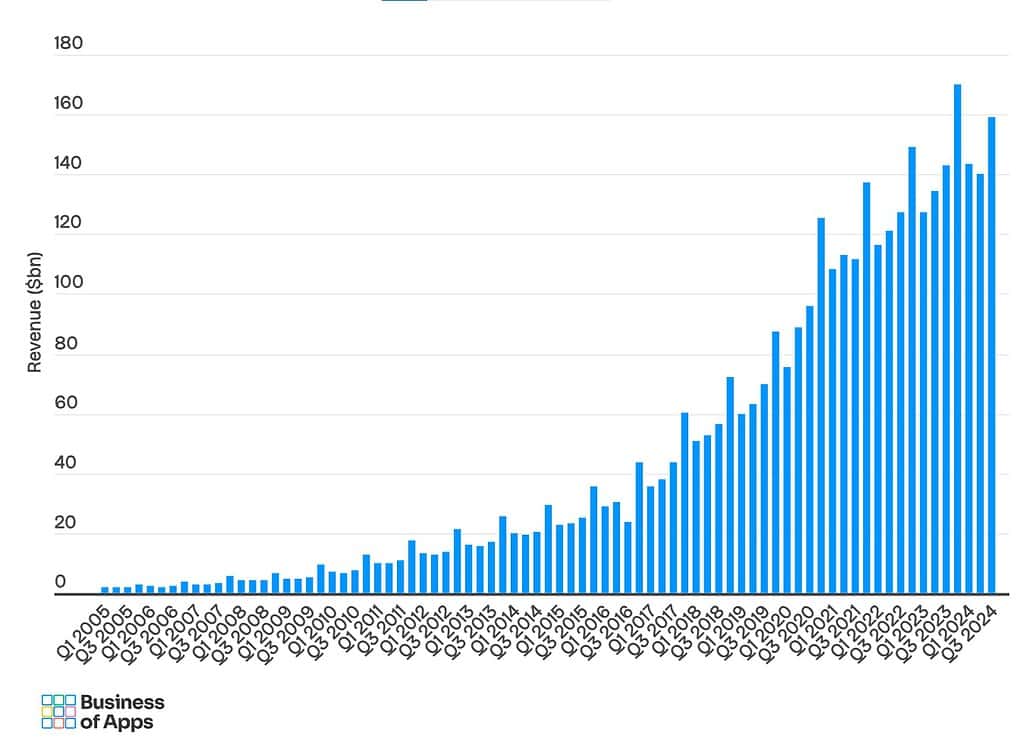
- In 2023, Amazon’s revenue increased by 11.9% to USD 574.9 billion.
- In 2022, Amazon’s revenue was USD 513.9 billion.
- In 2021, Amazon generated USD 470.8 billion in revenue.
- In 2005, Amazon’s revenue was USD 8.4 billion.
- Amazon is the third-largest public company by revenue globally, following Walmart and China’s State Grid.
Amazon Revenue 2005 to 2023 (USD Billion)
| Year | Revenue ($bn) |
|---|---|
| 2005 | 8.4 |
| 2006 | 10.7 |
| 2007 | 14.8 |
| 2008 | 19.1 |
| 2009 | 24.5 |
| 2010 | 34.2 |
| 2011 | 48 |
| 2012 | 61 |
| 2013 | 74.4 |
| 2014 | 88.9 |
| 2015 | 107 |
| 2016 | 135.9 |
| 2017 | 177.8 |
| 2018 | 232.8 |
| 2019 | 280.5 |
| 2020 | 386 |
| 2021 | 470.8 |
| 2022 | 513.9 |
| 2023 | 574.9 |
Amazon Revenue Breakdown
Amazon revenue breakdown by segment 2014 to 2023 ($bn)
| Year | Online stores | Physical stores | Third-party retail | Subscription services | AWS | Advertising | Other |
|---|---|---|---|---|---|---|---|
| 2014 | 68.5 | 11.7 | 2.7 | 4.6 | 1.3 | ||
| 2015 | 76.8 | 16 | 4.4 | 7.8 | 1.7 | ||
| 2016 | 91.4 | 22.9 | 6.3 | 12.2 | 2.9 | ||
| 2017 | 108.3 | 5.8 | 31.8 | 9.7 | 17.4 | 4.6 | |
| 2018 | 122.9 | 17.2 | 42.7 | 14.1 | 25.6 | 10.1 | |
| 2019 | 141.2 | 17.1 | 53.7 | 19.2 | 35 | 14 | |
| 2020 | 197.2 | 16.2 | 80.4 | 25.2 | 45.3 | 15.5 | 5.9 |
| 2021 | 222 | 17 | 103.3 | 31.7 | 62.2 | 31.1 | 3.4 |
| 2022 | 220 | 18.9 | 117.7 | 35.2 | 80 | 37.7 | 4.2 |
| 2023 | 231.8 | 20 | 140 | 40.2 | 90.7 | 46.9 | 4.9 |
- In 2023, Amazon’s online stores generated USD 231.8 billion in revenue, making it the largest revenue segment for the company.
- Amazon’s cloud storage and computing service, AWS, brought in USD 90.7 billion in 2023, demonstrating strong growth in this segment.
- The third-party retail segment accounted for USD 140 billion in 2023, showcasing its significant contribution to Amazon’s overall revenue.
- Advertising revenue reached USD 46.9 billion in 2023, reflecting the increasing importance of this segment.
- Subscription services, including memberships like Prime, generated USD 40.2 billion in revenue in 2023.
- Physical stores contributed USD 20 billion to Amazon’s revenue in 2023.
- The “Other” category, covering smaller initiatives, recorded USD 4.9 billion in revenue in 2023.
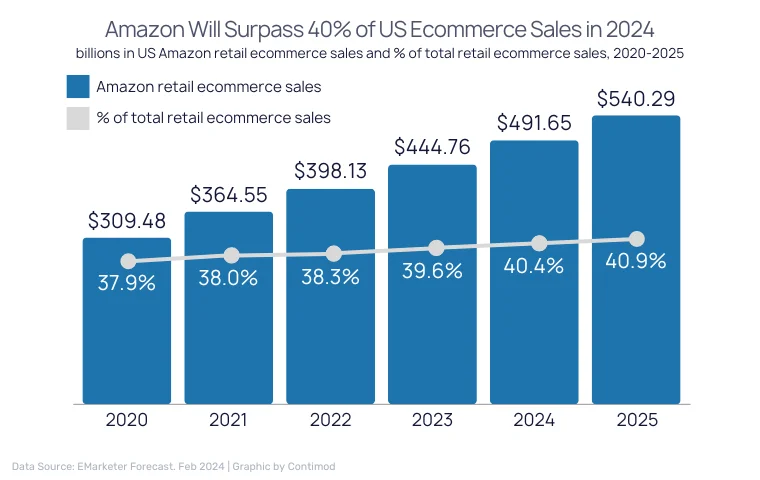
- Amazon currently holds 39.6% of the US e-commerce sales market.
- By 2025, Amazon’s share is projected to increase to 40.9% of the total US retail e-commerce market.
- Amazon’s retail e-commerce sales in the United States were USD 444.76 billion in 2023.
- These sales are projected to grow to USD 491.65 billion in 2024, marking an increase of USD 46.89 billion from 2023 to 2024.
- By 2025, Amazon’s retail e-commerce sales are expected to reach USD 540.29 billion.
- In 2024, Amazon will make up 6.6% of total US retail sales.
You May Also Like To Read
- Anker Statistics
- Sennheiser Statistics
- Seagate Statistics
- Razer Statistics
- Motorola Statistics
- Samsung Statistics
- Garmin Statistics
- Panasonic Statistics
- LG Statistics
- Huawei Statistics
- Oppo Statistics
- iPhone Statistics
Amazon User Statistics
- Amazon has over 310 million active users worldwide.
- 80% of Amazon’s active users are from the United States.
- There are approximately 161.7 million Amazon Prime users in the United States.
- Amazon Prime has over 200 million members globally.
- 98.07 million users access Amazon at least once a month.
Most Downloaded Amazon Apps Worldwide
- Amazon Statistics reveals that, as of July 2024, Amazon Shopping, Amazon Prime Video, and Amazon Alexa are the most downloaded apps worldwide, with total downloads amounting to 3,30,54,065.
| Amazon Published Apps | Total downloads (in millions) |
| Amazon Shopping | 18,029,185 |
| Amazon Prime Video | 11,795,330 |
| Amazon Alexa | 3,229,550 |
| Amazon Music: Songs & Podcasts | 2762,563 |
| Amazon Kindle | 2,475,466 |
| Amazon Fire TV | 1,654,730 |
| Amazon Photos: Photo & Video | 1,129,200 |
| Amazon miniTV: Web series | 1,048,707 |
| Amazon Flex | 909,769 |
| Amazon Seller | 612,838 |
| Amazon Freeve: Movies/Live TV | 450,415 |
| Amazon Business: B2B Shopping | 2,44,325 |
| Amazon A to Z | 132,192 |
| Amazon Kids+ | 111,753 |
| Amazon Kids+ Parent Dashboard | 98,863 |
| Amazon Chime | 63,288 |
| Luna Controller | 59,630 |
| Amazon Business- India | 55,006 |
| Transparency- | 52,666 |
| Amazon Relay | 49,159 |
(Source: statista.com)
Average Monthly Sales of Amazon Sellers Worldwide
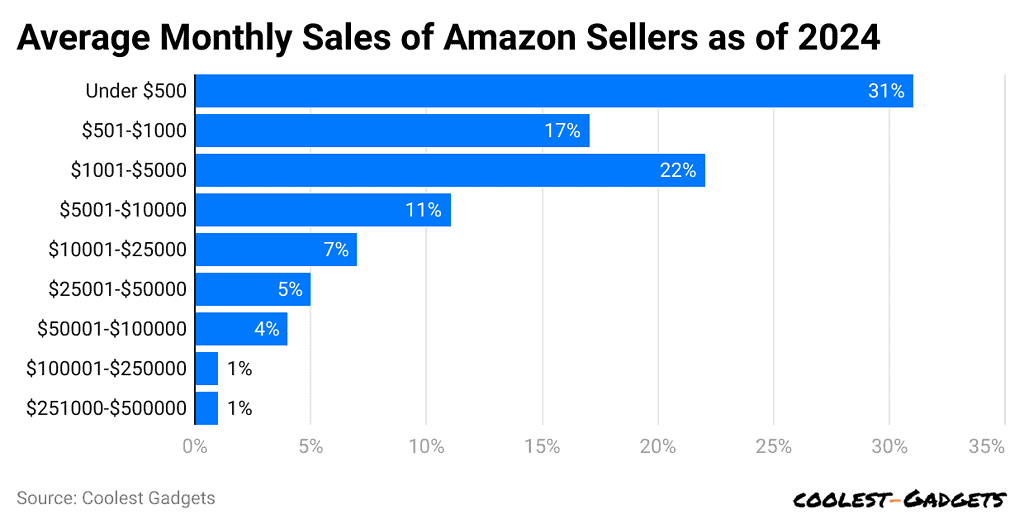
(Reference: statista.com)
- The majority of Amazon sellers, on average, around 31% of sellers—earn less than $500.
- Furthermore, 22% said they earn $1,001- $5,000.
- On the other hand, only 1% reported to be earning between $251,000 and $500,000.
Reasons for Joining Amazon Prime in The US
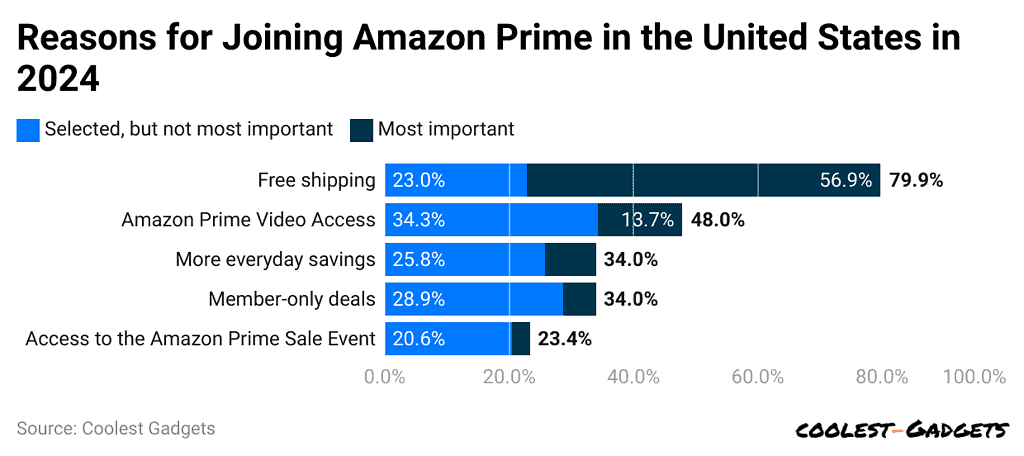
(Reference: statista.com)
- According to a survey by Statista, the most common reason to join Amazon is free shipping, with 79.9% of respondents voting it as ‘most important’.
- 34.3% stated that access to Amazon Prime Video is ‘preferred but not important’.
- In addition, everyday savings, member-only deals, and access to Amazon Prime sale events are also listed.
Amazon Seller Demographics
Location
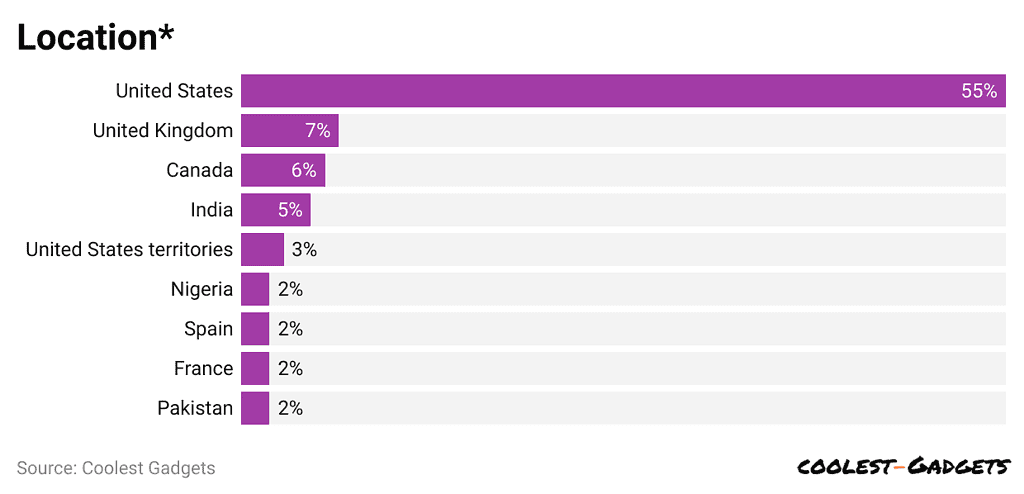
(Reference: junglescout.com)
- A large share of Amazon sellers are based in the US, contributing 55%.
- However, showing a major difference, the United Kingdom follows with merely 7%, Canada at 6%, and India at 5%.
- Spain, France, Pakistan, and Nigeria have only 2% of Amazon sellers.
Age
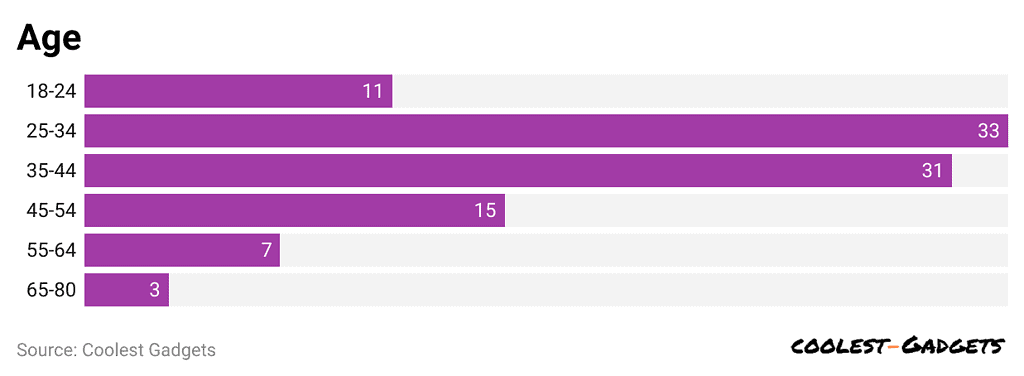
(Reference: junglescout.com)
- 33% of Amazon sellers are between 25 and 34 years old, followed by 35 to 44 years old at 31%.
- The young generation represents 11% of sellers, while the silent generation contributes 3%.
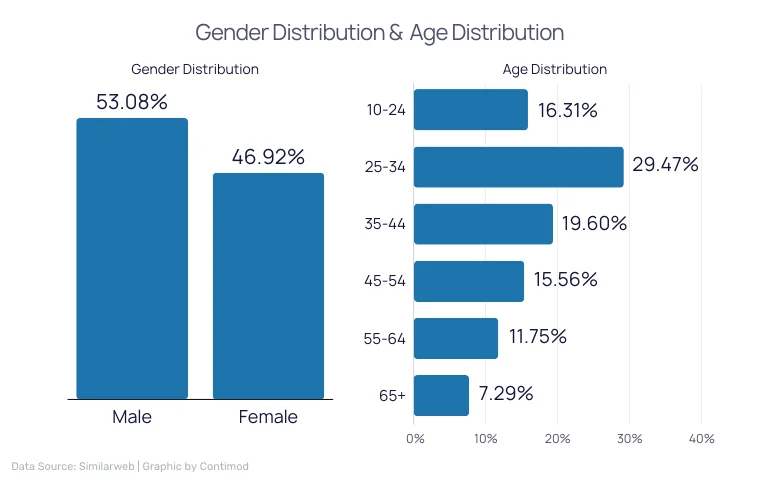
Gender
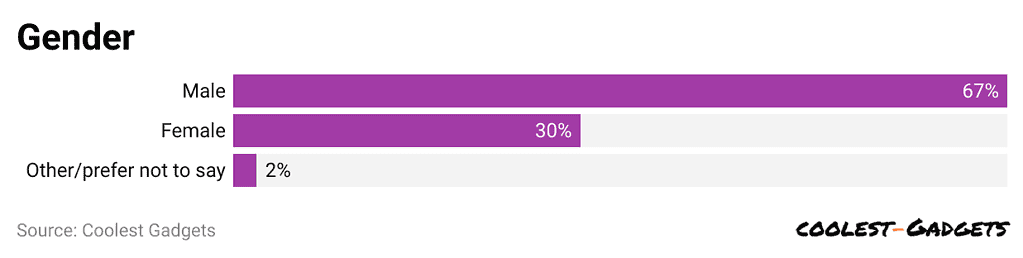
(Reference: junglescout.com)
Amazon.com Website Traffic By Country
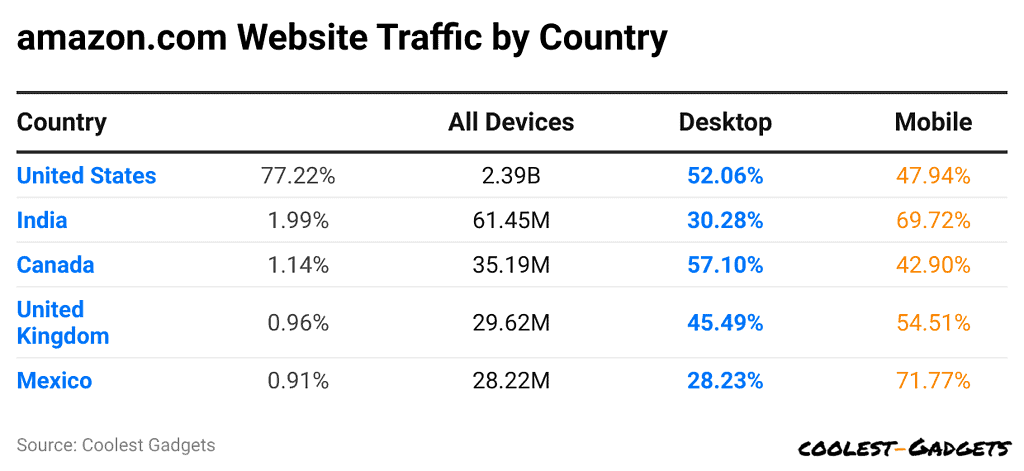
(Reference: semrush.com)
- Consumers from the United States contribute most of the platform’s traffic.
- Amazon Statistics show that, over the last six months of 2024, 77.22% of traffic came from the US, followed by India at 1.99% and Canada at 1.14%.
- In addition, most consumers prefer to access the website through desktop (50.27%) and mobile (49.73%).
Amazon Search Statistics
- Amazon holds a 45% share of the online shopping market in the United States.
- 70% of Amazon customers do not navigate beyond the first page of search results.
- 90% of all product views on Amazon are generated through searches instead of advertisements.
- 63% of customers start their product searches on Amazon.
- 81% of clicks on Amazon occur on brands listed on the first page of search results.
- 50% of searches on Amazon are for gadgets.
- 64% of clicks are on the top three results displayed in a search.
- 35% of Amazon shoppers click on the first product listed on a search page.
- Approximately 98.07 million people use the Amazon app at least once a month.
- In July 2023, there was a 2.4% decrease in the number of people searching on Amazon in the U.S. compared to July 2022.
Amazon Advertising Statistics
- Amazon’s advertising revenue reached USD 37.7 billion in 2022, marking a 20% increase from the previous year.
- In Q2 2023, Amazon’s ad services revenue rose by 22%, surpassing USD 10 billion.
- Currently, Amazon holds a 7.3% share of the online advertising market.
- In 2022, Amazon’s advertising services contributed 7.3% of total net sales, up from 6.6% in 2021.
- Amazon spent approximately USD 42.2 billion on marketing in fiscal year 2022.
- Sellers on Amazon experience an average return of 4.5 times their ad spend.
- The average cost per click (CPC) for Amazon ads in 2023 is USD 0.97.
- With an average conversion rate of 9.89%, Amazon pay-per-click (PPC) ads demonstrate significant effectiveness.
- Seventy-five percent of Amazon sellers utilize at least one type of pay-per-click advertising.
- On average, Amazon sellers allocate 22% of their revenue to advertising.
Amazon Customer Loyalty Statistics
- 98% of Amazon Prime members renew their subscriptions.
- Amazon Prime members have a 93% retention rate after one year and a 98% retention rate after two years.
- 85% of Prime shoppers visit Amazon at least once a week.
- 46% of Prime members make purchases on Amazon at least once a week.
- The average Prime member spends approximately 1,400 USD per year, compared to 600 USD for non-Prime members.
- 38% of Amazon customers in the United States made four or more repeat purchases.
- 52% of Amazon shoppers are more likely to purchase an unfamiliar brand.
- 75% of shoppers use Amazon to discover new products and brands.
- Amazon’s customer satisfaction score was 84 out of 100 ASCI points.
- 89% of Amazon customers are loyal to the platform.
Most Valuable Retail Brands Worldwide By Brand Value
| Brand | Brand Value (in million US dollars) |
| Amazon | 184,589 |
| The Home Depot | 74.712 |
| Walmart | 69,700 |
| Costco | 60,489 |
| Lowe’s | 26,612 |
| Tmail | 23,337 |
| IKEA | 21,337 |
| Aldi | 21,024 |
| Pinduoduo | 20,369 |
| Mercado Libre | 14,816 |
| Target | 14,156 |
| Taobao | 13,480 |
| Lidl | 13,169 |
| TJ- Maxx | 11,551 |
| Sam’s Club | 11,271 |
| 7-Eleven | 11,068 |
| Woolworths | 10,827 |
| Ebay | 10,327 |
| Dollar General | 9,726 |
| Flipkart | 8,408 |
(Source: statista.com)
- Amazon Statistics 2024 shows that this eCommerce company is the most valuable retail brand in the world, with a brand value of 185 billion US dollars.
- With a significant difference, Home Depot, Walmart, and Costco followed in their respective positions.
Most Profitable Sellers Worldwide By Category
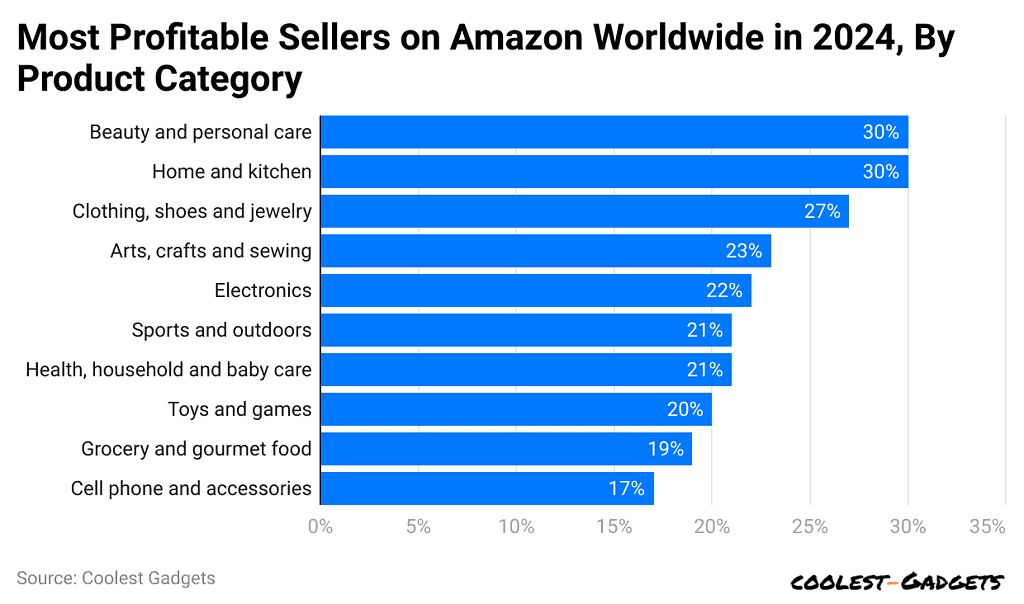
(Reference: statista.com)
- Beauty and personal care, home and kitchen, clothing, shoes, and jewelry are the most profitable Amazon categories for sellers.
- Each of these represents 30% for the first two and 27% of sellers on the platform.
- Cell phones and accessories have, however, the lowest share of sellers, resulting in 17%.
Top Categories Purchased On Amazon Prime Day Shoppers
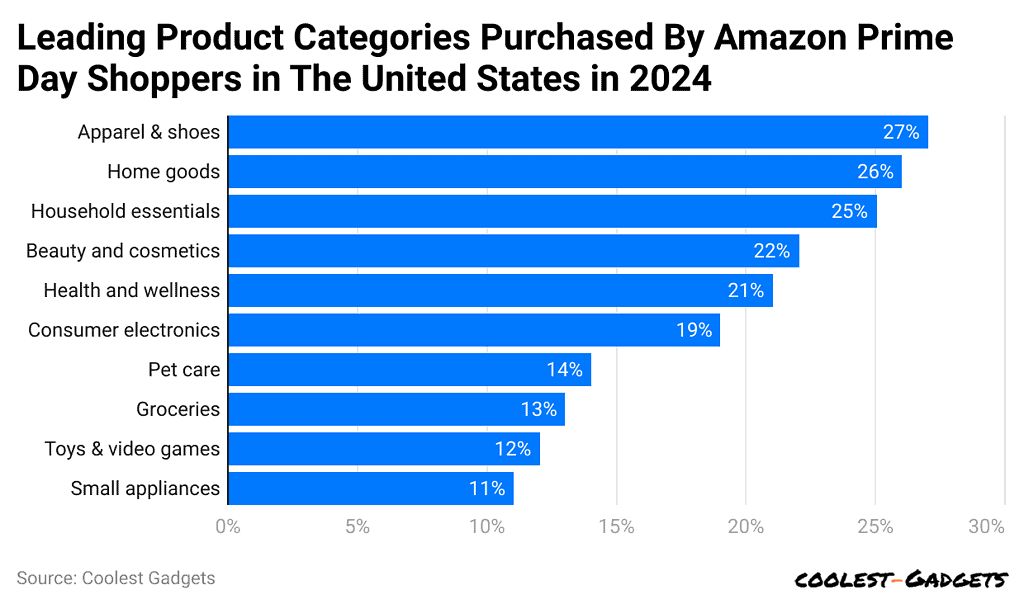
(Reference: statista.com)
- Apparel & shoes are the most popular product category among aMAZON Prime subscribers, stated by 27% of shoppers.
- Furthermore, home goods, household essentials, beauty and cosmetics, and health and wellness represent more than 20% of each.
Reasons Online Shoppers Purchased on Amazon
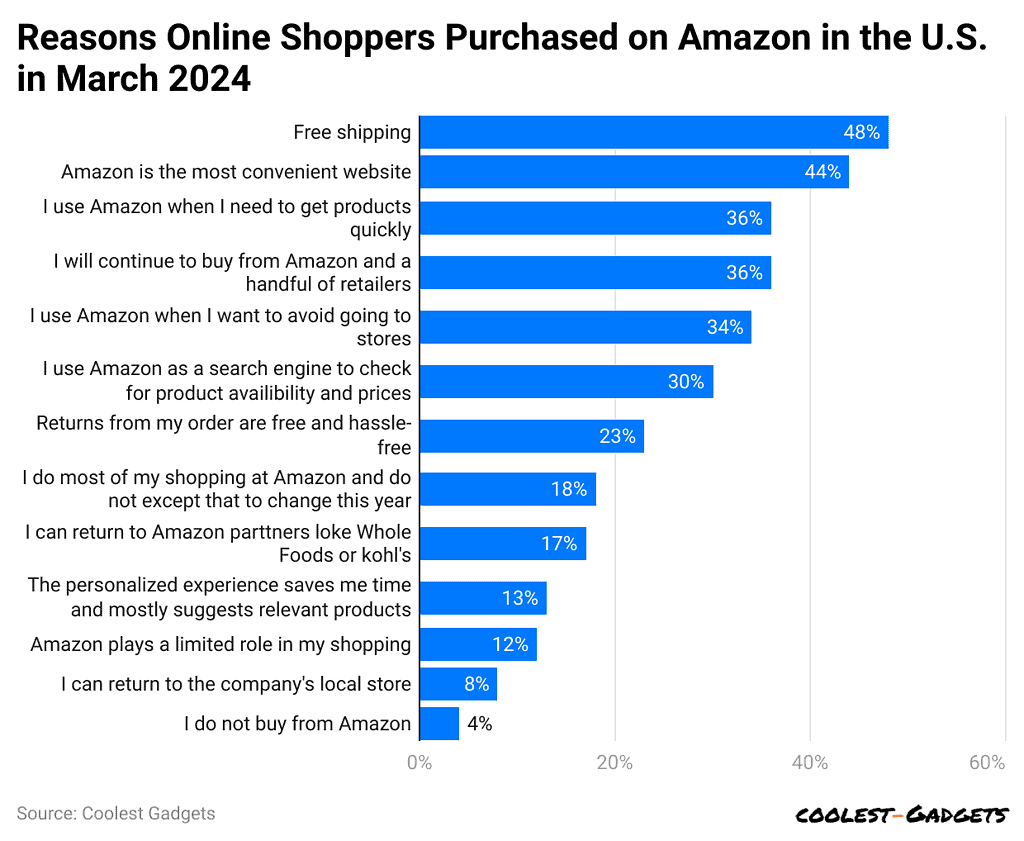
(Reference: statista.com)
- Free shipping available on Amazon is the most common reason why 48% of online shoppers prefer the brand to shop online.
- 44% say it is the most convenient website.
- Moreover, 36% of Amazon shoppers believe that the online store provides them with quick access to products, and they will continue to buy from Amazon and a handful of retailers.
Largest Internet Companies Worldwide
| Brand | Market Cap (in billion US dollars) |
| Alphabet | 2,028 |
| Amazon | 1,966 |
| Meta Platforms | 1,448 |
| Tencent | 499.53 |
| Netflix | 326.26 |
| Alibaba | 244.29 |
| ServiceNow | 186.99 |
| Pinduoduo | 174.83 |
| Uber | 168.99 |
| Booking Holdings | 145.24 |
| Meituan | 140.93 |
| Shopify | 107.32 |
| MercadoLibre | 106.41 |
| Airbnb | 87.02 |
| Equinix | 84.69 |
| PayPal | 82.23 |
| Interactive Brokers | 62.98 |
| Doordash | 62.62 |
| Jingdong Mall | 62.2 |
(Source: statista.com)
- Amazon Statistics reveal that the brand is the second largest internet company in the world by market capitalization, amounting to 1,966 billion USD.
- Alphabet leads the category with a 2,028 market cap. Interactive Brokers, Doordash, and Jingdng Mall are at the other end of the list.
Payment Methods Used at Amazon Prime Days
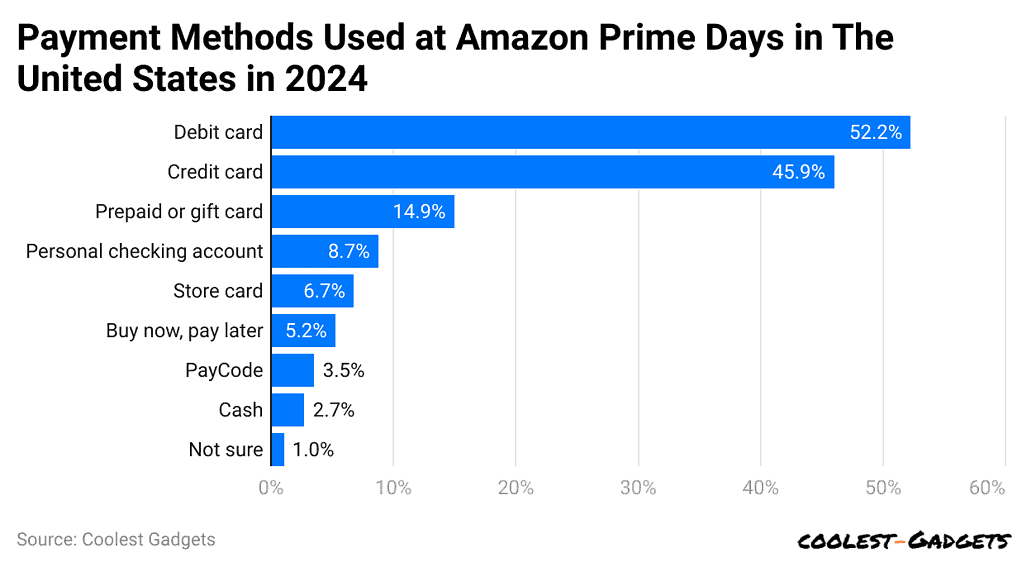
(Reference: statista.com)
- Debit and credit cards were the most common methods of completing a purchase on Amazon during Amazon Prime days in the US in 2024, contributing 52.2% and 45.9%, respectively.
- 14.9% of shoppers used gift or prepaid cards, while 8.7% had a personal checking account.
- Other least popular purchase methods include store cards, BNPL, Paycode, and cash.
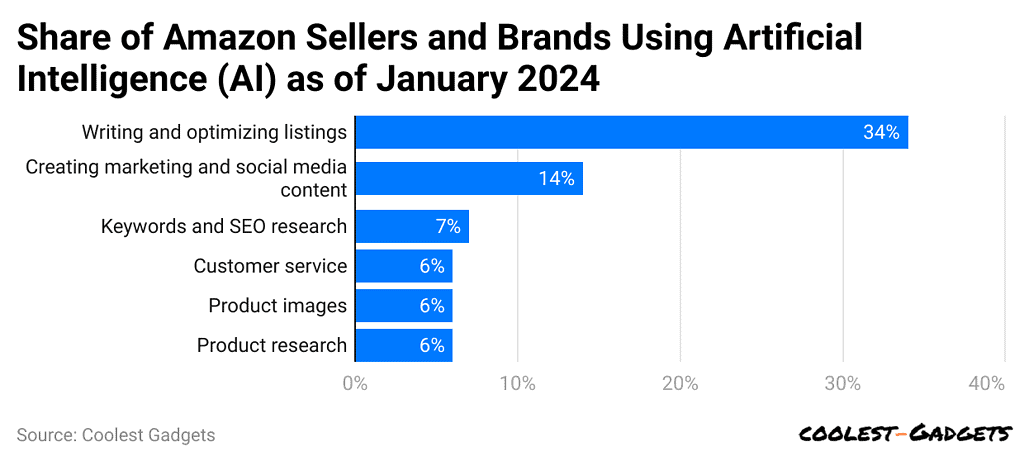
(Reference: statista.com)
- A significant number of sellers and brands on Amazon use AI to write and optimize listings, contributing 34%.
- 14% said that AI helps them create marketing and social media content.
- 7% said it is useful to find keywords and do SEO research.
- For 6% of sellers and brands, it is commonly useful in customer service, product images, and product research.
Conclusion
In conclusion, these numbers in Amazon Statistics have shown the transformative influence of the brand on the retail industry is undeniable. Its innovative approach, customer-centric focus, and efficient logistics network have propelled it to the forefront of e-commerce.
While challenges and controversies persist, Amazon’s ability to adapt and innovate will likely shape the future of retail for years to come.
Sources
Joseph D'Souza started Coolest Gadgets in 2005 to share his love for tech gadgets. It has since become a popular tech blog, famous for detailed gadget's reviews and companies statistics. Joseph is committed to providing clear, well-researched content, making tech easy to understand for everyone. Coolest Gadgets is a trusted source for tech news, loved by both tech fans and beginners.