Pizza Hut Statistics By Sales and Units, Employees Salary, Demographic, Sauce Preferences and Crust Choices

Updated · Mar 14, 2025


TABLE OF CONTENTS
- Introduction
- Editor’s Choice
- What is Pizza Hut?
- Some Unknown Facts About Pizza Hut
- General Pizza Hut Statistics
- Pizza Hut’s Revenue Analyses
- Pizza Hut’s Statistics by Sales and Units
- Customer Satisfaction Index of Pizza Hut
- Portfolio Performance of Pizza Brands
- Pizza Hut Demographic Statistics
- Pizza Hut’s Statistics by Employees Salary Earning
- Website Statistics of Pizza Hut by Country
- Pizza Hut Statistics by Sauce Preferences and Crust Choices
- Looking Ahead for Pizza Hut
- Conclusion
Introduction
Pizza Hut Statistics: Pizza Hut is a world-famous pizza chain restaurant! They’ve been serving up delicious pizzas for decades, and their iconic red roofs are a familiar sight in many countries. Pizza Hut might focus on offering a variety of menu options beyond just pizza, like wings and pasta. This could attract customers who are looking for a more complete meal. But how big is Pizza Hut? Let’s dive into some interesting statistics to learn more about this pizza giant.
Editor’s Choice
- According to Pizza Hut Statistics, the company’s revenue in the 3rd quarter of 2023 was $1.7 billion.
- Currently, Pizza Hut has more than 350,000 employees, and each employee’s revenue is up to $19,549.
- The global sales of the company accounted for $12.853K by the end of 2022, and the sales growth has decreased by 0.8%.
- A report published by Statista shows that in 2023, Pizza Hut generated 19,866 restaurants.
- Yum! Brands owns Pizza Hut, which is a parent company. The brand has secured more than 58K units globally in 2023.
- As of 2024, North Dakota is leading in Pizza consumption, as the average individual indulges in pizza from Pizza Hut 3.5 times per month.
- Pizza Hut Statistics in 2023 represent that in the United States, Pizza Hut’s customer satisfaction index has decreased, resulting in a 78 score.
- Based on recent Pizza Hut survey analyses, the most popular type of Pizza crust is thin crust. In January 2024, 28% of U.S. people preferred this pizza.
- In March 2024, the total number of website visits made on pizzahut.com was 14.7 million, up 3.24% from last month, with a bounce rate of 39.83%.
- Semrush’s analyses show that pizzahut.com’s mobile and desktop share was 87% and 13%, respectively.
What is Pizza Hut?
Pizza Hut is an American multinational fast food chain or pizza restaurant founded by Frank and Dan Carney. The brand was established completely on May 31, 1958. It is headquartered in Plano, Texas, and is currently owned by Yum! Brands, Inc.
Some Unknown Facts About Pizza Hut
- Do you know? Pizza Hut is the second largest Pizza chain on Earth after Domino’s in 2023.
- The chain was first started in Wichita, Kansas, in 1958, with a capital of $600 only.
- The name ‘Pizza Hut’ is simple and made just to fit on the sign.
- Pizza Hut has set a record for the highest altitude pizza delivery on earth at Mt. Kilimanjaro in Tanzania.
- The first order of Pizza Hut was made by former first lady Barbara Bush and sent to the White House in 1989.
- When Pizza Hut first released its stuffed-crust pizzas, they were not successful, but a commercial made by Donald Trump and Ivana saved the Hut’s stuffed-crust pizzas, and that earned more than $30 million in revenue.
- Even Pizza Hut delivered pizza to space in 2001, which was received by Russian astronaut Yuri Usachov.
- In 2016, the company made gold-covered pizzas for a few lucky fans during the 50th anniversary of the Super Bowl.
General Pizza Hut Statistics
- Yum! Brands owns Pizza Hut! Brands, a parent company, and in 2023, the brand secured more than 58K units worldwide.
- Yum! Brands’ net income in 2023 was approximately $1.6 billion. This brand also operates other leading restaurants, such as KFC and Taco Bell.
- In the United States of America, the highest pizza-consuming countries from Pizza Hut in 2024 are North Dakota, New York, Minnesota, and Wisconsin.
- A Statista report on Pizza Hut Statistics claimed that in 2023, Pizza Hut’s brand value was $5.88 billion.
- The top two competitors of Pizza Hut are Wendy’s and KFC.
- Traffic on pizzahut.com increased by 4.03% compared to February, suggesting that Pizza Hut’s online presence is growing stronger.
- The most common search term bringing people to the website is “Pizza Hut” itself. This shows that brand recognition is high and that people know where to go for their Pizza Hut fix. Other popular searches include “Pizza Near Me” and variations of “Pizza Hut.”
- The website seems to attract a balanced audience, with almost equal numbers of men (48.2%) and women (51.8%) visiting. The biggest age group checking out the website is people between 25 and 34 years old. This suggests young adults might be a key customer base for Pizza Hut.
- Pizza Hut might be taking steps to reduce its environmental footprint. This could involve using recyclable packaging, sourcing ingredients sustainably, or reducing energy consumption in their restaurants.
- Pizza Hut might participate in charitable giving or community outreach programs. This could involve supporting local schools, sponsoring events, or donating food to those in need.
Restaurant Presence
Pizza Hut boasts a massive global presence. While exact numbers aren’t readily available, it’s safe to say they have thousands of restaurants scattered across the world. This widespread reach allows them to cater to a vast customer base and satisfy pizza cravings almost anywhere.
Financial Performance
However, we can make some educated guesses based on their popularity and reach. Here’s a likely scenario:
- High Revenue: With millions of website visits and a global presence, Pizza Hut likely generates a significant amount of revenue each year.
- Profitability: As a major pizza chain, Pizza Hut is likely profitable. Their ability to attract customers and offer value for money suggests they’re doing well financially.
Customer Preferences
- Classic Favorites: Popular menu items likely include classic pizzas like Pepperoni, sausage, and veggie. These tried-and-true choices are staples for a reason!
- Crust Matters Thin crust, pan crust, stuffed crust – Pizza Hut offers a variety of crust options. Customer preferences might vary depending on their taste, with some favoring a thin and crispy base and others enjoying a thicker and chewier option.
- Beyond Pizza: Pizza Hut doesn’t just offer pizza! Wings, breadsticks, pasta, and desserts are likely popular choices for customers looking to round out their meal.
You May Also Like To Read
- Starbucks Statistics
- Organic Food Statistics
- KFC Statistics
- Burger King Statistics
- Beverages Statistics
- McDonald’s Statistics
- Domino’s Pizza Statistics
- Snacks Statistics
Pizza Hut’s Revenue Analyses
(Reference: zippia.com)
- According to Pizza Hut Statistics, in the 1st quarter of 2023, revenue covered by Pizza Hut was $1.645 billion, increased from Q1 (2022).
- Furthermore, in Q2 and Q3 of 2023, $1.687 million and $1.708 million in revenue were secured, respectively.
Pizza Hut’s Statistics by Sales and Units
(Reference: franchisetimes.com)
- According to Pizza Hut Statistics, the company’s global sales amounted to $12.853K by the end of 2022, and sales growth decreased by 0.8%.
- Meanwhile, the total number of units in the company was 19.034K, and unit growth was 3.6%.
- On the other hand, international and United States units were 12.473K and 6.561K, respectively.
Customer Satisfaction Index of Pizza Hut
(Reference: statista.com)
As of 2023, Pizza Hut’s American Customer Satisfaction Index (ACSI) score was 78, which is higher than the 2022 score of 77.
Portfolio Performance of Pizza Brands
(Source: finance.yahoo.com)
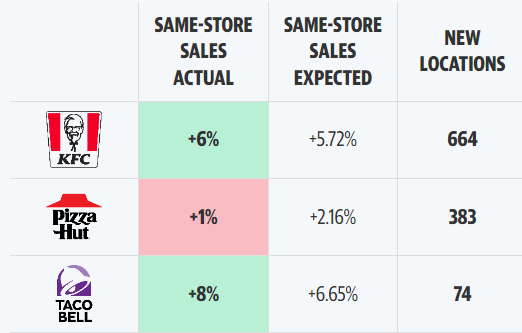
- Pizza Hut was disappointed in the third quarter of 2023, as same-store sales increased just 1% from the previous quarter.
- On the other hand, KFC and Taco Bell have grown by 6% and 8%, respectively.
Pizza Hut Demographic Statistics
By Gender
(Reference: zippia.com)
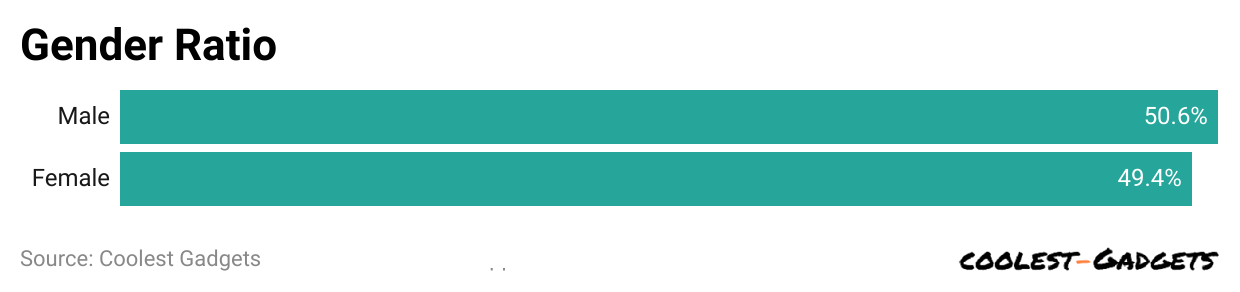
Pizza Hut has always been a male-dominated company. In 2023, the male and female employee share was 50.6% and 49.4%, respectively.
By Region
(Reference: zippia.com)
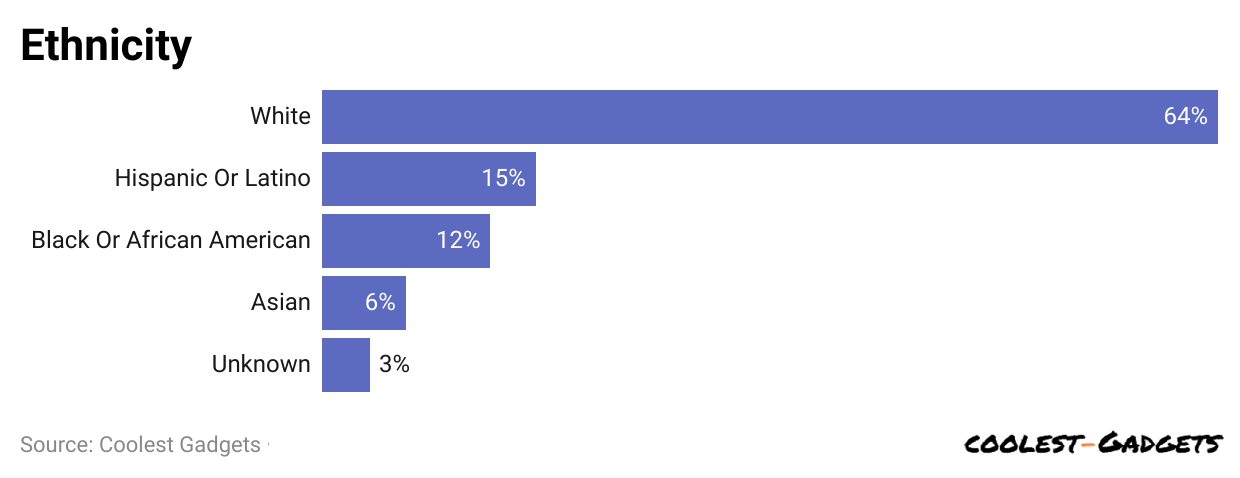
According to Pizza Hut Statistics 2023, almost 63.5% of employees in Pizza Hut are white.
On the other hand, employee shares based on ethnicity are Hispanic or Latino (15.2%), Black or African American (12%), Asian (6%), and unknown (3.4%).
By Language Spoken
(Reference: zippia.com)
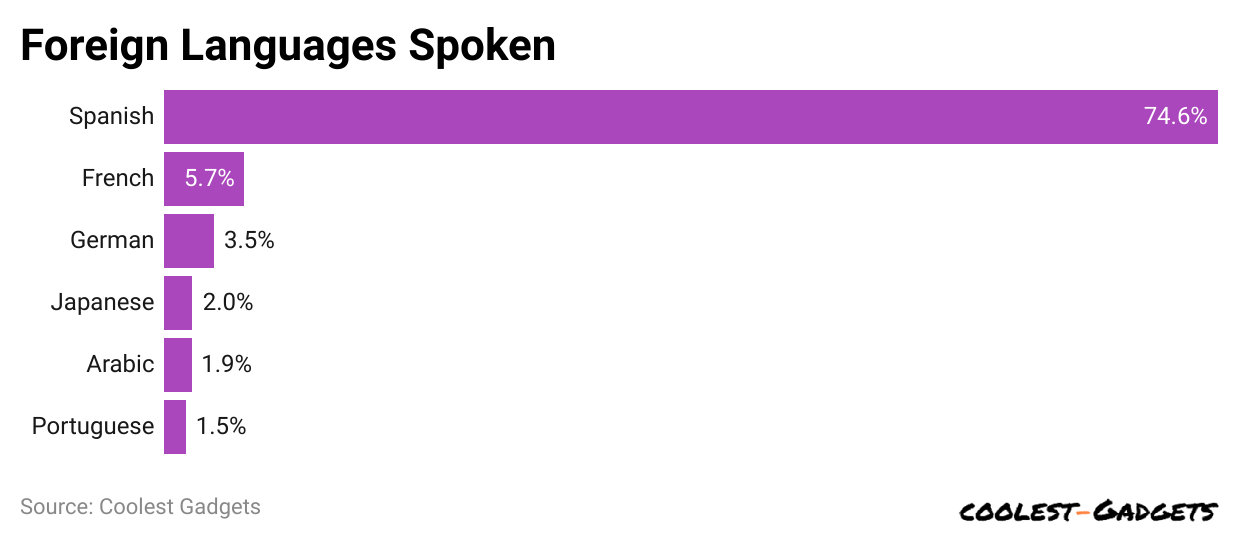
- 6% of employees speak Spanish in Pizza Hut. In contrast, other spoken languages are French (5.7%), German (3.5%), Japanese (2%), Arabic (1.9%), Portuguese (1.5%), Russian (1.4%), Chinese (1.3%), Mandarin (1.2%), Italian (1.1%), Hindi (0.9%), Vietnamese (0.8%), Hmong (0.7%), Polish (0.6%),m Swedish (0.5%), Carrier (0.5%), Tagalog (0.5%), Urdu (0.5%), Turkish (0.4%), and Korean (0.3%).
Pizza Hut’s Statistics by Employees Salary Earning
- In 2023, the average annual salary of 52.4% of Pizza Hut’s employees in the United States was between $25K and $40K.
- Other annual earnings of employees share are <$25K (37.7%), $40K to $60K (9.6%), and $60K to $100K (0.3%).
By Length of Employment
- Pizza Hut Statistics further states that 36% of employees worked in the company for less than one year.
- Moreover, 34% of employees had been employed for 1 to 2 years, followed by 11% (5 to 7 years), 10% (3 to 4 years), 5% (11 years or above), and 4% (8 to 10 years).
By Average Salary Based on Location
| City | Average Salary |
| Denver, CO | $31,420 |
| Charlotte, NC | $24,744 |
| Houston, TX | $27,181 |
| Fort Worth, TX | $27,278 |
| Columbus, OH | $25,335 |
| Jacksonville, FL | $25,547 |
| Dallas, TX | $27,143 |
| Austin, TX | $27,451 |
| New York, NY | $31,119 |
| Philadelphia, PA | $26,804 |
| El Paso, TX | $28,846 |
| Washington, DC | $31,839 |
| Chicago, IL | $28,517 |
| San Antonio, TX | $27,629 |
| San Diego, CA | $35,899 |
| Phoenix, AZ | $31,165 |
| San Jose, CA | $38,135 |
| Indianapolis, IN | $25,848 |
| Los Angeles, CA | $36,460 |
| Hempstead, NY | $31,143 |
(Source: zippia.com)
Explore More Like This
- Pet Food Statistics
- Wine Industry Statistics
- Coca-Cola Statistics
- Soft Drinks Sales Statistics
- Coffee Industry Statistics
- Soft Drink Sales Statistics
- Energy Drink Statistics
- PepsiCo Statistics
Website Statistics of Pizza Hut by Country
(Source: similarweb.com)
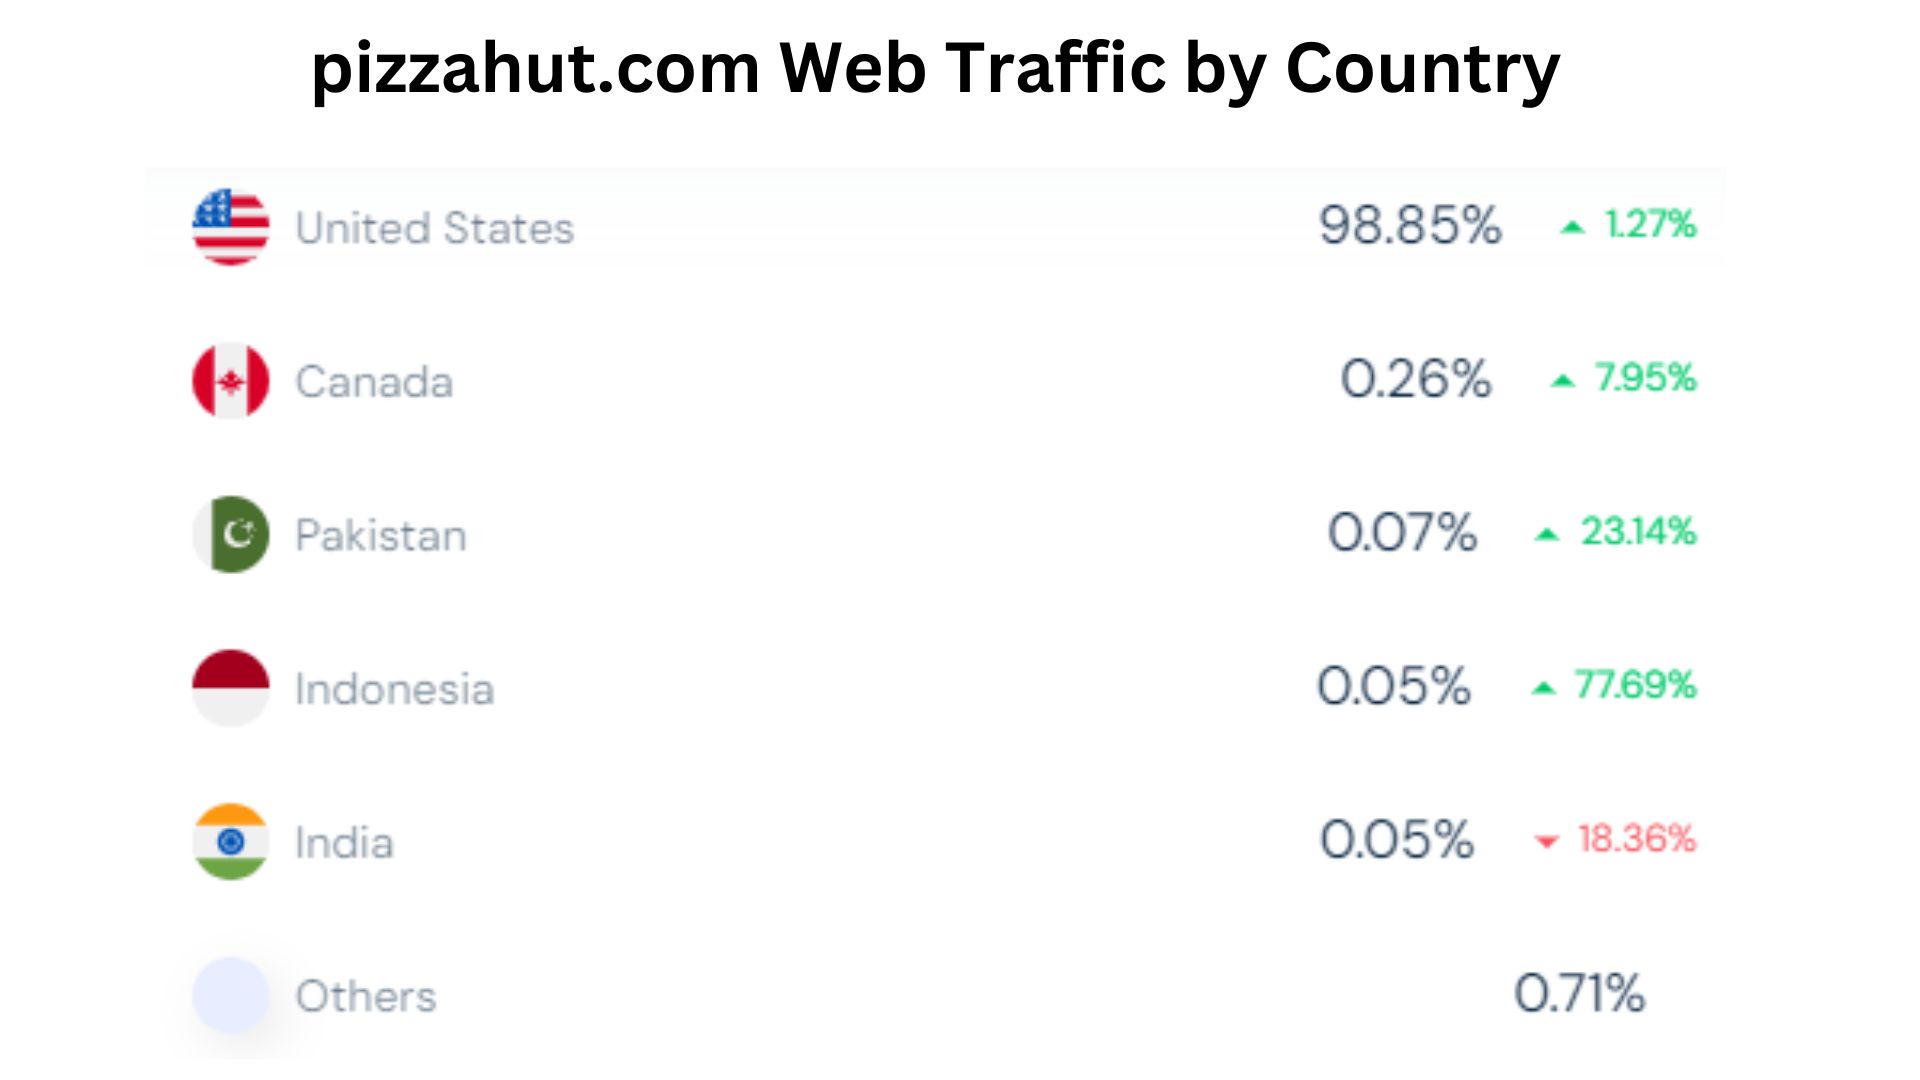
- Pizza Hut Statistics elaborates that the highest website traffic on pizzahut.com was captured by the United States of America, resulting in 98.85% in March 2024, up by 1.27% in total website visitors.
- Furthermore, other countries total website traffic shares are Canada: 0.26% (+7.95%), Pakistan: 0.07% (+23.14%), Indonesia: 0.05% (+77.69%) and India: 0.05% (-18.36%).
- On pizzahut.com, the rest of the countries collectively made a website share of 0.71%.
By Demographics
(Reference: similarweb.com)
- Male and female users’ respective shares on pizzahut.com in March 2024 were 48.2% and 51.8%.
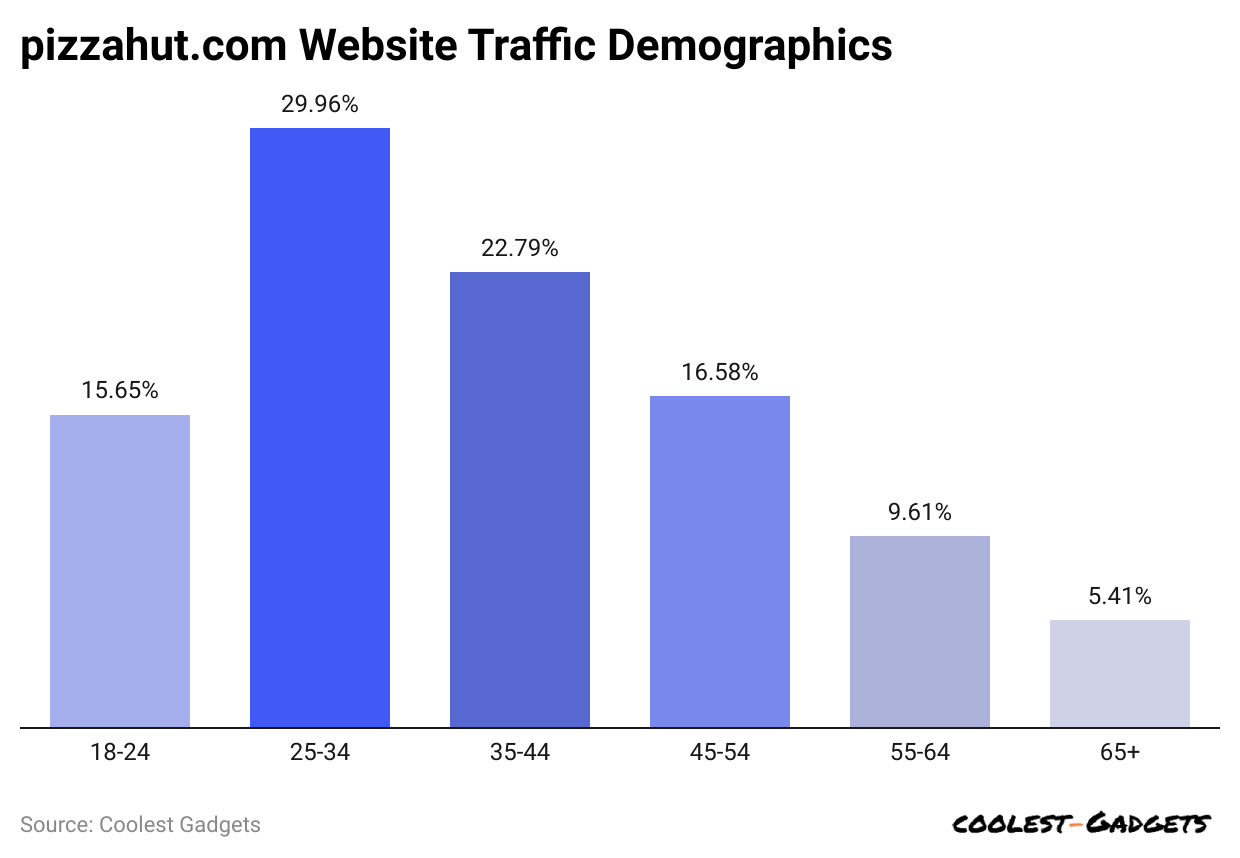
- Pizza Hut Statistics based on age group: The highest number of website users observed is between 25 and 34 years old, making 29.96% website share.
- In addition, 22.79% of the website user share accounted for those aged 35 to 44 years.
- The other users’ shares, representing 16.58% and 15.65%, belong to 45 to 54 years and 18 to 24 years, respectively.
- Approximately 9.61% share of pizzahut.com is made by 55 to 64 years old users.
- 65+ years of users contribute at least a share of 5.41% on pizzahut.com.
By Traffic Sources
(Reference: similarweb.com)
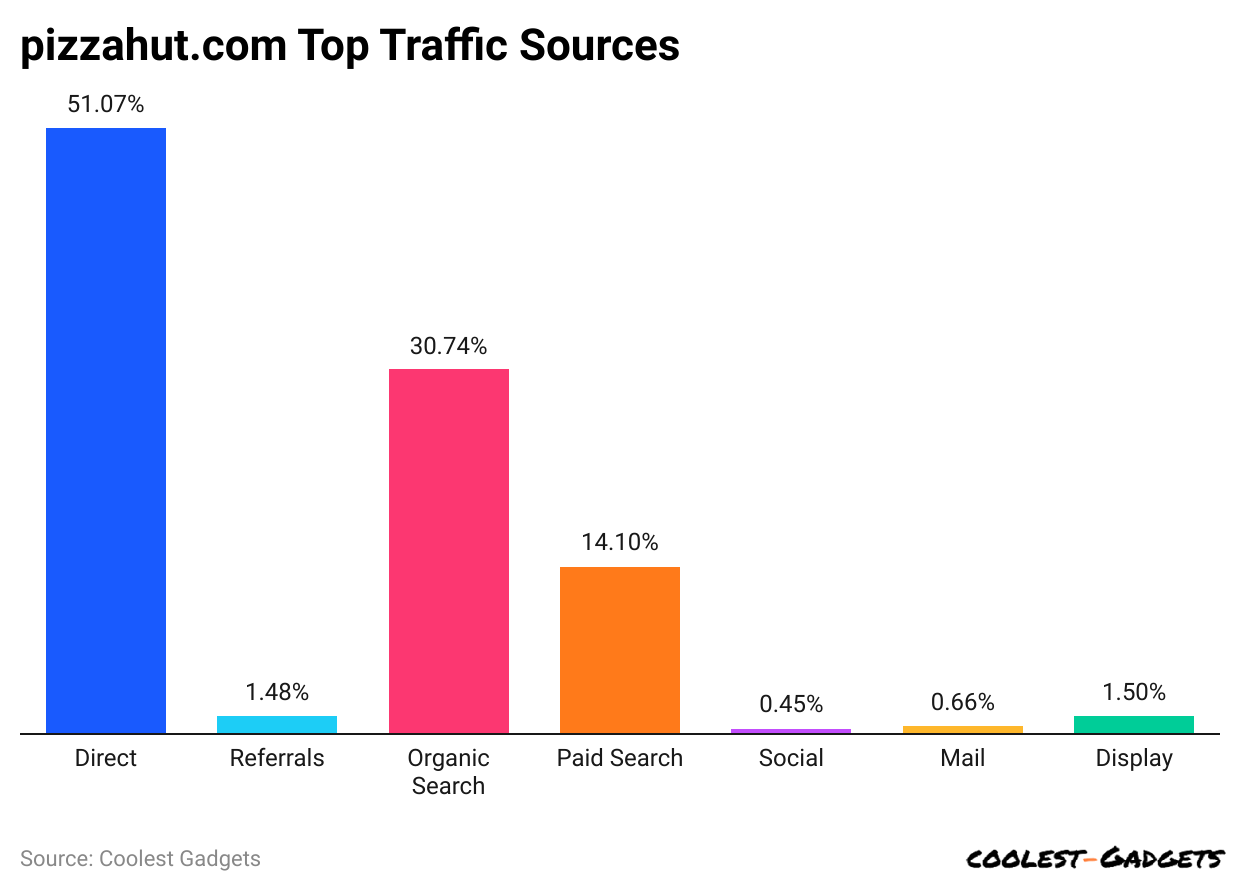
- From the point of view of Pizza Hut Statistics, direct searches received the highest traffic rate towards pizzahut.com, covering a share of 51.07%.
- Organic search is the next most popular traffic source, with a 30.74% share, followed by paid search, which holds a 14.1% share.
- The rest of the traffic source shares included display (1.5%), referrals (1.48%), mail (0.66%), and social (0.45%).
By Social Media Referral Rate
(Reference similarweb.com)
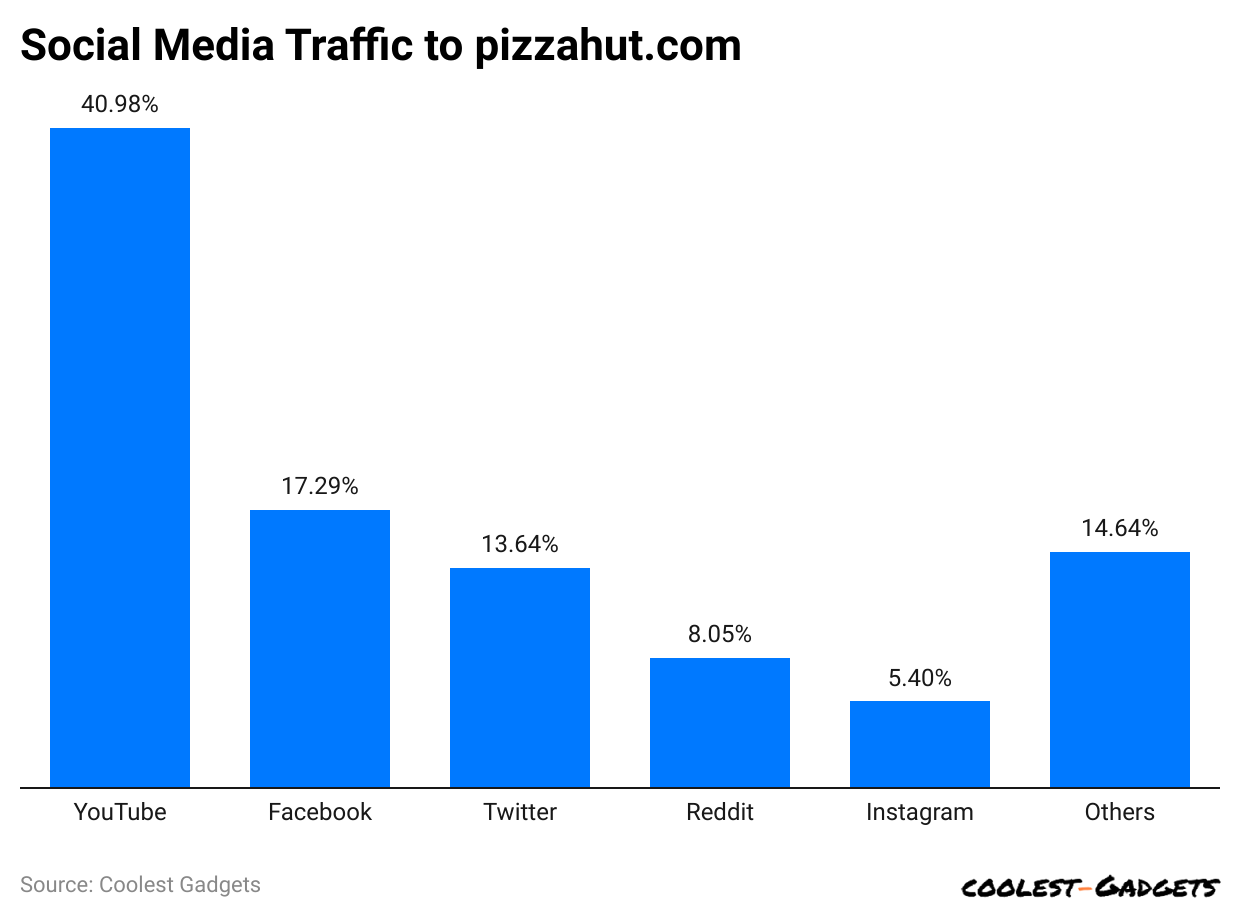
- YouTube captured the highest social media traffic rate on pizzahut.com, with a share of 40.98%
- Facebook and Twitter hold a traffic share of 17.29% and 13.64%, respectively.
- The website’s social media traffic sharers include Reddit (8.05%) and Instagram (5.4%).
- Other social media traffic rates collectively calculated around 14.64% of the share.
By Device

(Reference: semrush.com)
- A report taken from Semrush on Pizza Hut Statistics further reveals that the United States of America secured the highest user share on pizzahut.com with 98.81%, resulting in 31.93 million device users, of which desktop and mobile users accounted for 12.96% and 87.04%, independently.
- Singapore has recorded 166.71K device users, with a traffic share of 0.52%. Meanwhile, desktop and mobile users made up 0.09% and 99.1% respectively.
- The rest of the countries followed by device users and user share are Canada (52.22K and 0.16%), India (46.15K and 0.14%), and the United Kingdom (21.14K and 0.07%).
- The desktop and mobile user shares by countries are Canada (50.44% and 49.56%), India (4.54% and 95.46%), and the United Kingdom (17.53% and 82.47%).
Pizza Hut Statistics by Sauce Preferences and Crust Choices
- Experts of Pizza Hut claimed that thin-crust pizza will continue to grow in popularity in 2024.
- A recent Pizza Hut survey found that the most popular type of Pizza crust is thin crust Pizza, which was preferred by 28% of U.S. people in January 2024.
- Independently, 20% and 14% of Americans preferred Pizza Hut’s stuffed crust and thick crust pizza.
- In the United States of America, states, 20% of Arkansas and 27% of Kentucky people preferred stuffed crust pizza.
- Other states share of Pizza Hut’s stuffed crust Pizza are Louisiana (26%), Mississippi (24%), Montana (30%), Nebraska (28%), North Carolina (23%), Oregon (23%), South Dakota (27%), Tennessee (23%), Utah (25%), Washington (22%), West Virginia (28%) and Wyoming (30%).
- The most popular dipping sauce of pizza is Ranch, which is preferred by 38% of U.S. people in 2024, followed by garlic sauce (27%) and hot sauce (8%).
By Pizza Styles, Seasonings, and Toppings
- Based on Pizza Hut Statistics in 2024, the most popular Pizza style is opted from New Work, holding a share of 35%.
- 55% of U.S. respondents have claimed that Parmesan is the most preferred seasoning in Pizza Hut. But in New York, 29% favored garlic salt.
- The other shares of respondents who lean towards Pizza seasonings are savory (52%), hearty (43%), and Spicy (27%).
- 42% of people in Illinois, Lowa, and Wisconsin choose Pepperoni, a meat topping.
- Pizza Hut Statistics further show that around 44% of U.S. pizza lovers stated that they were willing to try pineapple toppings in 2024. Furthermore, a percentage of people who buy unusual fruits and veggies toppings on their Pizza are Chili peppers (21%), artichokes (16%), potatoes (15%), and pickles (14%).
You Might Find This Interesting
- Danone Statistics
- Yeti Statistics
- Mondelez International Statistics
- Kellogg’s Statistics
- Kraft Heinz Statistics
- Wendy’s Statistics
- Chipotle Mexican Grill Statistics
- General Mills Statistics
Looking Ahead for Pizza Hut
Pizza Hut is a well-established brand with a loyal customer base. Here’s what the future might hold:
- Menu Innovation: Pizza Hut will likely continue to develop new and exciting menu items to keep customers engaged. This could involve introducing unique flavor combinations, crust options, or catering to dietary restrictions.
- Technology Integration: Online ordering, delivery apps, and loyalty programs are becoming increasingly important. Pizza Hut will likely continue to invest in these areas to provide a seamless and convenient experience for customers.
- Global Expansion: With a strong presence worldwide, Pizza Hut might continue to expand into new markets, bringing their pizzas to even more people around the world.
Conclusion
So, there you have it all about Pizza Hut! These Pizza Hut Statistics include current market analyses and several fun facts that paint a picture of Pizza Hut’s success and enduring popularity. All the above analyses will guide you positively in understanding the market of Pizza Hut in 2023 and 2024. With technological advancement, the company is continuously evolving with customers’ preferences, which makes it so special and successful. From its website traffic to its global presence, Pizza Hut is a major player in the pizza world.
Joseph D'Souza started Coolest Gadgets in 2005 to share his love for tech gadgets. It has since become a popular tech blog, famous for detailed gadget's reviews and companies statistics. Joseph is committed to providing clear, well-researched content, making tech easy to understand for everyone. Coolest Gadgets is a trusted source for tech news, loved by both tech fans and beginners.