Pet Food Statistics By Market Size, Sales and Facts

Updated · Feb 10, 2025


TABLE OF CONTENTS
- Introduction
- Editor’s Choice
- General Pet Food Statistics
- Pet Food Market Forecast
- US Total Cat and Dog Food Ingredient Quantities
- Worldwide Pet Food Statistics
- Canada Pet Food Statistics
- France Pet Food Statistics
- Italy Pet Food Statistics
- Mexico Pet Food Statistics
- United Kingdom Pet Food Statistics
- China Pet Food Statistics
- Monthly Frequency of Buying Pet Food in China
- Revenue Change Over the Years
- The Volume of Pet Food Produced By Region
- Revenue of the Pet Food Market Worldwide in 2023
- Pet Food Sales Worldwide
- The Average Price of Specialized Pet Food in the USA By Product Type
- Pet Market Sales in the USA By Category
- Preferred Sales Channel For Pet Food By US Consumers By Generation
- Sales of Leading Vendors in the USA (Dog biscuits, beverages, treats)
- Top North American Pet Specialty Chains By Store Count
- Price Increase Per Unit of Dog and Cat Food By Category
- Main Drivers of Pet Food Purchase Decisions
- Pet Food Import Value in South Korea By Country
- Share of Wet Dog Food Brand vs Wet Cat Food Brand in Poland
- Conclusion
Introduction
Pet Food Statistics: The pet food industry has experienced substantial growth over the past decade, driven by the rising trend of pet adoption and an increasing emphasis on health and nutrition for animals. Pets, whether dogs, cats, or other beloved companions, are valued as family members, and this sentiment has significantly impacted the demand for pet food. As in human nutrition, pet owners now seek diverse, high-quality food options to meet their pets’ dietary needs. This growing awareness around pet health and the focus on specialized food products have been pivotal in the expansion of the pet industry.
Regionally, the United States leads the pet food market in revenue, producing nearly eight times as much as second-placed China in 2022. Although the U.S. generates the highest pet food revenue, North America ranks second in pet food production volume, with Europe leading in output with approximately 11.78 million metric tons in 2022.
Major players in the pet food market include Mars Petcare Inc., Nestlé Purina PetCare, and Hill’s Pet Nutrition, with Mars leading global revenues at USD 19 billion. Of the top pet food companies worldwide, most are headquartered in the U.S., highlighting the country’s dominance in the sector. Outside of the U.S., Japan’s Unicharm Corp. ranks among the most successful companies.
The U.S. pet industry encompasses pet food, supplies, services, and veterinary care, with food and treats constituting the largest market segment. Major U.S. retailers such as PetSmart and PETCO account for over 45% of the market. Furthermore, consumer preferences in pet food continue to evolve, mirroring human food trends, with increasing searches for organic, low-calorie, and CBD-infused pet products. These preferences underscore a broader focus on health and wellness, setting the stage for continued growth and innovation in the pet food industry.
Editor’s Choice
- The global Pet Food market is projected to reach USD 169.7 billion by 2033, up from USD 105.2 billion in 2023, growing at a CAGR of 4.9% during the forecast period.
- The direct-to-customer pet food market is expected to be valued at USD 2.8 billion in 2024 and grow at a CAGR of 20.6%, reaching USD 18.3 billion by 2034.
- The United Kingdom pet food market is anticipated to reach 2.99 billion pounds by 2025.
- In 2023, there was a 45% increase in searches for vegan pet diets compared to 2022.
- Millennials and Gen Z primarily purchase pet food online, while Gen X and baby boomers favor in-store purchases equally.
- The volume of pet food in China is expected to reach 1,037.6 kilotons by 2025.
- 61% of pet owners in the USA prioritize their pets’ well-being and happiness over their own.
- Wet dog food is the most popular category in Italy, holding a 41% market share.
- The American pet food market is projected to grow at an annual rate of 3.2%, reaching 59.47 billion kg by 2028.
- 20% of pet food brands include a protein source as one of their first three ingredients.
- Over half of Chinese pet owners purchase pet food 3 to 4 times a month, while 42.6% buy it 1 to 2 times a month, and 5.9% buy it more than 5 times monthly.
- Dry food accounted for 43.3% of the global pet food market in 2023, valued for its benefits, such as promoting healthy teeth in dogs.
- Dogs contributed 40% of pet food market revenue in 2023, with a strong consumer focus on dog health and care.
- Animal-source products dominate the pet food market, while plant-based options cater to specific dietary needs.
- In 2023, supermarkets/hypermarkets were the top distribution channel, holding 42.8% of the market share.
- North America led the regional market in 2023 with 39.3% of global revenues, driven by the trend of pet humanization.
You May Also Like To Read
- Pet Accessories Statistics
- Pet Ownership Statistics
- Pet Grooming Industry Statistics
- Pet Industry Statistics
General Pet Food Statistics
- According to a Gitnux report, 26% of millennials said they have purchased dog food online.
- The market value for the pet food segment in the United Kingdom is expected to reach 2.99 billion pounds by 2025.
- As of today, wet dog food is the most preferred pet food category in Italy, with 41% of the market share.
- According to Pet Food Statistics, 4% of pet owners said their pets have some sort of food allergies.
- The estimate shows that, by 2025, the volume of pet food sold in China will amount to 1,037.6 kilotons.
- 20% of the pet food brands report that their first three ingredients include a protein source for pets.
- Around 33% of pet owners have attempted to prepare meals at home for their pets.
- According to a report by Fact.mr, the worldwide direct-to-customer pet food market is projected to be valued at USD 2.8 billion in 2024. It is estimated to grow at a CAGR of 20.6%, reaching USD 18.3 billion by 2034.
- 2034 forecast show that the worldwide dry pet food market will reach USD 12.7 billion.
- Furthermore, by the similar forecast period, dog food sales are expected to reach USD 10.7 billion.
- As of 2023, dog food and cat food sales reported increases of 52.7% and 42.8%, respectively.
- 69% of the pet owners in the USA are interested in purchasing treats.
- 37% of Thai pet owners prefer to give environment-friendly food to their pets.
- Pet Food Statistics showed that 61% of pet owners in the USA said they value their pets’ well-being and happiness more than their own.
- According to a report by NIQ, in 2023, pet parents searched for vegan diets 45% times more compared to 2022.
- Cat food is considered to be the fastest-growing pet food category around the world.
- Since 2023, the market for grain-free and natural pet food has been slowly growing, with sales growing 4.8%, which is compared to non-free foods with a rate of 18.7%.
- As per a report by dogster.com, 58% of the produced pet food is dry.
Pet Food Market Forecast
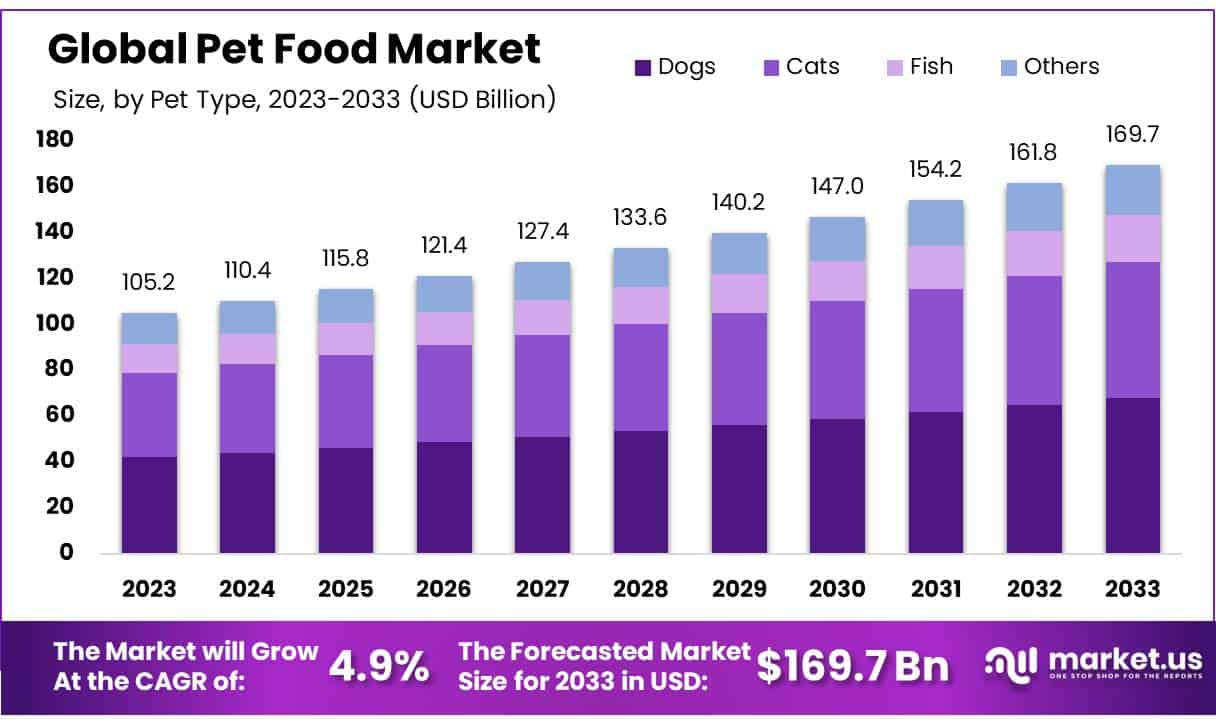
- According to Market.us, the global Pet Food market size is projected to reach USD 169.7 billion by 2033, up from USD 105.2 billion in 2023, growing at a CAGR of 4.9% from 2023 to 2033.
- Dry food accounted for 43.3% of the pet food market in 2023, favored for benefits like promoting healthy teeth in dogs.
- Dogs contributed 40% of pet food market revenue in 2023, with increasing consumer focus on dog health and care.
- Animal-source products dominate the pet food market, while plant-based options cater to specific dietary requirements.
- In 2023, supermarkets/hypermarkets were the leading distribution channel, capturing 42.8% of the pet food market share.
- North America led the global pet food market in 2023, holding 39.3% of total revenues, driven by trends in pet humanization.
US Total Cat and Dog Food Ingredient Quantities
According to the American Feed Industry Association, the following chart explains the ingredient quantities from farm to pet bowl, including dog treats, dog food moist, cat treats, cat food wet, cat food dry, dog food dry, and dog treats.
| Food Type | Value In million tons |
| Chicken | 584,098 |
| Meat and Bone meal | 533,253 |
| Corn gluten meal | 476,649 |
| Soybean meal | 427,155 |
| Water sufficient or processing | 385,565 |
| Chicken by-product meal | 262,828 |
| Water | 203,114 |
| Chicken meal | 197,374 |
| Poultry by-product meal | 195,010 |
| Wheat | 186,105 |
| Beef fat | 147,456 |
| Organ meat | 146,686 |
| Beef | 146,662 |
| Meat by-products | 135,316 |
| Animal Fat | 104,509 |
| Beef and Bone meal | 104,111 |
| Peas | 101,273 |
| Wheat Flour | 100,538 |
| Brewers Rice | 98,678 |
| Barley | 89,058 |
| Brown Rice | 77,241 |
| Chicken Broth | 70,580 |
| Rice | 67,319 |
| Soy Flour | 63,440 |
| Turkey | 62,321 |
| Lamb | 59,002 |
| Wheat Gluten | 58,425 |
| Salmon | 52,704 |
| Sorghum | 51,605 |
| Chicken fat | 48,569 |
| Corn Meal | 44,100 |
| Beet Pulp | 41,655 |
| Digest Flavor | 41,561 |
| Wheat Middlings | 39,580 |
| Poultry Broth | 39,580 |
| Fish | 38,496 |
| Fish meal | 33,923 |
| Lamb meal | 33,893 |
| Poultry | 31,269 |
| Beef by-products | 29,072 |
| Potatoes | 28,646 |
| Beef meal | 27,693 |
| Fish broth | 27,046 |
| Chicken by-products | 26,882 |
| Poultry by-products | 25,622 |
| Corn Germ Meal | 24,811 |
| Other animal by-products | 24,318 |
| Egg | 23,077 |
| Sweet potatoes | 22,818 |
| Corn syrup | 22,089 |
| Grains | 21,057 |
| Carrots | 20,733 |
| Whitefish | 20,348 |
| Cracked Pearled barley | 19,948 |
| Soybean hulls | 18,812 |
| Salmon Meal | 18,430 |
| Turkey Meal | 18,045 |
| Turkey by-product meal | 15,766 |
| Egg product | 15,594 |
| Beef broth | 15,026 |
| Poultry Fat | 14,514 |
| Pea Protein | 13,624 |
| Glycerin | 13,467 |
| Tuna | 12,697 |
| Pea Starch | 12,272 |
| Corn Grits | 11,421 |
| Flaxseed | 11,380 |
| Garbanzo beans | 10,931 |
| Cod | 10,270 |
| Corn starch | 9,863 |
| Pork | 9,345 |
| Meat meal | 8,861 |
| Soy grits | 8,560 |
| Rice Bran | 8,554 |
| Tapioca Starch | 8,399 |
| Cassava Root Flour | 6,827 |
| Split Peas | 6,131 |
| Lentils | 6,021 |
| Pork by-products | 5,913 |
| Milk | 5,665 |
| Chickpeas | 5,452 |
| Pea Fiber | 4,550 |
| Ocean Fish | 5,295 |
| Duck | 5,175 |
| Canola Oil | 5,175 |
| Tomato Pomace | 5,025 |
| Fish Oil | 4,823 |
| Cranberries | 4,688 |
| Oats | 4,544 |
| White rice | 4,478 |
| Sugar | 4,471 |
| Pork meal | 4,031 |
| Meat Broth | 3,954 |
| Turkey Broth | 3,862 |
| Canola Meal | 3,584 |
| Powdered Cellulose | 3,463 |
| Spinach | 3,187 |
| Corn Distillers Drief Grains | 3,132 |
| Pea Flou | 3,109 |
| Green Peas | 3,085 |
| High Fructose Corn Syrup | 3,071 |
| Oils | 2,980 |
| Vegetable Oil | 2,927 |
| Yams | 2,893 |
| Soybean Oul | 2,892 |
| Vegetable Glycerin | 2,881 |
| Cheese | 2,799 |
| Wheat Germ | 2,774 |
| Shrimp | 2,710 |
| Apples | 2,677 |
| Brewers Dried Yeast | 2,557 |
| Alfalfa Meal | 2,503 |
| Pearled Barley | 2,416 |
| Potato Starch | 2,389 |
| Soy Flakes | 2,363 |
| Venison | 2,250 |
| Oat Groats | 2,177 |
| Tuna Meal | 2,065 |
| Coconut | 1,950 |
| Tuna Broth | 1,857 |
| Tapioca | 1,674 |
| Tomato | 1,641 |
| Green Beans | 1,562 |
| Bacon | 1,561 |
| Malted Barley Flour | 1,515 |
| Whey | 1,493 |
| Chicken and Turkey Broth | 1,407 |
| Bison | 1,369 |
| Potato Protein | 1,363 |
| Soybean Germ Meal | 1,318 |
| Pumpkin | 1,301 |
| Corn Gluten Feed | 1,241 |
| Sunflower Oil | 1,096 |
| Liver flavor | 1,096 |
| Potato product | 1,079 |
| Lamb broth | 1,053 |
| Guar Gum | 1,044 |
| Parsley Flakes | 1,007 |
| Soy Protein Concentrate | 974 |
| Parsnip | 953 |
| Soy Protein Isolate | 907 |
| Lamb and Chicken broth | 897 |
| Crab Meal | 855 |
| Malted Barley Extract | 853 |
| Shrimp meal | 847 |
| Cheese Powder | 834 |
| Blueberries | 826 |
| Wheat Starch | 808 |
| Salmon Oil | 793 |
| Chicory Root | 709 |
| Animal Plasma | 699 |
| Egg whites | 688 |
| Cane Sugar | 683 |
| Gelatin | 673 |
| Oat fiber | 660 |
| Vegetable Broth | 650 |
| Kelp | 626 |
| Mackerel | 599 |
| Sole | 596 |
| Barley Flour | 570 |
| Pork Broth | 569 |
| Modified Food Starch | 544 |
| Caramel Color | 542 |
| Yellow Peas | 513 |
| Lentil Flour | 506 |
| Fructose | 496 |
| Rye Flour | 490 |
| Oat Flour | 487 |
| Natural Flavor | 461 |
| Bacon Fat | 448 |
| Seaweed Meal | 445 |
| Soybean Mill Run | 422 |
| Peanut Butter | 417 |
| Maltodextrin | 391 |
| Chard | 381 |
| Bakery Product | 368 |
| Beet Powder | 365 |
| Wild Rice | 355 |
| Pork Flavor | 343 |
| Modified Tapioca Starch | 336 |
| Faba Beans | 327 |
| Fava Beans | 323 |
| Hominy Feed | 315 |
| Hydrogenated Corn Syrup | 307 |
| Alfalfa | 306 |
| Rice Syrup | 306 |
| Corn Flour | 300 |
| Parsley | 295 |
| Malted Barley | 269 |
| Barley Malt Syrup | 261 |
| Skim Milk | 261 |
| Hydrolyzed Chicken Liver | 246 |
| Wild Boar | 245 |
| Cracked WHEAT | 227 |
| Bacon Broth | 223 |
| Avocado | 222 |
| Palm Oil | 219 |
| Chia Seed | 216 |
| Bone Meal | 209 |
| Lecithin | 205 |
| Tapioca Flour | 202 |
| Dried Brewers Yeast | 199 |
| Liver broth | 188 |
| Cheese product | 184 |
| Hydrolyzed Soy Protein | 181 |
| Xanthan Gum | 178 |
| Chickpea Flour | 169 |
| Quinoa Seed | 165 |
| Dried Yeast | 162 |
| Honey | 162 |
| Broccoli | 158 |
| Rye | 158 |
| Corn Oil | 154 |
| Long Grain Rice | 153 |
| Wheat Germ Meal | 144 |
| Molasses Beet Pulp | 144 |
| Salt | 144 |
| Millet | 136 |
| Dried Cane Molasses | 134 |
| Swede | 131 |
| Yeast Culture | 131 |
| Barley Grass | 127 |
| Apple Pomace | 134 |
| Crab | 119 |
| Animal Live Flavor | 113 |
| Dicalcium Phosphate | 109 |
| Rolled oats | 107 |
| Partially Hydrogenated Vegetable Oil | 101 |
| Rice Hulls | 101 |
| Pineapple | 90 |
| Sunflower Seed Meal | 90 |
| Blueberry Pomace | 88 |
| Dried Alfalfa Meal | 83 |
| Brewers Rice flour | 83 |
| Black Beans | 82 |
| Seabass | 78 |
| Whole Grain Corn | 78 |
| Raspberries | 77 |
| Organic Pea protein | 76 |
| Sweet Potato Flour | 71 |
| Psyllium Seed Husk | 70 |
| Nonfat Milk | 66 |
| Cheddar Cheese | 65 |
| Vegetables | 59 |
| Peanut Flour | 59 |
| Potato Flour | 58 |
| Natural and Artificial Flavours | 57 |
| Oat Hulls | 56 |
| Egg Powder | 54 |
| Oil Of Rosemary | 53 |
| Fresh Barlett Pears | 51 |
| Textured Soy protein | 51 |
(Source: afia.org)
Worldwide Pet Food Statistics
- The global pet food market offers a wide variety of products, including traditional kibble as well as natural and fresh food options. These products are increasingly influenced by human food trends, such as organic, free-from, and low-calorie choices.
- The market reached USD 123 billion in 2022 and continues to grow each year.
- The United States leads the pet food industry in revenue, generating almost eight times the revenue of China, which ranks second. The U.K. is also among the top markets.
- In the U.S., food and treats make up the largest portion of pet industry revenue, followed by veterinary services and pet-related products.
- Although the U.S. is the top market for revenue, North America is the second-largest in terms of pet food production volume.
- Europe led in production volume in 2022, with approximately 11.78 million metric tons of pet food produced.
- Mars Petcare Inc., based in the U.S., was the world’s largest pet food company in 2021, generating USD 19 billion in revenue.
- Other leading companies following Mars include Nestlé Purina PetCare and Hill’s Pet Nutrition.
- The top eight pet food companies worldwide are based in the United States, emphasizing the country’s leading role in the industry.
- Outside of the U.S., Unicharm Corp. from Japan stands out as the most successful pet food company.
Canada Pet Food Statistics
- The pet food market in Canada ranks as the tenth largest in the world.
- Canada has over 16 million pet cats and dogs, and there are hundreds of pet stores across the country to serve pet owners.
- Ontario leads with the most pet and pet supply stores, having over 840 stores as of December 2022.
- In Canada, the average annual cost of caring for a dog is around CAD 4,000, with the largest expense being dog food.
- Dog owners in Canada typically spend an average of CAD 1,200 annually on dog food.
- For cats, the annual care cost is around CAD 2,500, with an average CAD 575 spent on cat food.
- The consumer price index for pet food and supplies in Canada reached 175.7 points in 2022, reflecting rising costs.
- Ontario also has the highest number of animal food manufacturing establishments in Canada, with 135 locations as of December 2022.
- Leading Canadian pet food companies include Champion Petfoods, PLB International, and FirstMate Pet Foods.
- Canada has a significant pet food export market, valued at over USD 789 million in 2022.
- The primary export destinations for Canadian pet food are the United States and China, which account for most of this market.
France Pet Food Statistics
- In France, over 50% of households own one or more pets, with cats and dogs being the most popular, while fish remain the most numerous in terms of population.
- The pet food market in France is expected to reach USD 4.95 billion by 2025, with steady growth over the past decade.
- Cat food is the highest-grossing segment in the French pet food market.
- The demand for healthier and sustainable pet food is rising, as pet owners mirror their health and wellness priorities in their pets’ diets.
- Consumer preference has shifted toward premium, organic, and natural products, including options with gluten-free, raw, or vegan ingredients.
- There is an increased focus on pet foods that address specific health issues, such as dental health, fur quality, and kidney health.
- Although pet food distribution is mainly through specialty stores, supermarkets, and garden centers, online sales have also significantly driven market growth.
- Some pet food manufacturers in France offer subscription packages, while others sell exclusively online, a model that has become popular in recent years.
Italy Pet Food Statistics
- Italy is home to approximately 10.2 million cats and 8.8 million dogs, making it one of the countries with the largest domestic animal populations in Europe.
- The country has the highest number of ornamental birds in Europe, with nearly 13 million residing in Italian households.
- Other popular pets include nearly 30 million fish, just under 2 million small animals (such as hamsters and rodents), and 1.4 million reptiles.
- In 2018, 27% of Italian households owned at least one dog, while 18% had a cat. By 2022, these percentages equalized, with both dogs and cats owned by 25% of households.
- The dog and cat food market reached a sales value of nearly 2.8 billion euros in 2022, showing steady growth over recent years.
- Cat food sales were higher than dog food, totaling almost 1.5 billion euros, while dog food sales were just under 1.3 billion euros.
- In terms of pet food types, cats showed a preference for wet food, whereas dogs preferred dry food.
- Italians primarily purchase pet food in supermarkets, which represent the largest distribution channel by market value.
- Traditional pet shops accounted for approximately 674 million euros in sales in 2022, with an increase in value, although volume remained stable.
- Pet shop chains saw considerable growth, with the sales value of pet food exceeding 385.1 million euros in 2022, indicating increased competition with both traditional pet stores and retail outlets.
Mexico Pet Food Statistics
- In 2019, Mexico ranked among the largest pet food markets globally and held the second-largest market position in Latin America after Brazil.
- Dogs and cats are the dominant pets in Mexican households, making them the primary drivers of pet food sales in the country.
- The production volume of dog and cat food was estimated to reach 1.2 million metric tons in 2020.
- Leading pet food companies Mars and Nestlé held the largest share of pet food retail sales in Mexico, with brands like Pedigree and Whiskas from Mars and Purina Dog Chow and Cat Chow from Nestlé, collectively capturing over 60% of the market.
- Dog food is the most produced and consumed pet food in Mexico, generating nearly 16 billion Mexican pesos annually.
- The Mexican dog food industry serves both domestic and international markets, with dry dog food as the most consumed type, producing over USD 1.8 billion in sales revenue in 2020.
- Dog food production volume in Mexico has doubled over the past decade, reinforcing its position as the largest pet food segment.
- Cat food sales volume was estimated at 138 thousand metric tons in 2020, accounting for less than 15% of total dog food sales.
- Although dry food remains the top choice for cats, wet cat food is rising in popularity, with sales expected to grow by 25% from 2020 to 2022 due to its hydration benefits.
- Effem México (a Mars subsidiary) and Nestlé México are among the leading producers of cat food in Mexico.
United Kingdom Pet Food Statistics
- The United Kingdom pet food market ranks as the second largest globally, following the United States.
- In 2022, spending on pets and pet products in the United Kingdom rose by nearly 6%, reaching around £9.9 billion.
- On average, a United Kingdom household spends approximately £2.80 per week on pet food.
- Although most United Kingdom consumers still prefer to buy pet food in physical stores, online shopping for pet food is expected to increase in the coming years.
- By 2022, 3.6% of pet food purchases in the United Kingdom were made online, with this number projected to grow to 6.6% by 2027.
- The COVID-19 pandemic in 2020 likely caused a short-term boost in online pet food sales.
- Petsathome.com led the United Kingdom’s online pet food market, generating USD 270.5 million in online sales in 2022.
- The United Kingdom imports much more pet food than it exports, with imports up by more than 57% since 2014.
- In 2022, the United Kingdom imported over 607 million kilograms of pet food, mainly from European countries.
- France and Germany were the top sources of pet food imports to the United Kingdom in 2022.
- In contrast, United Kingdom exports of dog food amounted to only about 192 million kilograms in 2021.
China Pet Food Statistics
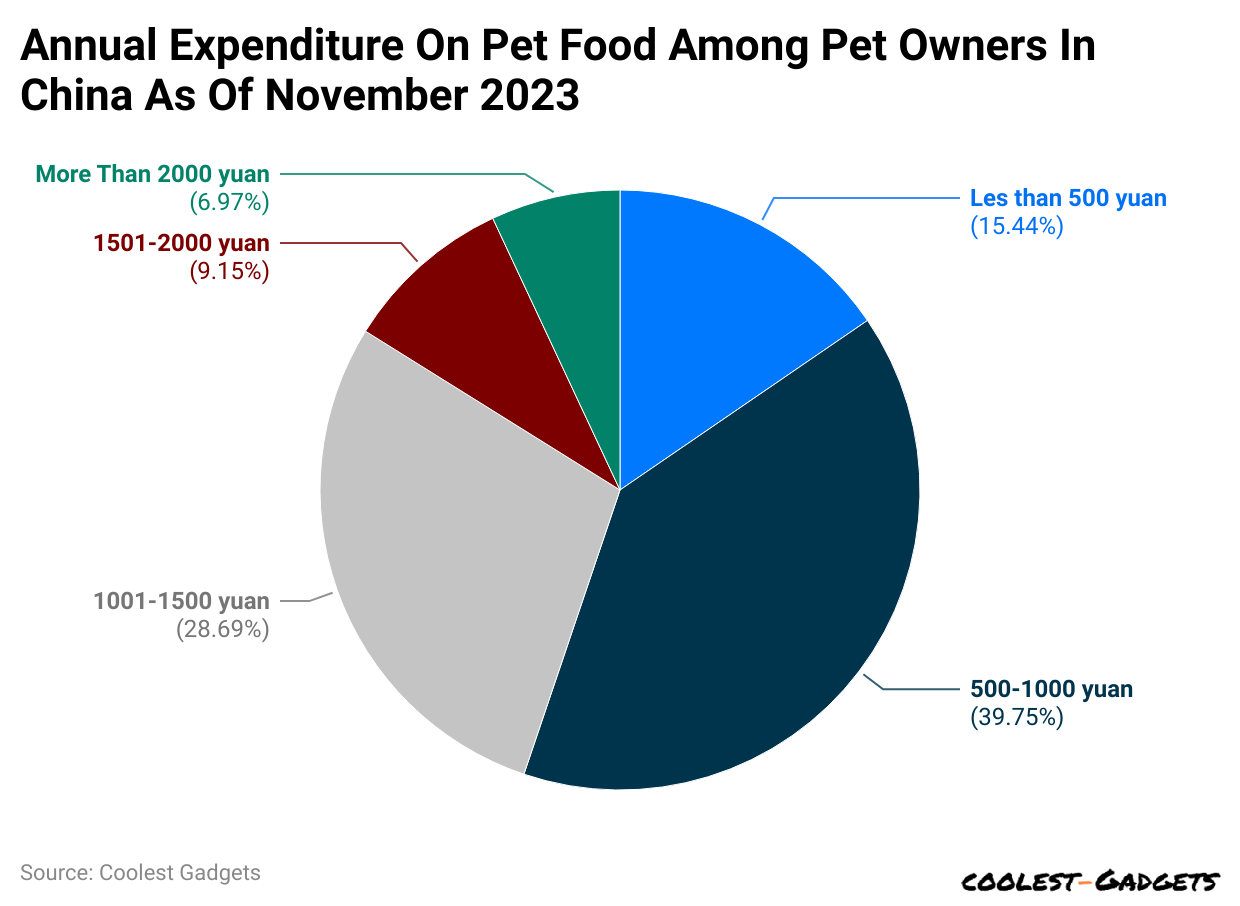
(Reference: statista.com)
- According to a Statista survey, most Chinese pet owners spent between 500 and 100 yuan on pet food in 2023.
- The least spent was more than 2000 yuan or 6.97%.
Monthly Frequency of Buying Pet Food in China
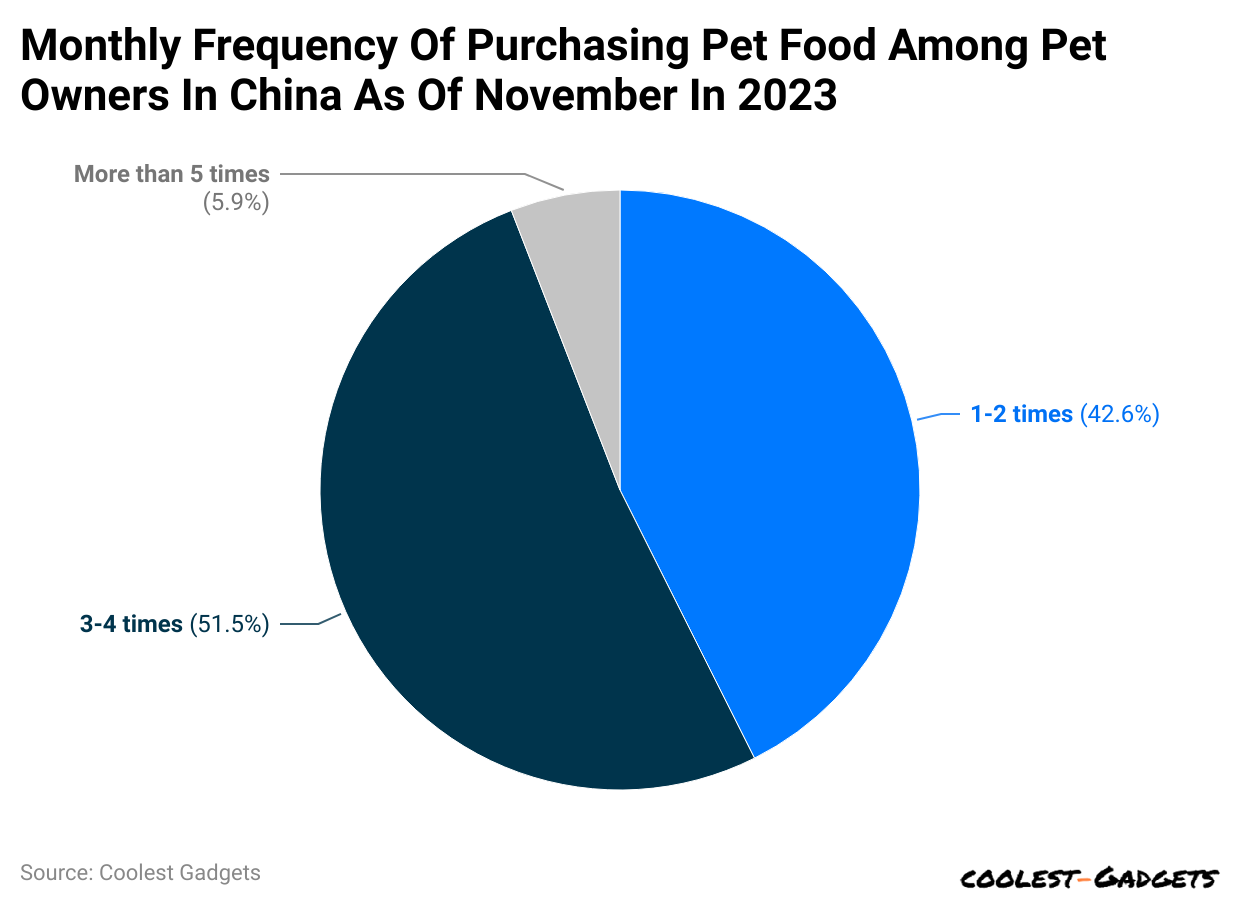
(Reference: statista.com)
- More than half of Chinese pet owners purchase pet food at least 3 to 4 times a month, while 42.6% said they do it for 1 to 2 times.
- Meanwhile, 5.9% of owners purchased food for their pets more than 5 times.
Revenue Change Over the Years
| Years | Revenue change (in billion USUSD ) |
| 2018 | 88.91 |
| 2019 | 98.57 |
| 2020 | 111.90 |
| 2021 | 121.00 |
| 2022 | 133.70 |
| 2023 | 143.60 |
| 2024 | 149.90 |
| 2025 | 158.60 |
| 2026 | 167.70 |
| 2027 | 177.40 |
| 2028 | 186.10 |
- Surprisingly, according to Pet Food Statistics, revenue worldwide has significantly changed since the lockdown. With constant upward rates, the revenue is expected to reach USD 186.10 billion by the forecast period.
- In addition, the following chart explains the year-on-year average revenue per capita change. Revenue per capita will grow significantly in the global market, with a slight decrease in growth in 2024.
| Years | Average Revenue per capita (in billion USD ) | Average Revenue Per Capita |
| 2018 | 12.08 | 12.08 |
| 2019 | 13.26 | 13.26 |
| 2020 | 14.91 | 14.91 |
| 2021 | 16.00 | 16.00 |
| 2022 | 17.53 | 17.53 |
| 2023 | 18.69 | 18.69 |
| 2024 | 19.34 | 19.34 |
| 2025 | 20.30 | 20.30 |
| 2026 | 21.30 | 21.30 |
| 2027 | 22.35 | 22.35 |
| 2028 | 23.27 | 23.27 |
(Source: statista.com)
The Volume of Pet Food Produced By Region
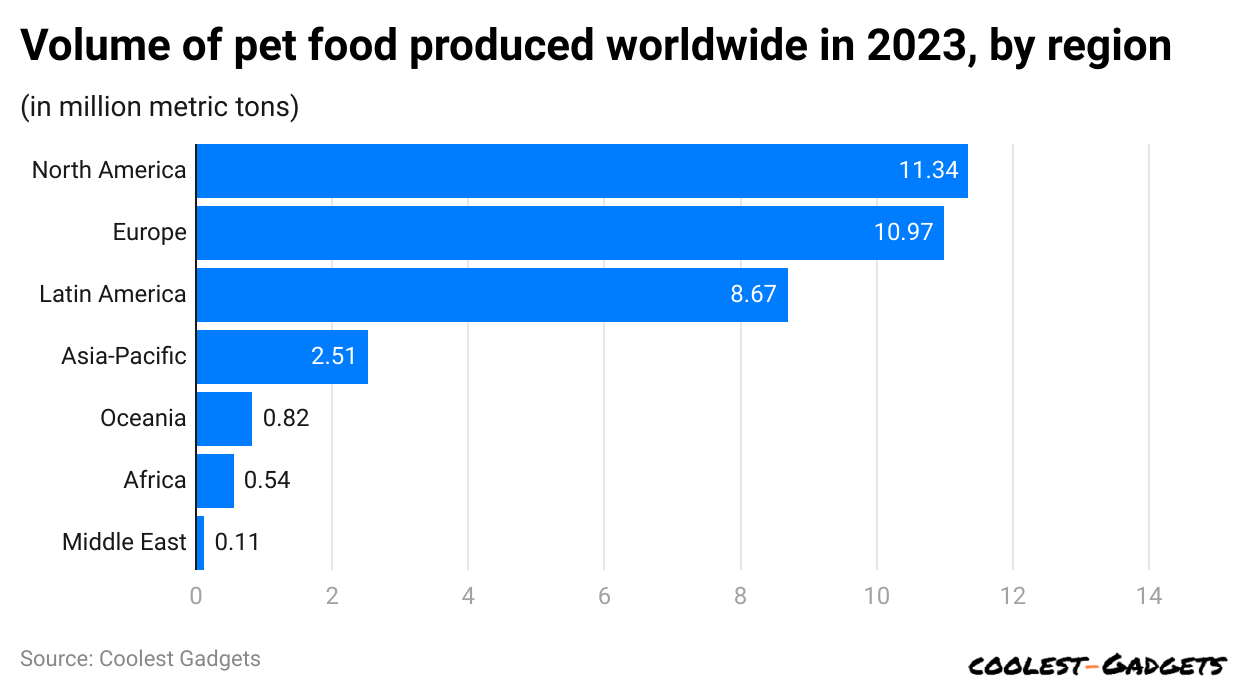
(Reference: statista.com)
- About Pet Food Statistics 2023, comparatively, North America produced most of the pet food, contributing 11.34 million metric tons.
- With a minor difference, Europe reported 10.97 million metric tons of production.
- Furthermore, Latin America and Asia-Pacific ranked respectively with more than 10 million metric tons of production collectively.
Revenue of the Pet Food Market Worldwide in 2023
| Country | Revenue (in million U.S. dollars) |
| United States | 57,384.64 |
| China | 7,419.96 |
| United Kingdom | 7,224.56 |
| Brazil | 6,287.95 |
| Germany | 5,724.11 |
| France | 4,998.58 |
| Japan | 4,619.43 |
| Turkey | 4,176.62 |
| Italy | 3,833.27 |
| Canada | 3,735.68 |
| Australia | 2,952.06 |
| Mexico | 2,506.59 |
| Spain | 2,022.42 |
| Russia | 1,940.34 |
| Indonesia | 1,847.64 |
| Poland | 1,634.53 |
| Thailand | 1,500.34 |
| Netherlands | 1,350.73 |
| Argentina | 1,178.59 |
| Belgium | 853.49 |
| Iran | 774.42 |
| Switzerland | 699.22 |
| Saudi Arabia | 234.77 |
| Nigeria | 200.26 |
| Egypt | 119.98 |
(Source: statista.com)
Pet Food Sales Worldwide
| Year | Sales in billion US. Dollars |
| 2010 | 59.3 |
| 2011 | 62.4 |
| 2012 | 65.9 |
| 2013 | 69.6 |
| 2014 | 73.3 |
| 2015 | 77.7 |
| 2016 | 72.25 |
| 2017 | 75 |
| 2018 | 91.1 |
| 2019 | 93.9 |
| 2020 | 102.6 |
| 2021 | – |
| 2022 | 123.6 |
| 2023 | 133.9 |
(Source: statista.com)
- Over the years, the sale of pet food worldwide has notably increased.
- During the lockdown in 2020, compared to previous years, it performed very well, with USD 102.6 billion in sales worldwide.
The Average Price of Specialized Pet Food in the USA By Product Type
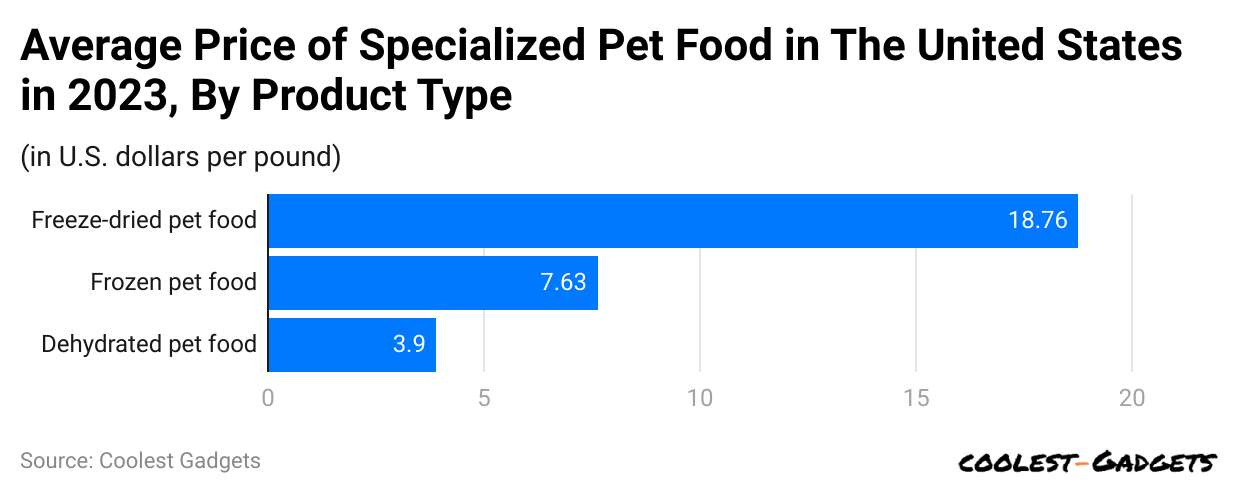
(Reference: statista.com)
- According to Pet Food Statistics 2023, in the USA, freeze-dried pet food is the most expensive food category for pets, with an average price of USD 18.76 per lb. On the other hand, dehydrated pet food has the opposite price
Pet Market Sales in the USA By Category
| Year | Food and Treats | Vet Care and Product Sales | Other Services | Supplies, live animals & OTC medicine |
| 2018 | 34.5 | 27.7 | 9.7 | 18.6 |
| 2019 | 36.9 | 29.3 | 10.3 | 19.2 |
| 2020 | 42 | 31.2 | 8.1 | 22.1 |
| 2021 | 50 | 34.3 | 9.5 | 29.8 |
| 2022 | 58.1 | 35.9 | 11.4 | 31.5 |
| 2023 | 64.4 | 38.3 | 12.3 | 32 |
(Source: statista.com)
- In 2023, pet food was reported to be the highest-selling category in total pet market sales, which generated USD 64.4 billion in sales of food and treats.
- Compared to that, Vet care and products, supplies and medicine, and other services ranked respectively.
Preferred Sales Channel For Pet Food By US Consumers By Generation
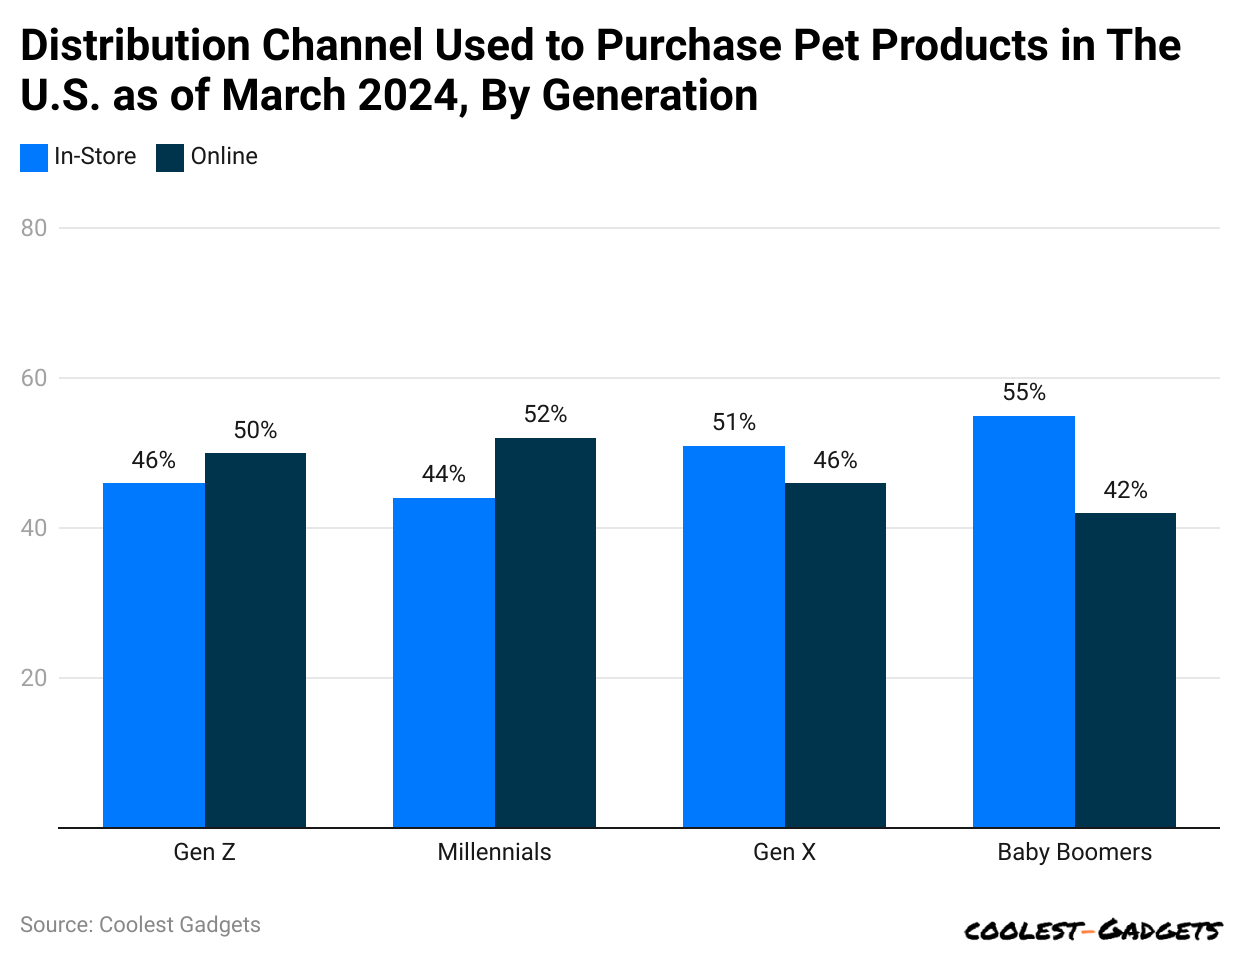
(Reference: statista.com)
- Compared to baby boomers, who prefer to shop for pet food in stores, millennials and Gen Z purchase it online.
- However, Gen X and baby boomers almost equally share the preference for in-store purchases.
Sales of Leading Vendors in the USA (Dog biscuits, beverages, treats)
- In 2023, Big Heart Pet Brand generated a total sale of 1,056.92 million, including treats, dog biscuits, and beverages. Other leading brands include Private labels, Nestlé Purina Petcare, Mars Petcare, etc.
| Brand | Sales (in million U.S dollars) |
| Big Heart Pet Brands | 1,056.92 |
| Private Label | 604.1 |
| Nestlé Purina PetCare | 514.79 |
| Mars Petcare | 390.48 |
| Blue Buffalo | 379.8 |
| Petmatrix | 208.11 |
| Spectrum Brands | 87.9 |
| Arthur Pet Products | 80.88 |
| Post Consumer Brands | 74.66 |
| Waggin’ Train | 48.01 |
(Source: statista.com)
Top North American Pet Specialty Chains By Store Count
In 2023, PetSmart became the largest pet specialty retail chain in North America, with more than 1,600 stores. The brand also has birds, reptiles, fish, and dogs for sale and adoption.
| Brand | Number of Stores |
| PetSmart | 1,665 |
| PETCO | 1,500 |
| Pet Supplies plus | 667 |
| Pet Valu | 512 |
| Pet Supermarket | 220 |
| Woof Gang Bakery | 220 |
| Global Pet foods | 215 |
| Petsense | 188 |
| Petland | 138 |
| Hollywood Feed | 97 |
| Bosley’s by Pet Valu | 87 |
| Mondou | 83 |
| Chico Pet Stores | 82 |
| Pet People | 73 |
| Earthwise Pet Supply | 72 |
| Unleashed by Petco | 65 |
| Pet Food Express | 64 |
| Mud Bay | 64 |
| Pet Planet | 60 |
| Chuck & Don’s Pet Food | 49 |
Price Increase Per Unit of Dog and Cat Food By Category
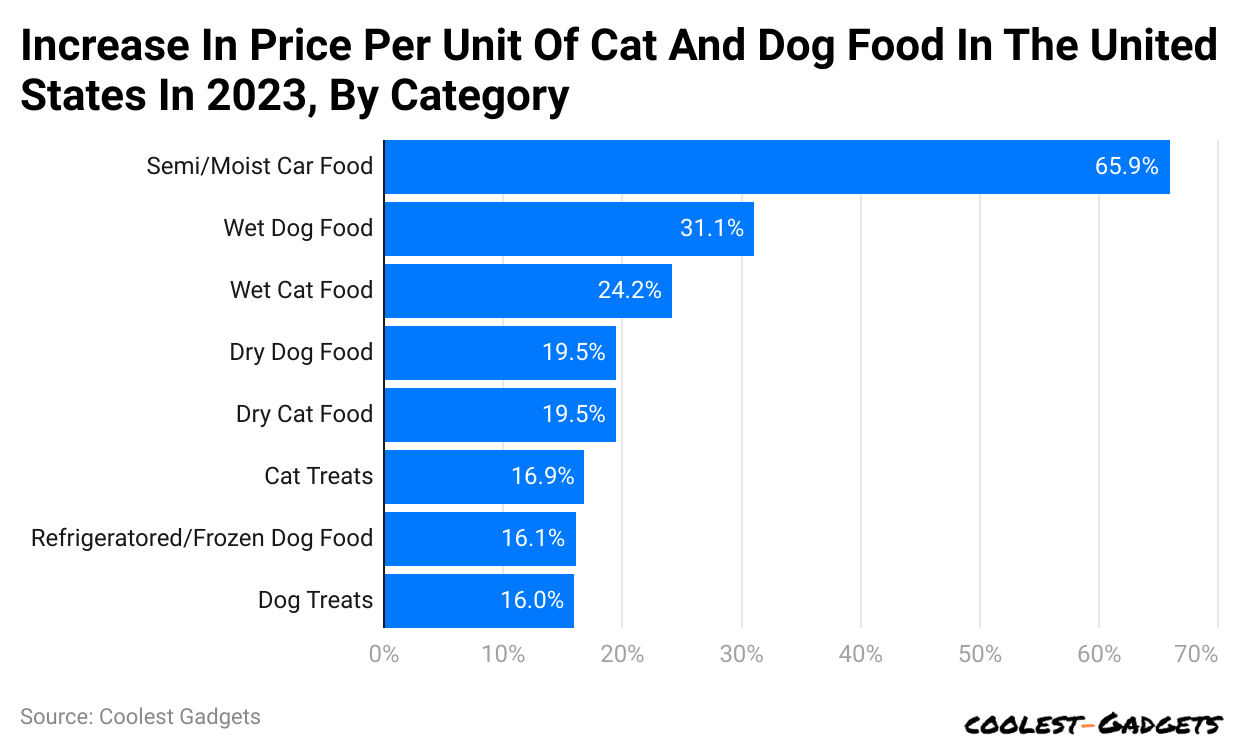
(Reference: statista.com)
- About cats and dogs, wet and dry food, semi-moist cat food, was reported to have the highest price increase in the USA, with 65.9%.
- However, other product categories had less than 50% increases each.
Main Drivers of Pet Food Purchase Decisions
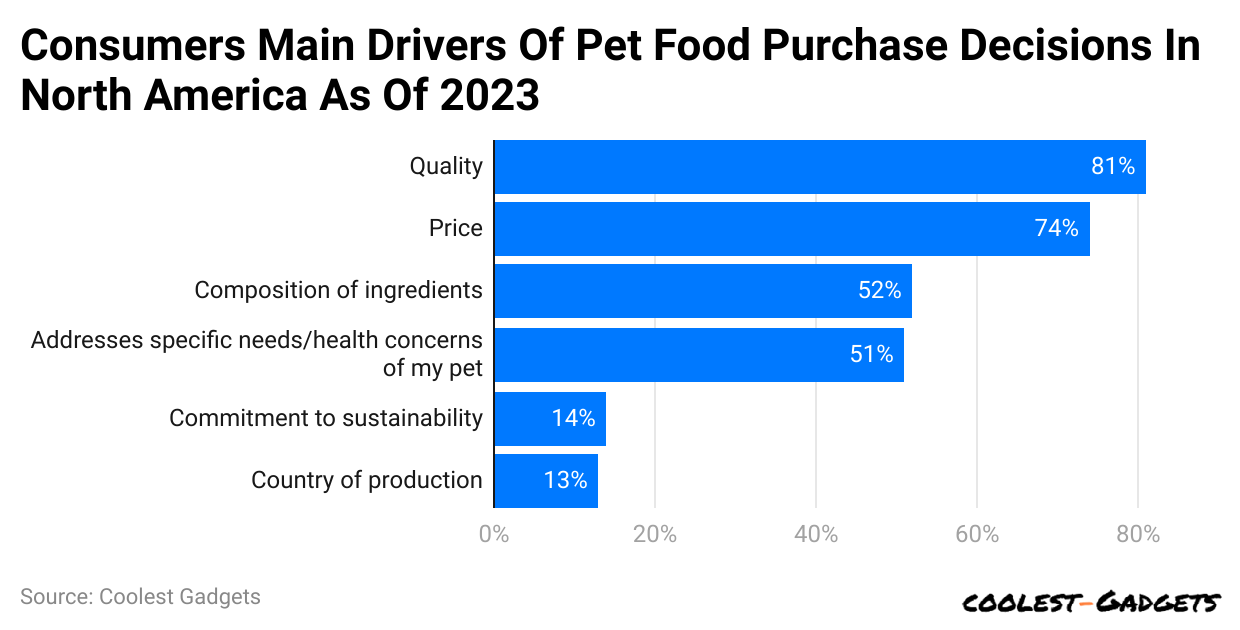
(Reference: statista.com)
- Pet parents in North America give primary importance to the quality of the food (81%), while clothes pay attention to prices (74%).
- Furthermore, other leading drivers of pet food purchase decisions include the composition of ingredients (52%), addressing specific needs/health concerns of pets (51%), commitment to sustainability (14%), and country of production (13%).
Pet Food Import Value in South Korea By Country
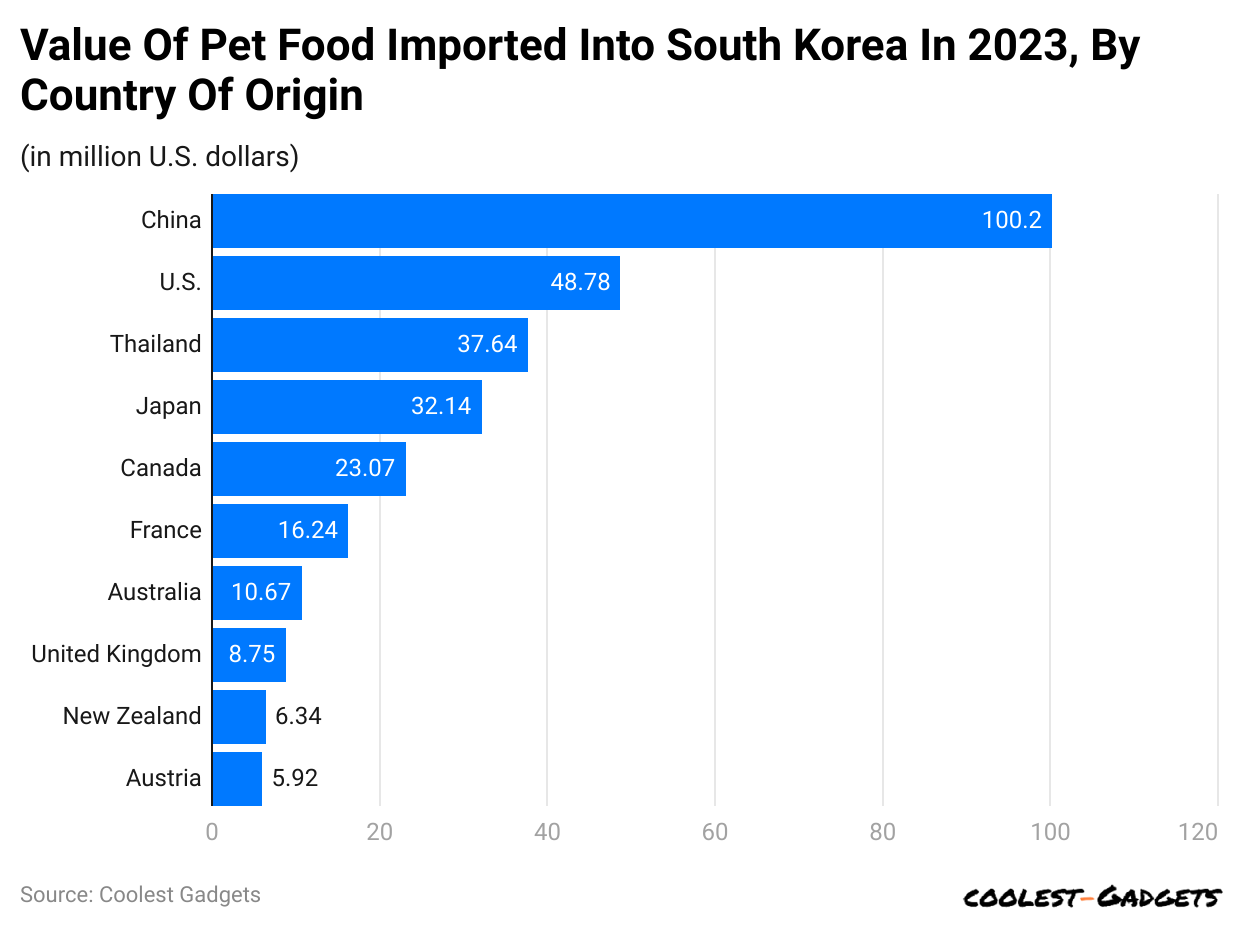
(Reference: statista.com)
- Most of the pet food was imported from China, worth USD 100.02 million.
- Compared to all the countries from which South Korea imported pet food, this amounts to around USD 307.5 million.
You May Also Like To Read
- Backpack Statistics
- Travel Backpack Statistics
- Circular Saw Statistics
- Inflatable Tent Statistics
- Hedge Trimmer Statistics
- Walkie Talkie Statistics
- Tactical Flashlight Statistics
- Binoculars Statistics
- Pet Accessories Statistics
- Solar Charger Statistics
- Solar Powered Wrist Watch Statistics
- Light Bulbs Statistics
- Plugs Statistics
Wet Dog Food
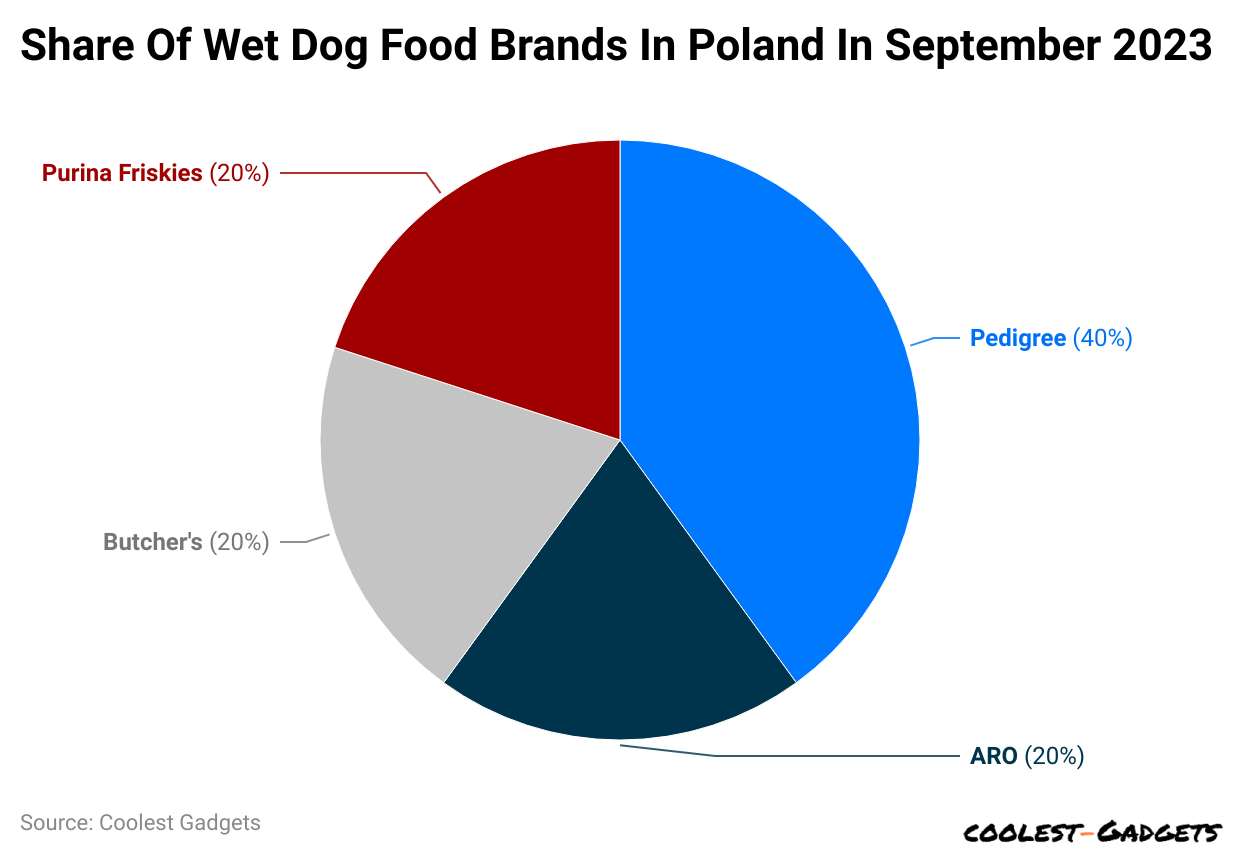
(Reference: statista.com)
- Pedigree has captured the majority of market share in Poland, with 40% in the wet dog food segment.
- Other brands, including ARO, Butcher’s, and Purina Friskies, share 20% each.
Wet Cat Food Brands
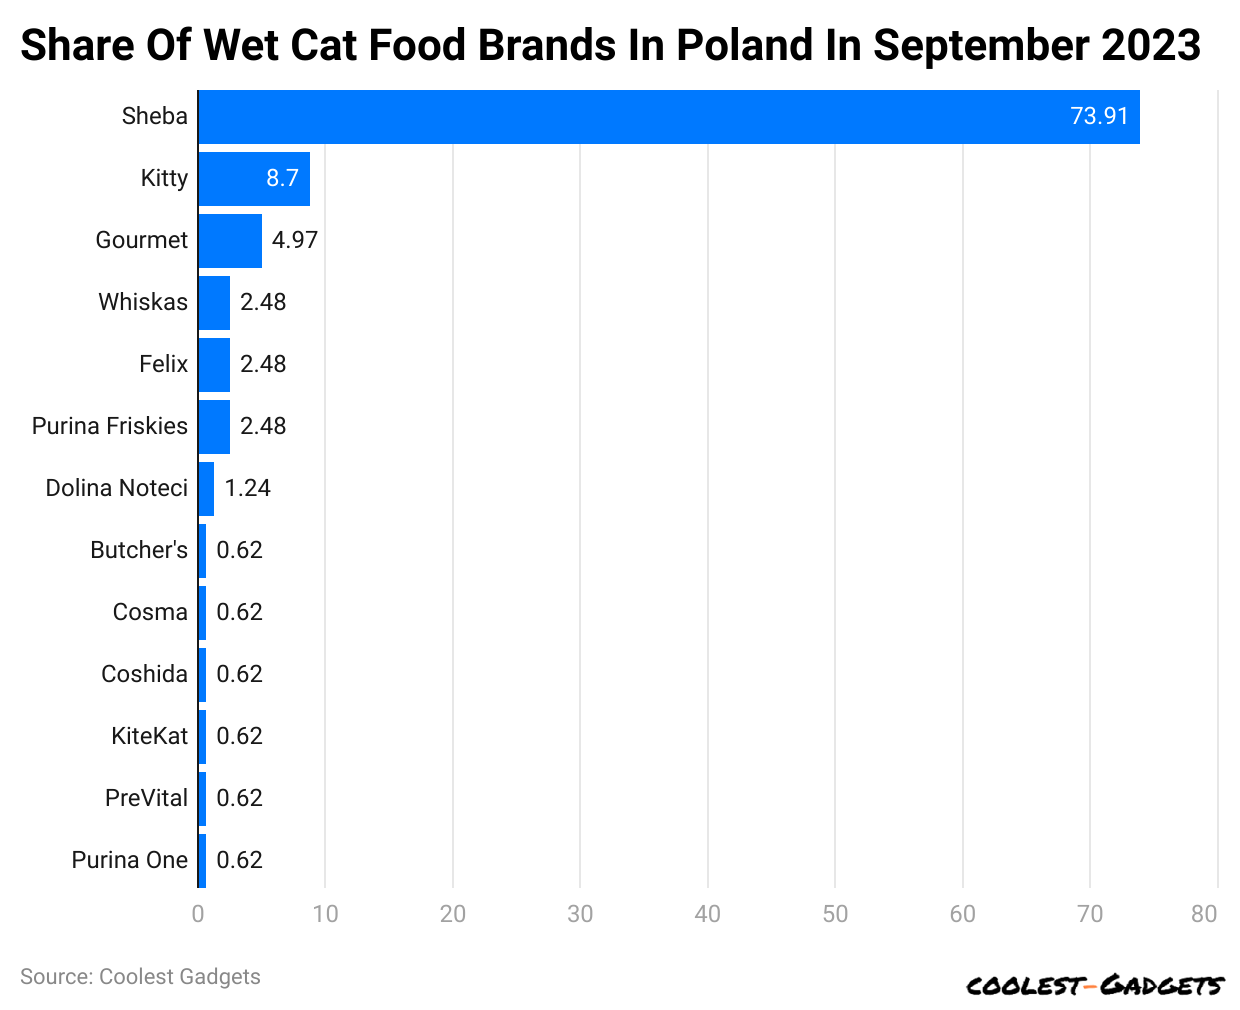
(Reference: statista.com)
- In addition to the best-wet dog food brands in Poland, Sheba represents the majority of the market for wet cat food, contributing 73.91%.
- Compared to the leading cat food brand, others have less than 10% of the share respectively.
United Kingdom
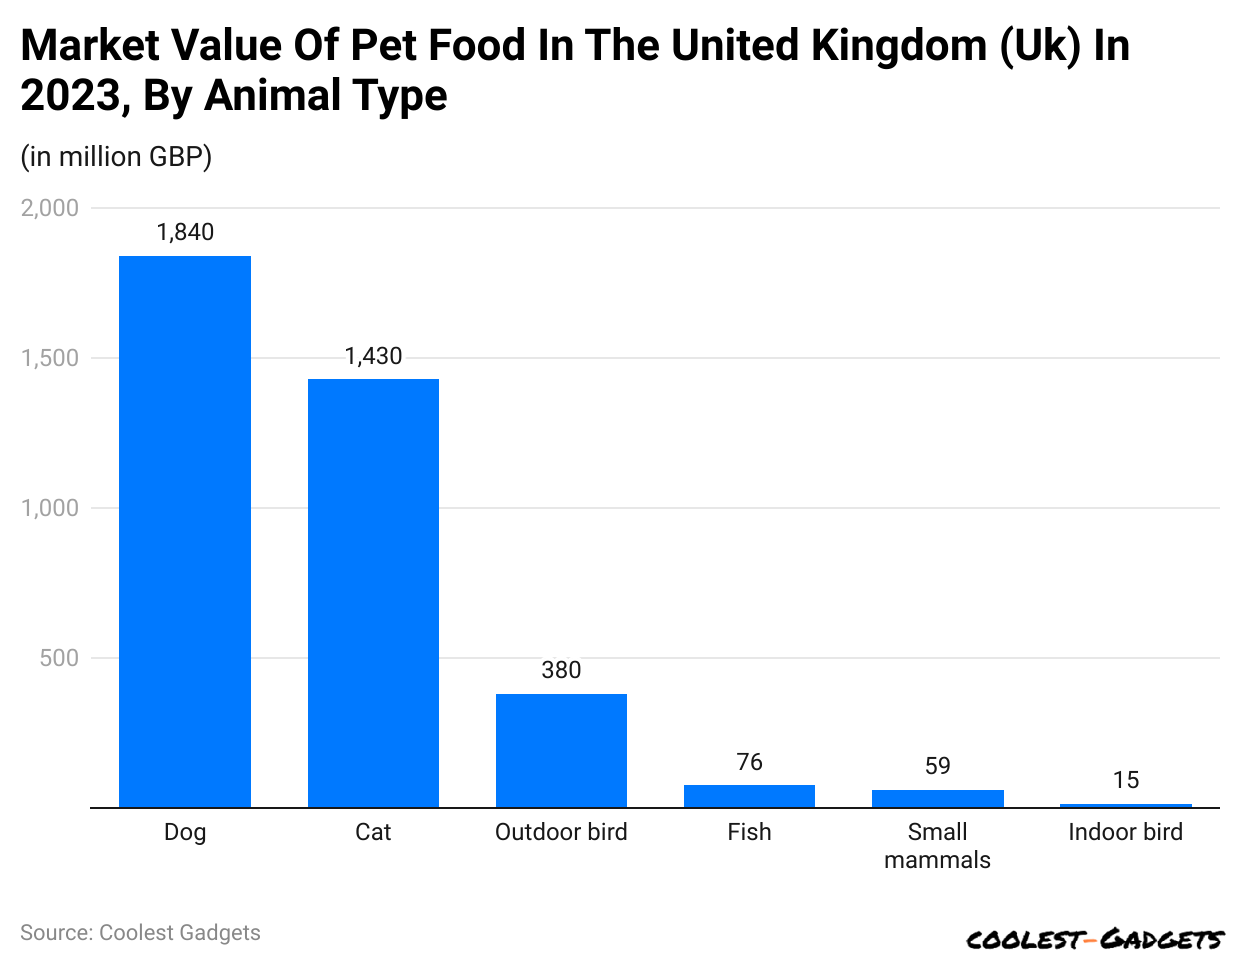
(Reference: statista.com)
- As of 2023, dog food in the United Kingdom was reported to have the highest market value with 1,840 million GBP, with some differences, such as cat food ranking second.
- However, food for outdoor birds, fish, small mammals, and indoor birds had a significantly lower market share, accounting for less than 600 GBP collectively.
Conclusion
The pet food industry is a testament to the deep bond between humans and animals. As pet owners continue to view their pets as cherished members of the family, the demand for high-quality, personalized, and sustainable pet food is likely to continue its upward trajectory, as seen in these Pet Food Statistics.
This translates to a future where our furry companions have access to a wider range of delicious, nutritious options that cater to their individual needs and well-being.
Sources
Pramod Pawar brings over a decade of SEO expertise to his role as the co-founder of 11Press and Prudour Market Research firm. A B.E. IT graduate from Shivaji University, Pramod has honed his skills in analyzing and writing about statistics pertinent to technology and science. His deep understanding of digital strategies enhances the impactful insights he provides through his work. Outside of his professional endeavors, Pramod enjoys playing cricket and delving into books across various genres, enriching his knowledge and staying inspired. His diverse experiences and interests fuel his innovative approach to statistical research and content creation.