Nestle Statistics By Demographics, Sales, Revenue and Facts

Updated · Mar 11, 2025


TABLE OF CONTENTS
Introduction
Nestlé Statistics: Nestlé, one of the world’s largest food and beverage companies, has a strong global presence with operations in nearly every country. The company’s financial performance, market reach, and product diversity make it a dominant player in the industry. With billions in annual revenue, Nestlé continues to expand through innovation and strategic acquisitions. Its portfolio includes well-known brands such as Nescafé, KitKat, and Maggi, catering to a vast consumer base.
A focus on health, sustainability, and digital transformation drives Nestlé’s market growth. By analysing key statistics, such as sales figures, market share, and regional performance, one can gain insights into how Nestlé maintains its leadership in the competitive global food industry.
Editor’s Choice
- In 2024, Nestlé reported organic sales growth of 2.2% and real internal growth of 0.8%.
- Nestle Statistics show that the company’s net sales reached CHF 91.35 billion, a slight decrease from CHF 93 billion in 2023.
- The underlying trading operating profit margin stood at 17.2%.
- The net profit for 2024 was CHF 10.884 billion, down from CHF 11.209 billion in 2023.
- Nestlé’s net debt increased to CHF 56.005 billion in 2024, up from CHF 49.390 billion in 2023.
- Capital expenditures for 2024 amounted to CHF 5.963 billion, compared to CHF 5.714 billion in 2023.
- The company generated a free cash flow of CHF 10.666 billion in 2024, slightly up from CHF 10.403 billion in 2023.
- Nestlé plans to increase investment in advertising and marketing to 9% of sales by the end of 2025 to support growth.
- The company expects the underlying trading operating profit margin to narrow to 16% or more in 2025 as it invests for growth.
- Projected net sales for 2025 are CHF 96.01 billion, a 5.1% increase from 2024.
You May Also Like To Read
Product Range of Nestle
- Nestlé offers a wide variety of food and beverage products that people enjoy worldwide.
- Their popular drinks include Nescafé, Nesquik, Milo, and Nestea, which is made in partnership with Coca-Cola.
- Coffee lovers can choose from well-known brands like Nescafé, Nespresso, and Dolce Gusto.
- They sell brands such as Perrier, Poland Spring, and Vittel in bottled water. For breakfast, they produce cereals like Cheerios, Chocapic, and Nesquik Breakfast Cereal.
- Their chocolate and confectionery range features Aero, Kit Kat (outside the US), Smarties, and Toll House cookies. Nestlé also provides frozen foods under brands like Stouffer’s, Hot Pockets, and Häagen-Dazs.
- They offer Purina, Felix, and Friskies in pet care. Its healthcare nutrition products include Boost, Carnation Instant Breakfast, and Optifast.
- The Maggi brand is well-known for seasonings and culinary products. Other offerings include Coffee-Mate, Milo, Nestlé Omega Plus, and yogurts like Molico, La Laitière, and Ski Dairy.
- Nestlé also owns a large share in L’Oréal.
General Nestle Statistics
- Nestlé India, a subsidiary of Nestlé S.A., is based in Gurgaon, Haryana.
- The company has made progress in reducing emissions, cutting them by 6.4 million tonnes to reach 93.3 million tonnes, which is lower than the expected 99.7 million tonnes.
- In 2023, Nestlé generated around 93.35 billion CHF in revenue, reflecting a 1.51% decline from the previous year.
- Nestlé India aims to achieve domestic sales of Rs. 1 lakh crore (approximately 13.4 billion USD) by 2025.
- The highest political donation from a Nestlé employee was 7,750 USD, given by Louise Hilsen to the Democratic Party.
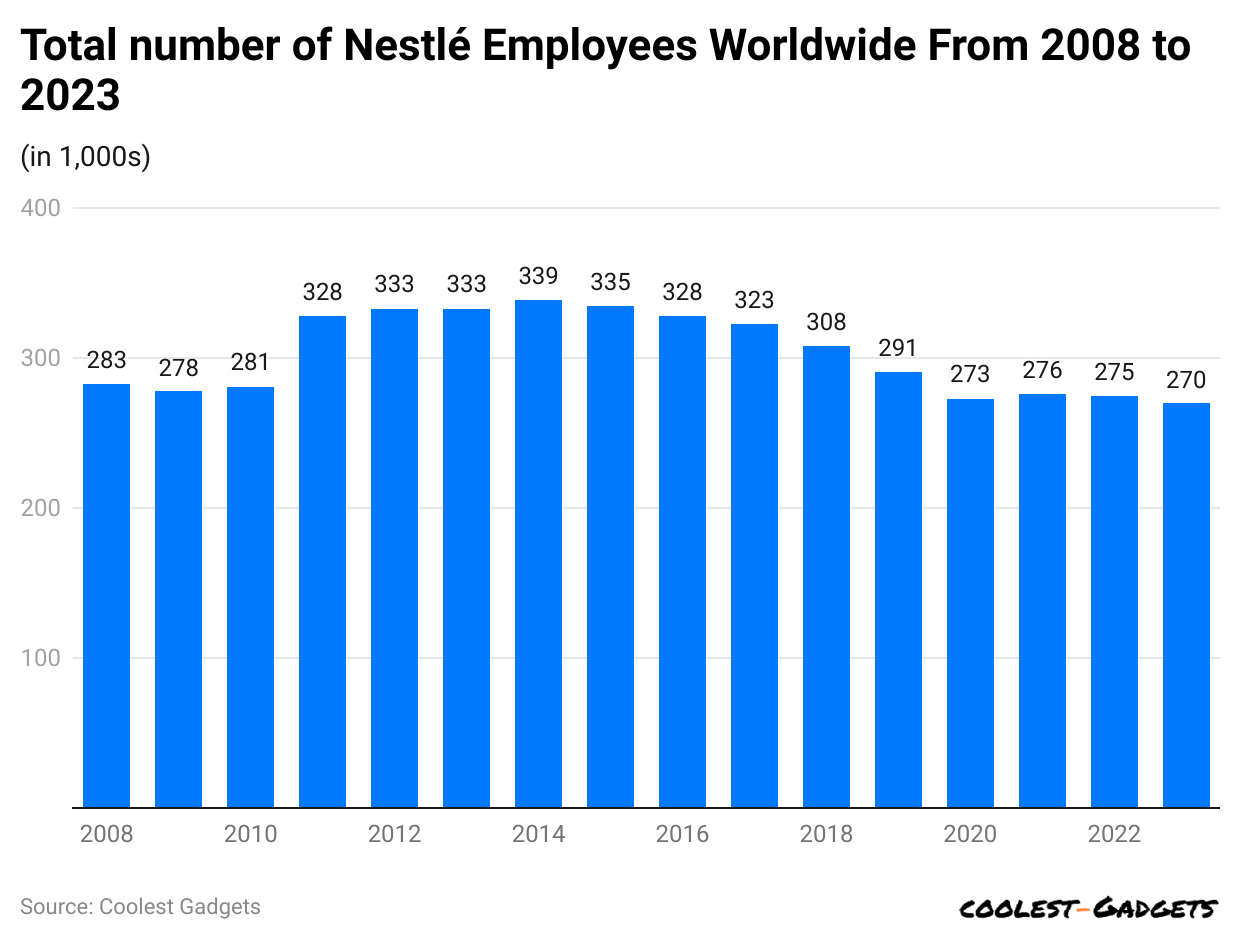
- Nestlé’s workforce consists of 36% female and 61% male employees. In 2023, the company employed around 270,000 people worldwide.
- Headquartered in Vevey, Switzerland, Nestlé remains the biggest consumer goods producer.
- North and South America contribute the most to its sales. In the first half of 2023, total sales increased by 1.6% to 46.3 billion CHF.
Nestlé Facts and Strategies
- Nestlé is known for its strategic approach to growth through acquiring and selling businesses, maintaining its position as the largest Fast Moving Consumer Goods (FMCG) company globally.
- A prime example is its success in North America with pet care products, driven by acquisitions like Spillers Petfoods and Ralston Purina, which greatly expanded its presence in the US pet food market.
- Recent acquisitions highlight Nestlé’s strategy: it bought a majority stake in Brazilian premium chocolate company Grupo CRM, which added brands like Kopenhagen and Brazil Cacau to its portfolio, and it acquired Seattle’s Best Coffee from Starbucks in 2022.
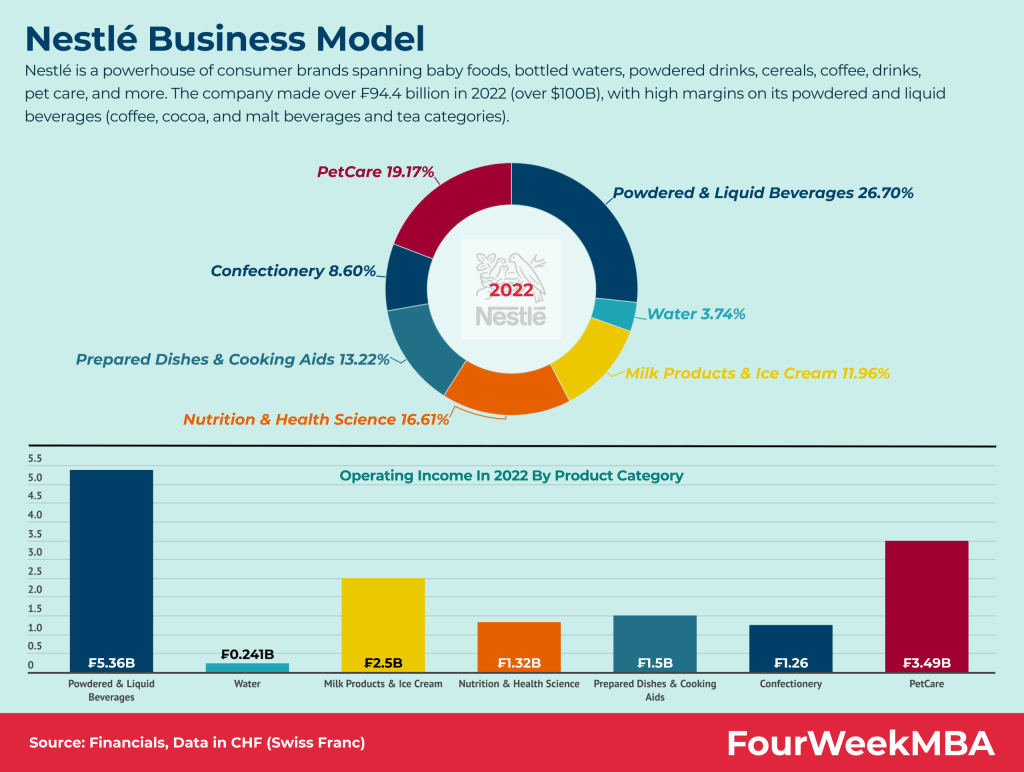
(Source: fourweekmba.com)
| Category | Revenue | Percentage |
|
Powdered & Liquid Beverages |
CHF 5.36 billion | 26.70% |
| Water | CHF 0.241 billion |
3.74% |
|
Milk Products& Ice cream |
CHF 2.5 billion | 11.96% |
| Nutrition & Health Science | CHF 1.32 billion |
16.61% |
|
Prepared Dishes & Cooking Ads |
CHF 1.5 billion | 13.22% |
| Confectionery | CHF 1.26 billion |
8.60% |
|
Petcare |
CHF 3.49 billion |
19.17% |
- Despite past controversies, including criticisms of its advertising and accusations of child labor in cocoa supply chains, Nestlé has implemented initiatives like the Cocoa Plan to address these issues.
- As per Nestlé statistics, this includes a Child Labor Monitoring and Remediation System, with 85.5% of its cocoa now responsibly sourced.
- To this end, it is increasing the use of renewable energy in manufacturing. In 2023, over 91% of its production electricity will come from renewable sources.
- As of 2023, more than 91% of its electricity used in production comes from renewable sources.
- Additionally, Nestlé promotes diversity. With 46.4% of women in middle and senior management roles, Nestlé meets consumer expectations for sustainability and social responsibility.
- Nestlé was formed in 1866 by combining Farine Lactée Henri Nestlé and the Anglo-Swiss Condensed Milk Company. Initially, it focused on baby foods, with the Anglo-Swiss Condensed Milk Company introducing Henri Nestlé’s Infant Cereal in 1867.
- Today, Nestlé sells a wide range of products, including baby food and snacks, but its highest sales come from powdered and liquid beverages, followed by milk products and ice creams.
- As per Nestlé statistics, Nestlé is a major shareholder in L’Oréal, the world’s largest cosmetics company.
- Nescafé, a well-known Nestlé coffee brand, became popular during World War II as a favorite among US military personnel.
- Nestlé operates in 197 countries, with 442 factories worldwide, and the United States hosts the most factories (163).
- Nestlé spends around USD 1.5 billion each year on research and development.
- The company produces over 10,000 different products and sells more than one billion every day, showing its wide reach and variety.
- Nestlé stays a top brand in the FMCG industry by making smart business moves, supporting sustainability, and working to solve social issues.
You May Also Like To Read
- Anker Statistics
- Sennheiser Statistics
- Seagate Statistics
- Razer Statistics
- Motorola Statistics
- Samsung Statistics
- Garmin Statistics
- Panasonic Statistics
- LG Statistics
- Huawei Statistics
- Oppo Statistics
- iPhone Statistics
Nestle Revenue and Sales Statistics
- Total Sales: 91.4 billion CHF in 2024, a 1.8% decrease from the previous year.
- Organic Sales Growth: 2.2% in 2024, the lowest in over 25 years.
- UTOP Margin: 17.2% in 2024.
- 2025 Outlook: Nestlé expects organic sales growth to improve compared to 2024 and aims for a UTOP margin of at least 16.0%.
- Advertising and Marketing Investment: To support growth, the company plans to increase spending to 9% of sales by the end of 2025.
- Innovation Focus: Six ‘big bets’ for 2025 are set for accelerated global rollout plans.
- In 2023, Nestlé Group achieved sales of approximately 93 billion CHF globally. Nestlé, headquartered in Vevey, Switzerland, is the world’s largest consumer goods manufacturer.
- Operating in over 86 countries, Nestlé sells products in more than 196 countries and employs around 291,000 people worldwide.
- Today, Nestlé offers a diverse portfolio of over 2,000 global and local brands, including beverages like coffee and water, infant and toddler foods, and confectionery and ice cream.
- According to Nestlé statistics, iconic brands such as Nescafé, KitKat, and Maggi are synonymous with Nestlé’s market presence.
- Nestlé aims to excel in ‘Nutrition, Health, and Wellness,’ focusing on consumer health.
- The largest share of Nestlé’s sales comes from North and South America, as highlighted in its latest annual report. Key global competitors include Unilever, PepsiCo, Mars Incorporated, and Mondelez.
(Reference: statista.com)
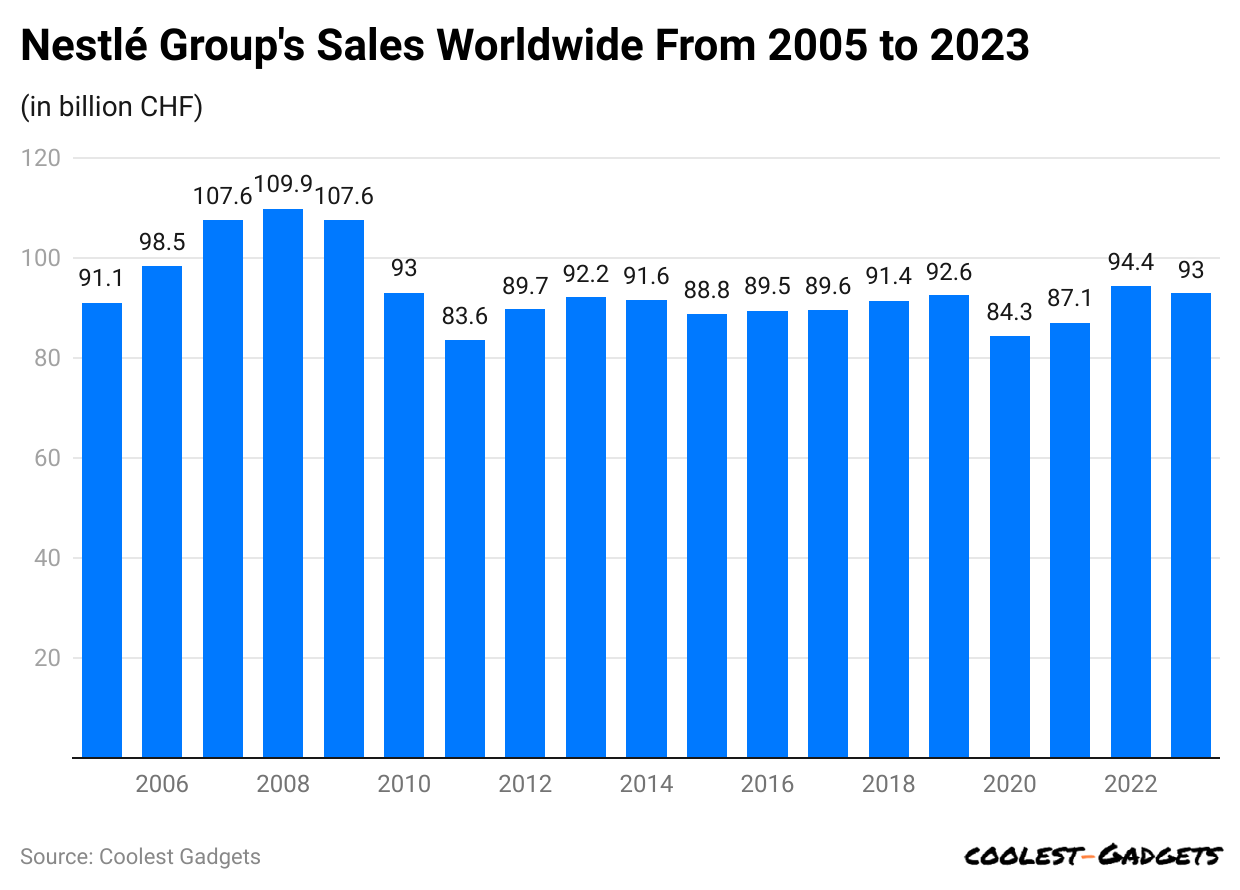
- The above chart shows the Nestle Group’s global sales in billions of CHF between 2005 and 2023.
| Year | Sales (in billion CHF) |
|
2005 |
91.1 |
| 2006 |
98.5 |
|
2007 |
107.6 |
| 2008 |
109.9 |
|
2009 |
107.6 |
| 2010 |
93.02 |
|
2011 |
83.64 |
| 2012 |
89.72 |
|
2013 |
92.16 |
| 2014 |
91.61 |
|
2015 |
88.79 |
| 2016 |
89.47 |
|
2017 |
89.59 |
| 2018 |
91.44 |
|
2019 |
92.57 |
| 2020 |
84.34 |
|
2021 |
87.09 |
| 2022 |
94.4 |
|
2023 |
93 |
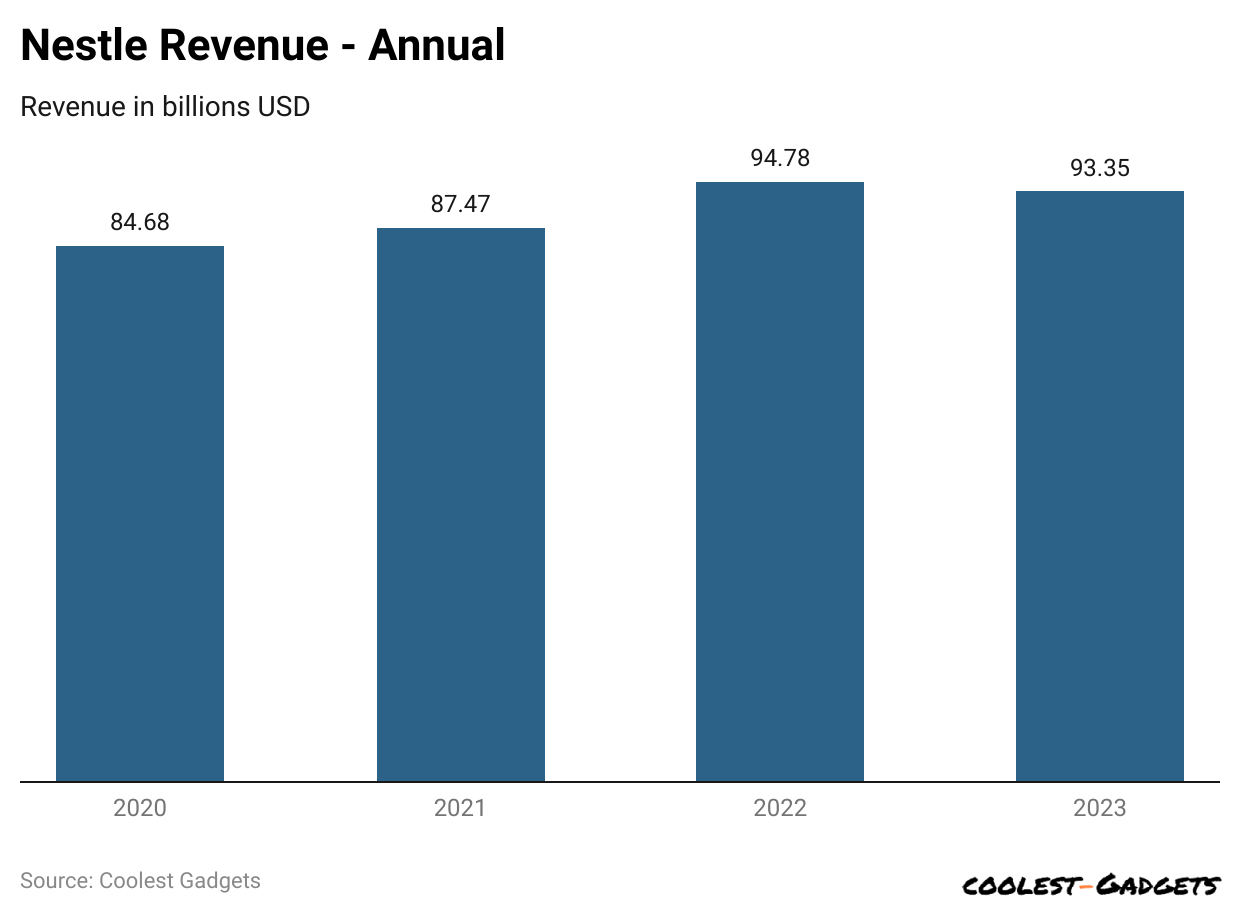
(Source: stockanalysis.com)
| Fiscal Year End | Revenue | Change | Growth |
|
Dec 31, 2020 |
84.68 billion | – | – |
| Dec 31, 2021 | 87.47 billion | 2.79B |
3.29% |
|
Dec 31, 2022 |
94.78 billion | 7.31B | 8.36% |
| Dec 31, 2023 | 93.35 billion | -1.43B |
-1.51% |
- During the reported period, Nestlé achieved an organic growth of 8.7%.
- A 9.5% increase in pricing fueled this growth, offset slightly by a -0.8% decrease in real internal growth (RIG).
- Nestle Statistics states that the growth was evenly spread across different regions and product categories.
- Total sales for the period rose by 1.6% to CHF 46.3 billion, up from CHF 45.6 billion in the first half of 2022.
- Sales were impacted negatively by 6.7% due to foreign exchange fluctuations and by 0.4% from net acquisitions.
- Nestlé’s underlying trading operating profit (UTOP) margin grew to 17.1%, up by 0.2% on a reported basis and 0.3% in constant currency.
- The trading operating profit (TOP) margin also increased to 15.9%, rising by 1.2%, mainly due to one-off items in the prior year.
- Underlying earnings per share grew by 11.1% in constant currency and by 4.1% on a reported basis, reaching CHF 2.43. Reported earnings per share increased by 10.6% to CHF 2.13.
- Free cash flow increased substantially to CHF 3.4 billion, up by CHF 1.9 billion, primarily due to reduced inventory levels, as per Nestle Statistics.
Nestle Patents Statistics
- Nestlé owns 51,608 patents globally, 25,172 of which have already been granted. Over 40% of these patents are currently active.
- The United States has the most patents filed by Nestlé, followed by Europe and China.
- Europe is a central hub for Nestlé’s research and development efforts, while Switzerland is the company’s home country and place of origin.
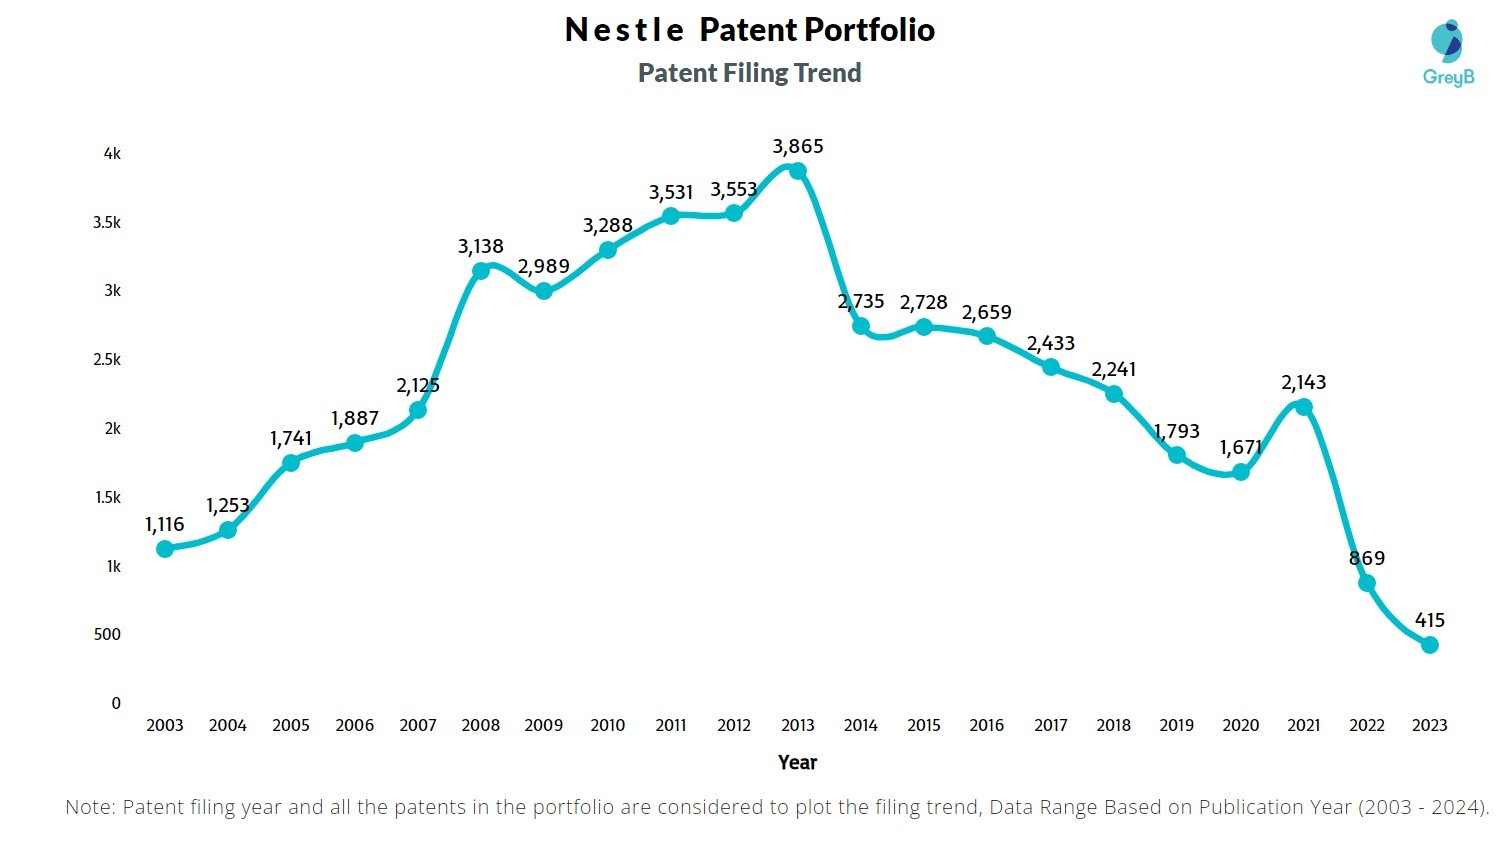
(Source: greyb.com)
| Years of Patents Filing or Granted | Nestle Patents Granted | Nestle Applications Filed |
|
2013 |
1782 | 3865 |
| 2014 | 1892 |
2735 |
|
2015 |
1839 | 2728 |
| 2016 | 1877 |
2659 |
|
2017 |
1362 | 2433 |
| 2018 | 1540 |
2241 |
|
2019 |
1332 | 1793 |
| 2020 | 1367 |
1671 |
|
2021 |
1177 | 2143 |
| 2022 | 1000 |
869 |
|
2023 |
1098 | 415 |
| 2024 | 11 |
– |
- Following are the different countries in which Nestle filed patents :
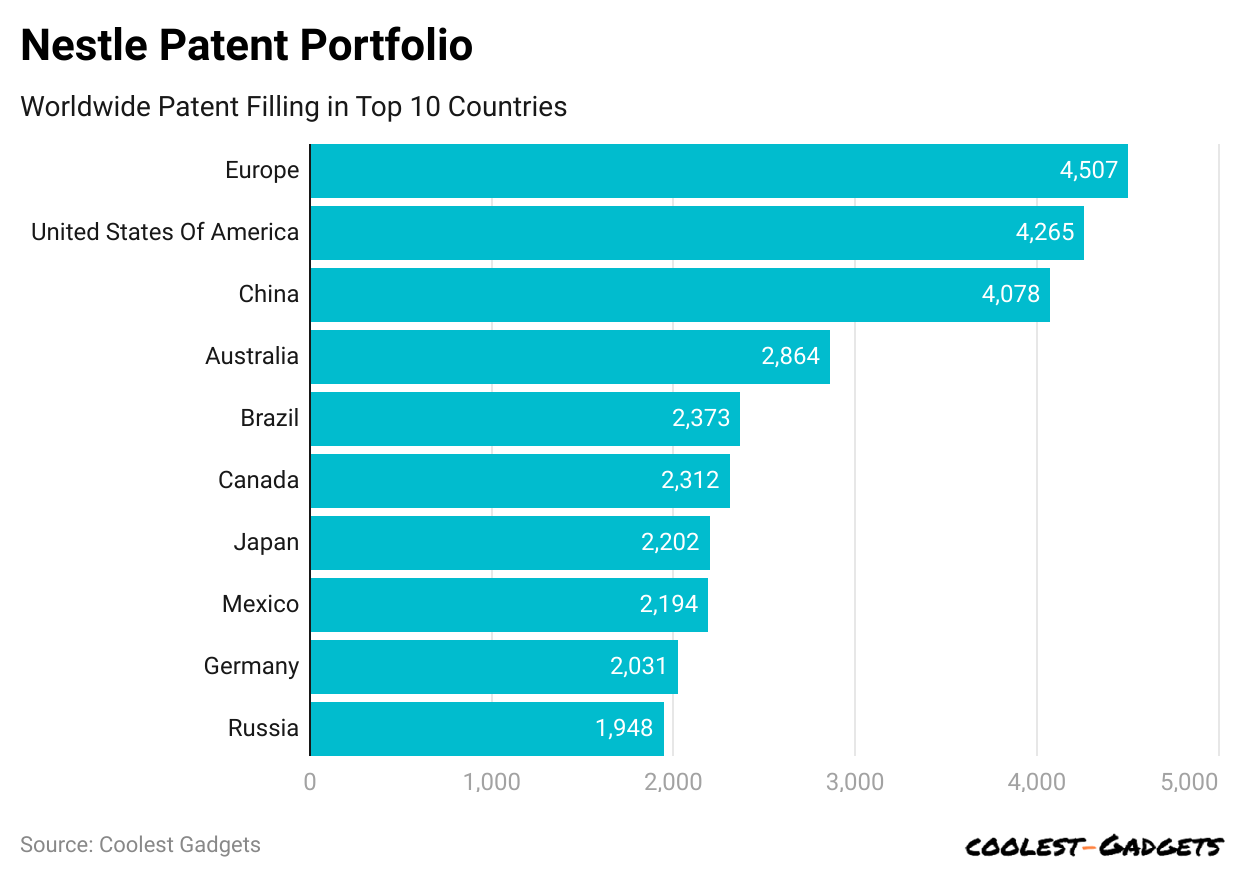
(Reference: greyb.com)
| Country | Patents |
|
Belarus |
1 |
| Cambodia |
1 |
|
Latvia |
1 |
| Gulf Cooperation Council |
1 |
|
Honduras |
1 |
| Kenya |
1 |
|
San Marino |
1 |
| Netherlands |
1 |
|
Uzbekistan |
1 |
| Sweden |
1 |
|
Yugoslavia/Serbia and Montenegro |
2 |
| Thailand |
2 |
|
Georgia |
2 |
| Guatemala |
2 |
|
Dominican Republic |
4 |
| Republic of Moldova |
4 |
|
Iceland |
4 |
| Bosnia and Herzegovina |
5 |
|
Lithuania |
5 |
| Romania |
7 |
|
Panama |
8 |
| Serbia |
9 |
|
Bulgaria |
9 |
| Finland |
13 |
|
Egypt |
13 |
| Uruguay |
15 |
|
Costa Rica |
17 |
| Tunisia |
18 |
|
Cyprus |
19 |
| Eurasia |
19 |
|
Morocco |
22 |
| Montenegro |
26 |
|
Ecuador |
33 |
|
Estonia |
38 |
| Czech Republic |
39 |
|
Africa |
40 |
| France |
46 |
|
Slovenia |
56 |
| Saudi Arabia |
57 |
|
Peru |
58 |
| Croatia |
61 |
|
Turkey |
75 |
| Slovakia |
104 |
|
United Arab Emirates |
108 |
| Viet Nam |
110 |
|
Colombia |
125 |
| Hungary |
131 |
|
Ukraine |
192 |
| Switzerland |
231 |
|
Italy |
250 |
| New Zealand |
269 |
|
United Kingdom |
362 |
| Denmark |
370 |
|
Norway |
420 |
| Taiwan |
442 |
|
Korea (South) |
524 |
| Argentina |
600 |
|
Poland |
617 |
| Israel |
701 |
|
Portugal |
704 |
| Singapore |
798 |
|
Hong Kong (SAR.) |
871 |
| Indonesia |
976 |
|
Chile |
1042 |
| Philippines |
1050 |
|
South Africa |
1117 |
| Malaysia |
1202 |
|
India |
1525 |
| Spain |
1592 |
|
Austria |
1823 |
| Russia |
1948 |
|
Germany |
2031 |
| Mexico |
2194 |
|
Japan |
2202 |
| Canada |
2312 |
|
Brazil |
2373 |
| Australia |
2864 |
|
China |
4078 |
| United States of America |
4265 |
|
Europe |
4507 |
Nestle Demographics Statistics
- As of 2024, Nestlé employs approximately 277,000 people worldwide.
- Meanwhile, women hold 47.4% of managerial positions globally.
- Around 85.7% of management committee roles are filled by local employees.
- Nestlé India Limited has 8,912 employees in
- Nestlé operates in 188 countries, reflecting its extensive global reach.
- Nestlé invests approximately USD 1.7 billion annually in research and development and employs over 4,100 R&D staff across 23 sites worldwide.
- The largest ethnic group at Nestlé is White, comprising 61% of the workforce. Hispanic or Latino employees make up 15% of the workforce, and Black or African American employees account for 10%.
- As per Nestlé statistics, the average annual salary for Nestlé employees is USD 45,338.
- Most Nestlé employees identify as Democrats. On average, employees stay with Nestlé for 4.8 years.
(Reference: statista.com)
- In 2023, Nestlé employed approximately 270,000 people globally. Nestlé, headquartered in Vevey, Switzerland, is the world’s largest consumer goods manufacturer.
- Nestle Statistics states that Nestlé operates in 187 countries and employs around 308,000 people worldwide.
- Its diverse product lineup includes beverages such as coffee and water, infant and toddler foods, and confectionery and ice cream products.
- Nestlé is renowned for its billion-dollar brands like Nescafé, KitKat, and Purina pet food.
- Nestlé aims to excel as the premier “Nutrition, Health, and Wellness Company” shortly. In 2023, its largest sales share came from North and South America.
- Major global competitors include Unilever, PepsiCo, Mars Incorporated, and Mondelez, as reported in Nestlé’s latest annual financial disclosures.
- As per Nestle Statistics, 36% of Nestle’s workers are females, whereas 61% are males.
- The majority of Nestlé employees hold at least a bachelor’s degree, accounting for 53% of the workforce.
- Among Nestlé employees, the most common major is business, with 31% of employees having studied in this field.
- Nestlé’s workforce is predominantly male, with 64% of employees being men and 36% being women.
- The most common racial or ethnic group at Nestlé is White, making up 61% of the company’s employees as per Nestlé statistics.
| Gender | Percentage |
|
Female |
25.6% |
| Male |
74.4% |
- Racial Distributions of Employees in Nestlé:
| Race | Percentage |
|
Asian |
6.3% |
| Black and African Americans |
11.7% |
|
Hispanic or Latino |
15.2% |
| White |
63.8% |
|
Unknown |
3.0% |
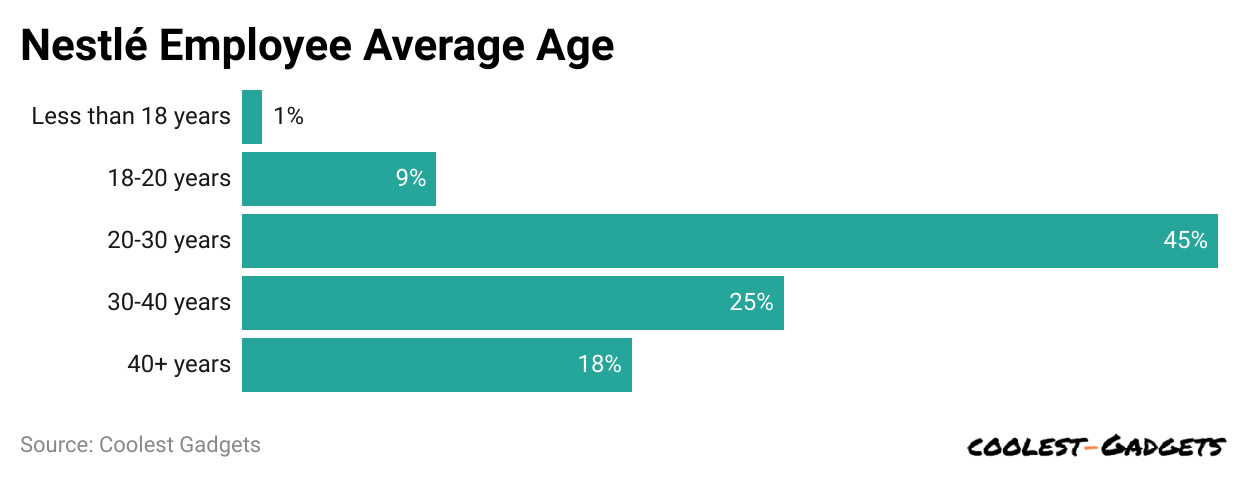
- The most common age range among Nestlé employees is 20-30 years old, comprising 46% of the workforce.
- In contrast, the least common age range is under 18 years old, with only 2% of Nestlé employees falling into this category.
(Reference: zippia.com)
- The most common duration of employment at Nestlé is 1-2 years, with 30% of employees staying in this range.
- Conversely, staying with Nestlé for 8-10 years is less common, with only 7% of employees remaining for this duration.
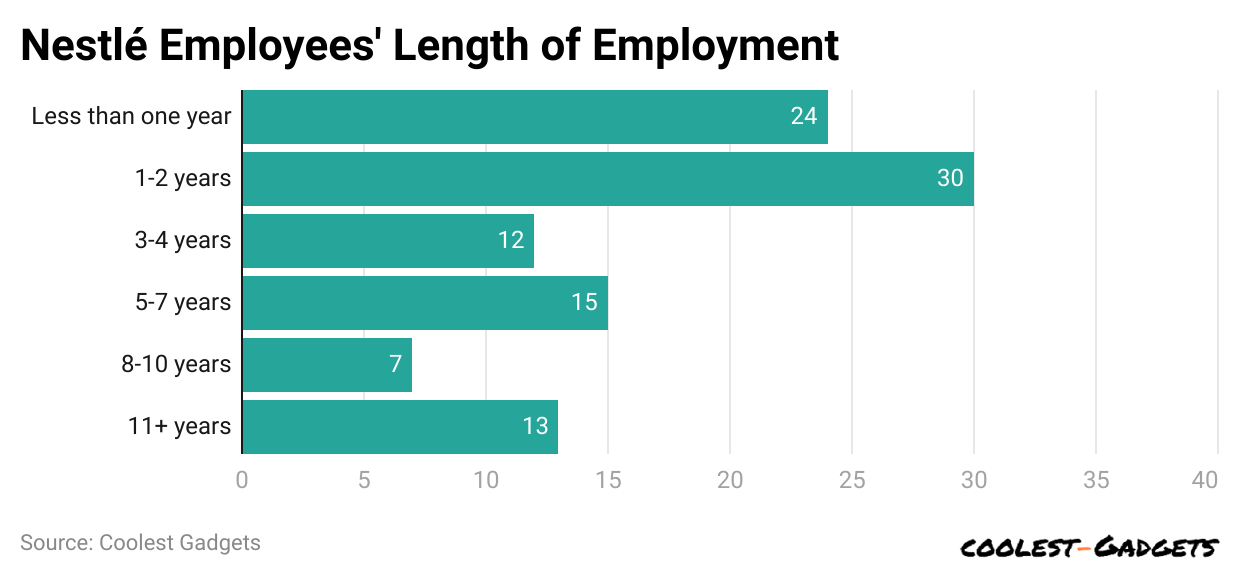
(Reference: zippia.com)
|
Number of years |
Percentage |
|
11 years and more |
13% |
| 8-10 years |
7% |
|
5-7 years |
15% |
| 3-4 years |
12% |
|
1-2 years |
30% |
| Less than one year |
24% |
- A significant portion of Nestlé employees earn between USD 40,000 and USD 60,000 annually, accounting for 44% of the workforce, as per Nestlé statistics.
- On the other hand, only 3% of Nestlé employees earn between USD 100,000 and USD 200,000 per year, making it the least common salary range at the company.
Nestle Job listing by salary range:
| Salary Range | Nestle |
|
>USD 200k |
Five jobs |
| USD 100k-200k |
3,151 jobs |
|
USD 60k-100k |
15,535 jobs |
| USD 40k-60k |
51,279 jobs |
|
USD 25k-40k |
44,005 jobs |
| <USD 25k |
3,437 jobs |
- The most frequently held certification among Nestlé employees is a leadership certificate, which 14% of employees have obtained.
- Most Nestlé employees are affiliated with the Democratic Party.
- The largest political contribution made by a Nestlé employee was $7,750, donated by Louise Hilsen to the Democratic Party.
You May Also Like To Read
- Xiaomi Statistics
- Lenovo Statistics
- Asus Statistics
- Toshiba Statistics
- Intel Statistics
- Dell Statistics
- HP (Hewlett-Packard) Statistics
- Philips Statistics
- Apple Statistics
- Google Statistics
- Sony Statistics
- Microsoft Statistics
- Airbnb Statistics
- Google Revenue Statistics
- Amazon Statistics
- Tencent Statistics
Nestlé Waste Management And Carbon Emission Statistics
- Nestle Statistics further detailed that Nestlé aims to cut its greenhouse gas (GHG) emissions by 20% by 2025, compared to 2018 levels.
- The company plans to halve its GHG emissions by 2030, aligning with global climate objectives.
- Nestlé is committed to achieving net-zero emissions by 2050, addressing all scopes of emissions across its value chain.
- The company aims to design over 95% of its plastic packaging for recycling by 2025, moving towards 100% recyclable or reusable packaging.
- Nestlé plans to reduce its use of virgin plastic by one-third by 2025, promoting sustainability in packaging.
- The company targets 50% recycled content in its water bottles by 2025, enhancing circular economy practices.
- In 2023, Nestlé sourced 15.2% of its raw materials from farmers practicing regenerative agriculture, and it aims to reach 20% by 2025.
- Additionally, 91.9% of the electricity used at Nestlé’s global manufacturing sites came from renewable sources, helping reduce emissions.
Nestle India Statistics
(Reference: statista.com)
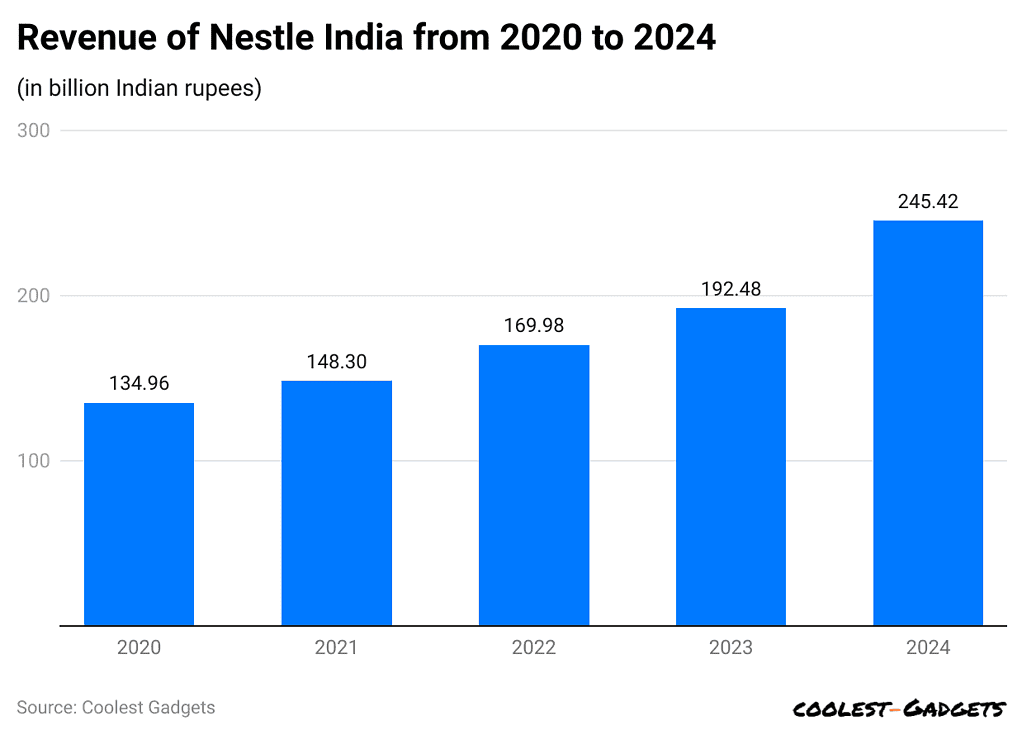
- Nestlé India’s revenue reached approximately 245 billion Indian rupees in 2024, an increase from about 192 billion rupees in 2023.
- In the third quarter ending December 31, 2024, the company reported revenue from operations of 47.8 billion rupees, a 3.9% increase over the same period last year.
- The net profit for the third quarter of 2024 was 6.96 billion rupees, a 6.2% increase over the previous year.
- Domestic sales grew by 3.26% in the third quarter of 2024, totaling 45.66 billion rupees, up from 44.22 billion rupees in the same quarter of the previous year.
- Export sales significantly increased by 21.12% in the third quarter of 2024, reaching 1.96 billion rupees, up from 1.62 billion rupees in the corresponding quarter of the previous year.
- Nestlé India declared a dividend of 14.25 rupees per share following its third-quarter results in 2024.
- Nestle India operates as a subsidiary of Nestle S.A., headquartered in Gurgaon, Haryana.
- The company focuses on manufacturing chocolates, food items, beverages, and confectioneries.
- Nestlé India, a subsidiary of the Swiss multinational Nestlé S.A., was founded in 1912.
- It is a leading player in India’s FMCG market, with revenues exceeding USD 4.6 billion in FY23.
- By the end of 2025, the company will reach domestic sales of Rs. 1 lakh crore (around USD 13.4 billion), targeting a growth rate of 16 to 18%.
- This growth will be driven by expanding product offerings, enhancing distribution, and adopting creative marketing strategies.
- The goal reflects Nestlé India’s efforts to stay aligned with market trends and ensure consistent growth.
Key Facts about Nestlé India
- One of the largest companies in the Indian Food & Beverage sector.
- Among the most trusted FMCG brands in India, boasting a heritage of over 100 years.
- Achieves one of the highest annual Return on Equity (ROE) margins in its global sector.
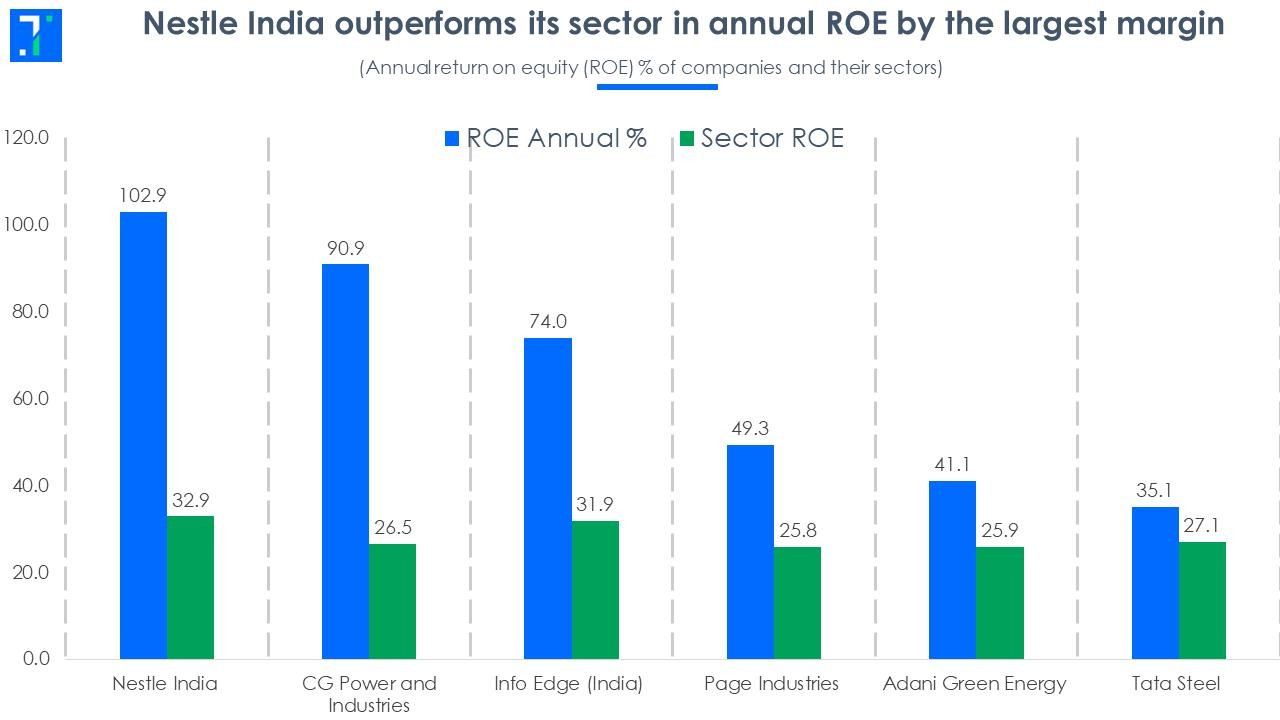
(Source: linkedin.com)
Conclusion
Nestlé’s impact as a global food and beverage giant is significant, marked by both innovation and controversy. The company has expanded its reach through diverse product offerings, strategic acquisitions, and sustainability initiatives. However, Nestlé has also faced criticism regarding environmental concerns, water privatisation, and ethical sourcing. While it continues to address these issues through corporate social responsibility efforts, consumer trust remains a challenge.
The company’s future success will depend on balancing profitability with ethical responsibility, ensuring sustainable practices, and maintaining transparency to meet evolving consumer expectations in an increasingly conscious market.
Sources
Saisuman is a talented content writer with a keen interest in mobile tech, new gadgets, law, and science. She writes articles for websites and newsletters, conducting thorough research for medical professionals. Fluent in five languages, her love for reading and languages led her to a writing career. With a Master’s in Business Administration focusing on Human Resources, Saisuman has worked in HR and with a French international company. In her free time, she enjoys traveling and singing classical songs. At Coolest Gadgets, Saisuman reviews gadgets and analyzes their statistics, making complex information easy for readers to understand.