Unilever Statistics By Sales Growth, Revenue, Product Segment, Demographic, Country And Trends

Updated · Mar 18, 2025


TABLE OF CONTENTS
- Introduction
- Editor’s Choice
- General Unilever Statistics
- Unilever Revenue Statstics
- Unilever Statistics By Sales Growth
- Unilever’s Regional Revenue Statistics
- Unilever Statistic By Product Segment Revenue
- Unilever’s Quarterly Sales Growth Statistics By Beauty And Wellbeing
- Unilever Demographic Statistics
- Unilever New Product Launches Statistics
- Unilever Website Traffic Statistics By Country
- The Top Player’s Statistics By the Beauty Industry
- Unilever Shipments Statistics By Trends
- Unilever Patent Statistics
- Unilever’s PLC Shareholder Statistics
- Sustainable Initiatives of Unilever
- Conclusion
Introduction
Unilever Statistics: Unilever is a leading global consumer goods company with a diverse product portfolio encompassing home care, beauty and personal care, and foods and refreshments. The company is committed to sustainability and innovation, investing heavily in research and development to create high-quality, environmentally friendly products. Unilever’s renowned brands include Dove, Hellmann’s, and Domestos, and its extensive operations include over 280 factories worldwide.
This article includes different current trends and analyses of the global Unilever market from several insights. But how big is it? Let’s dive into some interesting statistics that showcase Unilever’s reach, products, and impact.
Editor’s Choice
- Unilever Statistics reports that the global revenue for Q1 2024 was USD 15.0 billion, a 1.4% increase compared to the previous year.
- During the same period, underlying sales growth resulted in 4.4%, with a 2.2% increase in volume.
- The power brands accounted for 75% of total turnover, with a 6.1% sales growth driven by a 3.8% volume increase.
- In 2023, Unilever Group’s global revenue was roughly 60 billion euros (USD 64.60 billion), showing a slight decline from the previous year.
- In 2023, Unilever Group reported a global operating profit of approximately €9.8 billion (USD 10.53 billion), which was a decrease from over €10 billion (USD 10.75 billion) in 2022.
- The company’s turnover increased by 1.4% to €15.0 billion (USD 16.12 billion), though this was partially offset by a -2.0% currency impact and -0.9% from net disposals.
- Besides, in Q1 of 2024, revenue in the North American region was around USD 3.45 billion.
- In the first quarter of 2024, Unilever’s Beauty and Wellbeing segment’s total revenue turnover was around USD 3.75 billion, representing 25% of total sales.
- However, the Asia Pacific African region generated the highest share, 48%, in the beauty and wellbeing segment.
- Unilever products are sold in over 190 countries, making it one of the most globally widespread consumer goods companies.
- Unilever Statistics further states that Unilever.com’s total website visits in May 2024 were 1.6 million, down 2.78% from last month’s, and it secured a 39.53% bounce rate.
- Based on devices, desktop (53.95%) and mobile (46.05%) capture the majority of traffic on Unilever’s website.
You May Also Like To Read
General Unilever Statistics
- In contrast, Unilever’s distribution network serves approximately 4.4 million retail stores in the top 10 emerging markets.
- Recently, the products of the company have been used by approximately 3.4 billion people every day.
- Based on Unilever Statistics, approximately 75% of Unilever’s turnover comes from its 30 Power Brands.
- Moreover, Unilever has invested approximately €8.6 billion (USD 9.24 billion) in Brand and Marketing Investment.
(Source: unilever.com)
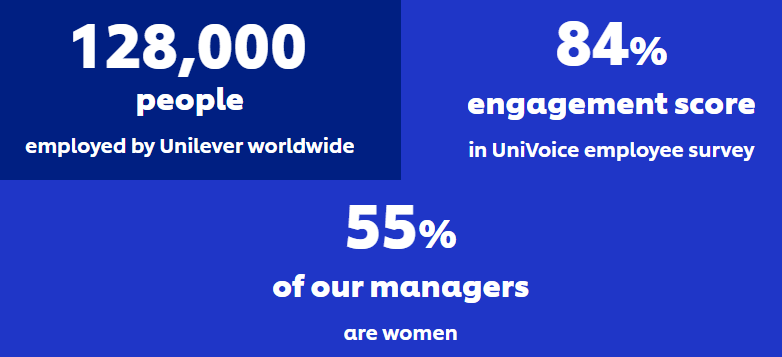
- To date, Unilever’s global workforce has been around 127,000 employees, a slight decline from the approximately 128,000 employees at the end of 2023.
- Unilever’s UniVoice employee survey reported an 84% engagement score.
- Unilever Statistics also states that it achieved a significant milestone in gender diversity, with 55% of its managers being women.
- Meanwhile, the company works with around 57,000 suppliers located in around 150 countries and operates across 280 factories globally.
- Unilever services nearly 23 million customer orders annually.
- Additionally, the company invests significantly in research and development, spending €949 million (USD 1,019.80 million) in 2023 alone, and employs a global team of 5,000 experts who contribute to its extensive patent portfolio (Unilever).
- Unilever’s innovations have generated an incremental turnover of approximately €1.8 billion (USD 1.93 billion).
Unilever Revenue Statstics
(Reference: statista.com)
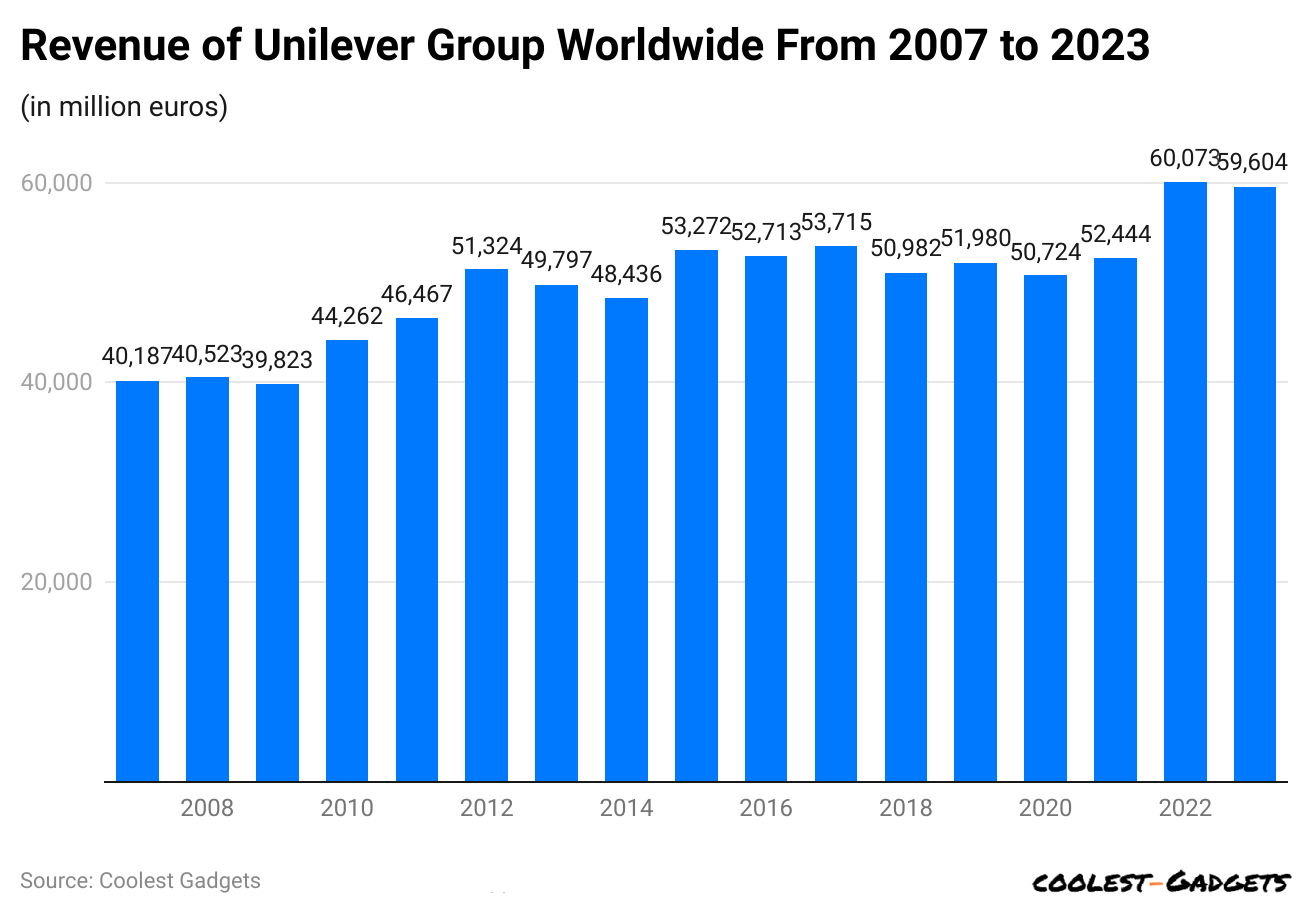
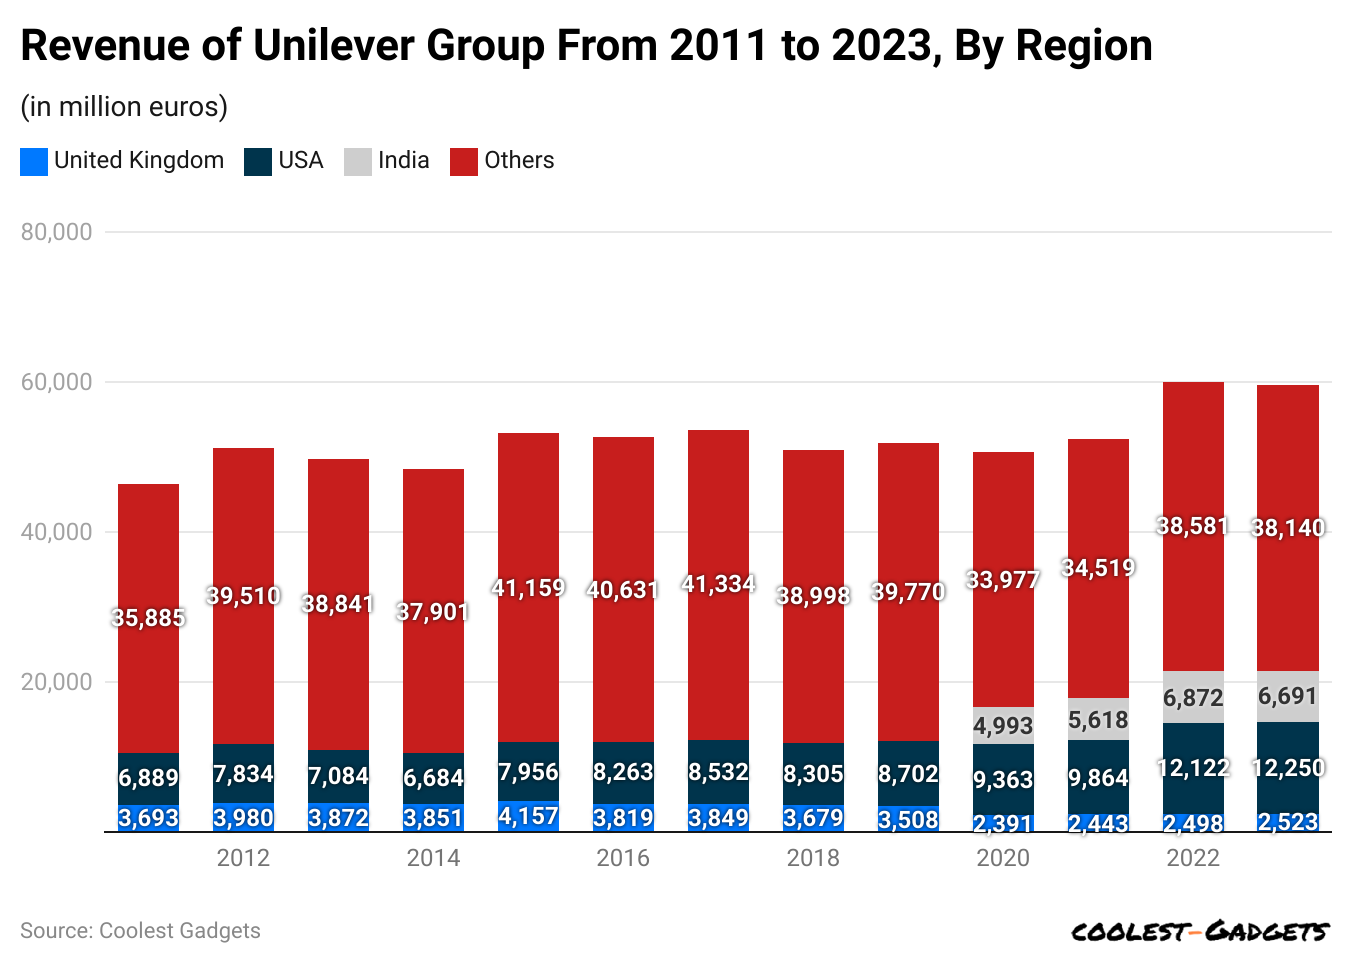
- A report published by Statista stated that the Unilever Group’s global revenue was roughly 59,604 million euros (USD 64,178.61 million) in 2023, showing a slight decline from the previous year.
On the other hand, the total revenue (in USD million) earned between 2022 and 2007 is mentioned in the table below:
|
2022 |
64,683.60 |
| 2021 |
56,469.08 |
|
2020 |
54,617.07 |
| 2019 |
55,969.47 |
|
2018 |
54,894.87 |
| 2017 |
57,837.63 |
|
2016 |
56,758.72 |
| 2015 |
57,360.63 |
|
2014 |
52,153.46 |
| 2013 |
53,618.92 |
|
2012 |
55,263.12 |
| 2011 |
50,033.34 |
|
2010 |
47,659.11 |
| 2009 |
42,879.42 |
|
2008 |
43,633.14 |
| 2007 |
43,271.35 |
By Quarterly Net Sales
(Reference: statista.com)
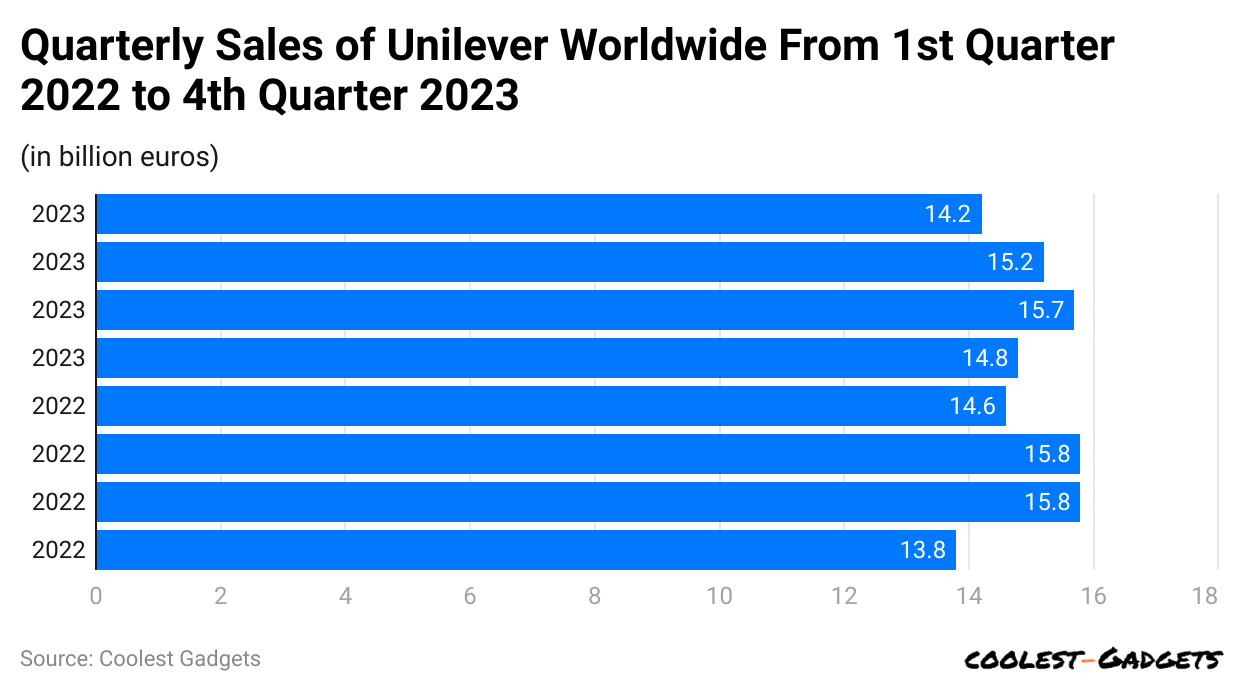
- Unilever Statistics show that the company’s quarterly net sales in 2023 were 14.8 billion euros (USD 15.94 billion), 15.7 billion euros (USD 16.90 billion), 15.2 billion euros (USD 16.37 billion), and 14.2 billion euros (USD 15.29 billion).
- Whereas Q1 follows quarterly revenue analyses in 2022: 13.8 billion euros (USD 14.86 billion), Q2: 15.8 billion euros (USD 17.01 billion), Q3: 15.8 billion euros (USD 17.01 billion), and Q4: 14.6 billion euros (USD 15.72 billion).
You May Also Like To Read
- Xiaomi Statistics
- Lenovo Statistics
- Asus Statistics
- Toshiba Statistics
- Intel Statistics
- Dell Statistics
- HP (Hewlett-Packard) Statistics
- Philips Statistics
- Apple Statistics
- Google Statistics
- Sony Statistics
- Microsoft Statistics
- Airbnb Statistics
- Google Revenue Statistics
- Amazon Statistics
- Tencent Statistics
Unilever Statistics By Sales Growth
 (Reference: unilever.com)
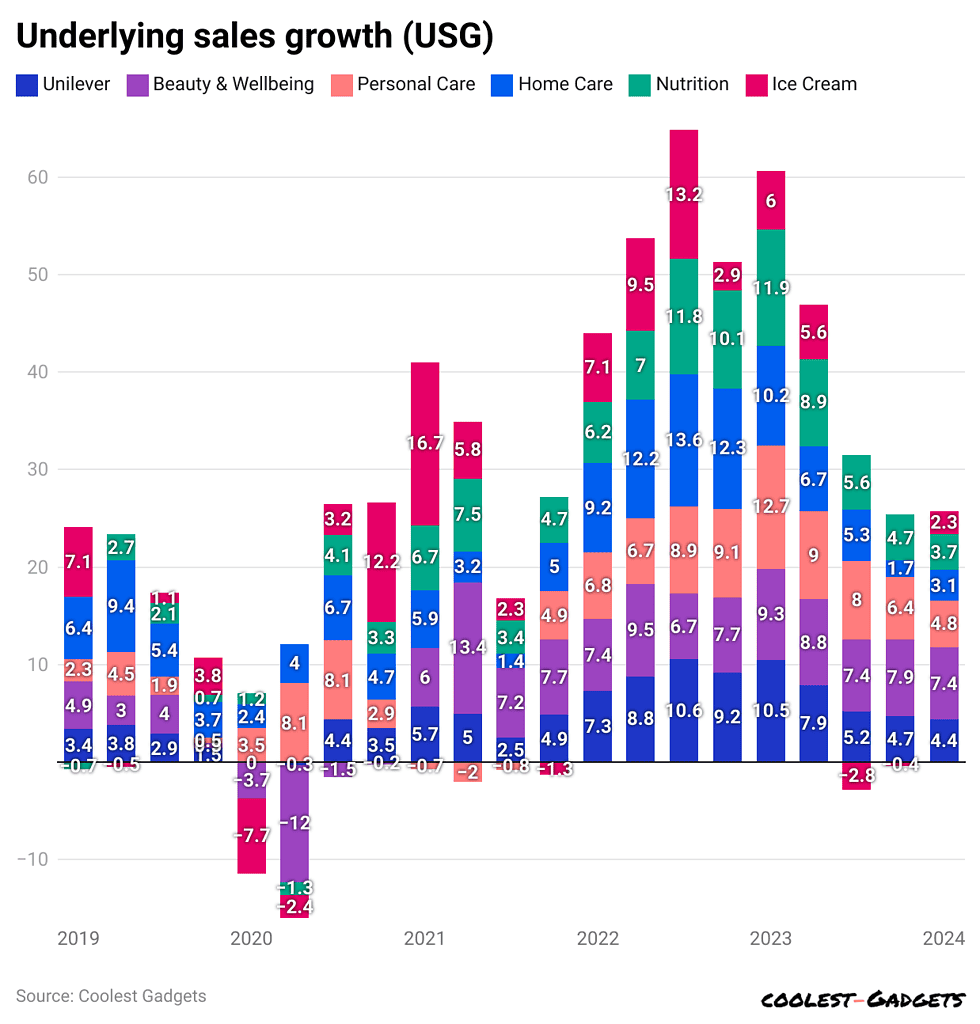
- Unilever Statistics further elaborated that in the first quarter of 2024, the underlying sales growth resulted in 4.4%, with a 2.2% increase in volume.
- In 2023, the global market’s quarterly sales growth was Q1 (10.5%), Q2 (7.9%), Q3 (5.2%), and Q4 (4.7%).
Underlying sales growth in previous years
| Year | Q1 | Q2 | Q3 | Q4 |
|
2019 |
3.4% | 3.8% | 2.9% | 1.5% |
| 2020 | 0% | -0.3% | 4.4% |
3.5% |
|
2021 |
5.7% | 5% | 2.5% | 4.9% |
| 2022 | 7.3% | 8.8% | 10.6% |
9.2% |
- In Q1 2024, the Beauty and Wellbeing segment generated the highest sales growth, resulting in 7.4%, followed by Personal Care (4.8%), Nutrition (3.7%), Home Care (3.1%), and Ice Cream (2.3%).
The quarterly segmental sales growth of the Unilever Group is analyzed below from 2019 to 2023
| Beauty & Wellbeing | Personal Care | Home Care | Nutrition | Ice Cream | |
| 2019 | |||||
|
Q1 |
4.9% | 2.35 | 6.4% | -0.7% | 7.1% |
| Q2 | 3% | 4.5% | 9.4% | 2.7% |
-0.5% |
|
Q3 |
4% | 1.9% | 5.4% | 2.1% | 1.1% |
| Q4 | 0.5% | 0.5% | 3.7% | 0.7% |
3.8% |
| 2020 | |||||
|
Q1 |
-3.7% | 3.5% | 2.4% | 1.2% | -7.7% |
| Q2 | -12% | 8.1% | 4% | -1.3% |
-2.4% |
|
Q3 |
-1.5% | 8.1% | 6.7% | 4.1% | 3.2% |
| Q4 | -0.2% | 2.9% | 4.7% | 3.3% |
12.2% |
| 2021 | |||||
|
Q1 |
6% | -0.7% | 5.9% | 6.7% | 16.7% |
| Q2 | 13.4% | -2% | 3.2% | 7.5% |
5.8% |
|
Q3 |
7.2% | -0.8% | 1.4% | 3.4% | 2.3% |
| Q4 | 7.7% | 4.9% | 5% | 4.7% |
-1.3% |
| 2022 | |||||
|
Q1 |
7.4% | 6.8% | 9.2% | 6.2% | 7.1% |
| Q2 | 9.5% | 6.7% | 12.2% | 7% |
9.5% |
|
Q3 |
6.7% | 8.9% | 13.6% | 11.8% | 13.2% |
| Q4 | 7.7% | 9.1% | 12.3% | 10.1% |
2.9% |
| 2023 | |||||
|
Q1 |
9.3% | 12.7% | 10.2% | 11.9% |
6% |
|
Q2 |
8.8% | 9% | 6.7% | 8.9% | 5.6% |
| Q3 | 7.4% | 8% | 5.3% | 5.6% |
-2.8% |
|
Q4 |
7.9% | 6.4% | 1.7% | 4.75 |
-0.4% |
By Volume Growth
 (Reference: unilever.com)
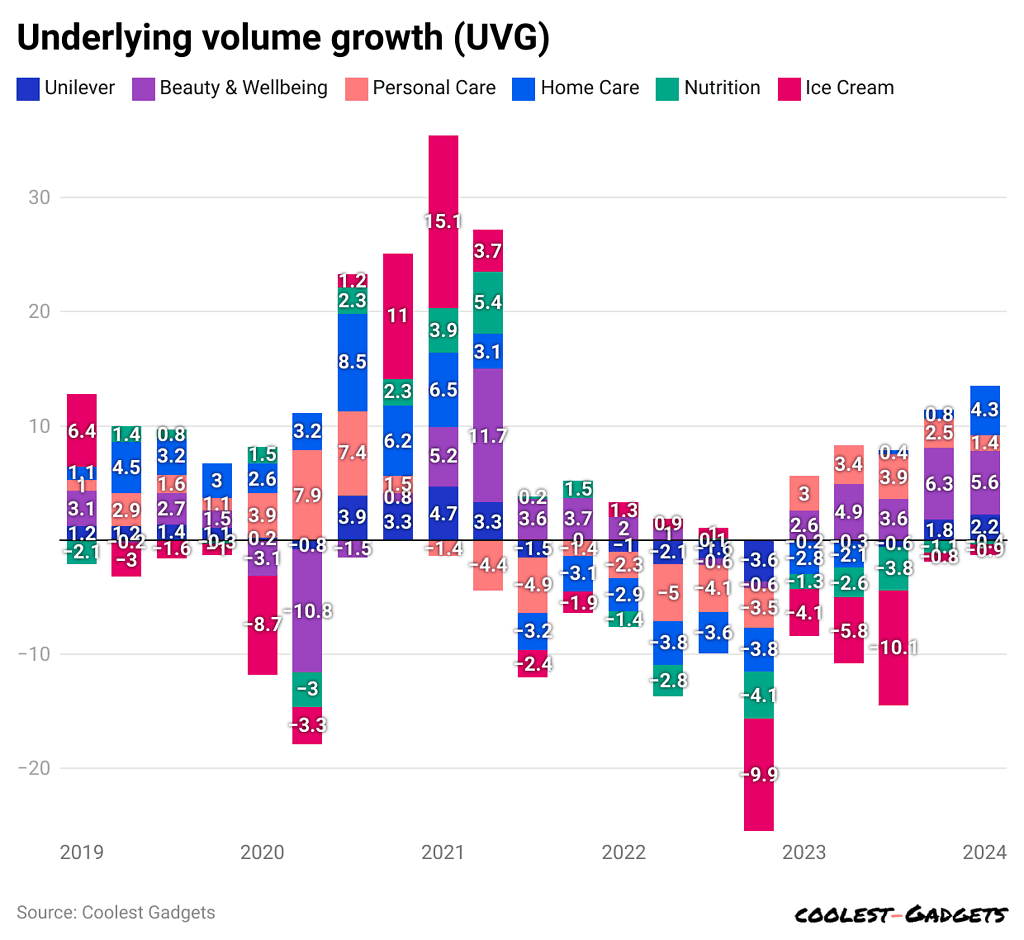
- Unilever Statistics show that in Q1 of 2024, the volume growth of the company has increased by 2.2%.
- In the same period, the segmental volume growth of the Unilever Group is followed by Beauty & Wellbeing (5.6%), Personal Care (1.4%), Home Care (4.3%), Nutrition (-0.4%), and Ice cream (0.9%).
Similarly, the quarterly segmental Volume growth of the Unilever Group is analyzed below from 2019 to 2023
| Overall Unilever | Beauty & Wellbeing | Personal Care | Home Care | Nutrition | Ice Cream | |
| 2019 | ||||||
| https://www.coolest-gadgets.com/wp-admin/admin.php?page=wpforms-overview
Q1 |
1.2% | 3.1% | 1% | 1.1% | -2.1% | 6.4% |
| Q2 | 1.2% | -0.2% | 2.9% | 4.5% | 1.4% |
-3% |
|
Q3 |
1.4% | 2.7% | 1.6% | 3.2% | 0.8% | -1.6% |
| Q4 | 1.1% | 1.5% | 1.1% | 3% | -0.3% |
-1% |
| 2020 | ||||||
|
Q1 |
0.2% | -3.1% | 3.9% | 2.6% | 1.5% | -8.7% |
| Q2 | -0.8% | -10.8% | 7.9% | 3.2% | -3% |
-3.3% |
|
Q3 |
3.9% | -1.5% | 7.4% | 8.5% | 2.3% | 1.2% |
| Q4 | 3.3% | 0.8% | 1.5% | 6.2% | 2.3% |
11% |
| 2021 | ||||||
|
Q1 |
4.7% | 5.2% | -1.4% | 6.5% | 3.9% | 15.1% |
| Q2 | 3.3% | 11.7% | -4.4% | 3.1% | 5.4% |
3.7% |
|
Q3 |
-1.5% | 3.6% | -4.9% | -3.2% | 0.2% | -2.4% |
| Q4 | 0% | 3.7% | -1.45 | -3.1% | 1.5% |
-1.9% |
| 2022 | ||||||
|
Q1 |
-1% | 2% | -2.3% | -2.9% | -1.4% | 1.3% |
| Q2 | -2.1% | 1% | -5% | -3.8% | -2.8% |
0.9% |
|
Q3 |
-1.6% | -0.6% | -4.1% | -3.6% | 0.1% | 1% |
| Q4 | -3.6% | -0.6% | -3.5% | -3.8% | -4.1% |
-9.9% |
| 2023 | ||||||
|
Q1 |
-0.2% | 2.6% | 3% | -2.8% | -1.3% | -4.1% |
| Q2 | -0.3% | 4.9% | 3.4% | -2.1% | -2.6% |
-5.8% |
|
Q3 |
-0.6% | 3.6% | 3.9% | 0.4% | -3.8% | -10.1% |
| Q4 | 1.8% | 6.3% | 2.5% | 0.8% | -1.1% | -0.8% |
Unilever’s Regional Revenue Statistics
(Reference: statista.com)
- In the United States of America, Unilever Group’s revenue reached about 12.25 billion euros (USD 13.19 billion) in 2023, an increase from the 9.86 billion euros (USD 10.60 billion) recorded two years prior.
- Meanwhile, other regional revenue analyses are followed by India: 6,691 million euros (USD 7,204.53 million), United Kingdom: 2,523 million euros (USD 2,716.64 million), and other regions: 38,140 million euros (USD 41,067.25 million).
- As mentioned in Unilever Statistics, in Q1 of 2024, the regional revenue breakdown is mentioned by North America (USD 3.45 billion), Europe (USD 4.50 billion), Asia (USD 4.20 billion), Latin America (USD 1.80 Billion), and other regions (USD 1.50 billion).
Unilever Statistic By Product Segment Revenue
- In the first quarter of 2024, Unilever’s Beauty and Wellbeing segment’s total revenue turnover was around USD 3.75 billion, representing 25% of total sales.
- Furthermore, other segmental revenues and total turnover in Q1 of 2024 are by Personal Care (USD 3.75 billion and 22%), Home Care (USD 3.15 billion and 21%), Nutrition (USD 3.45 billion and 23%), and Ice Cream (USD 1.80 billion and 12%).
(Reference: statista.com)
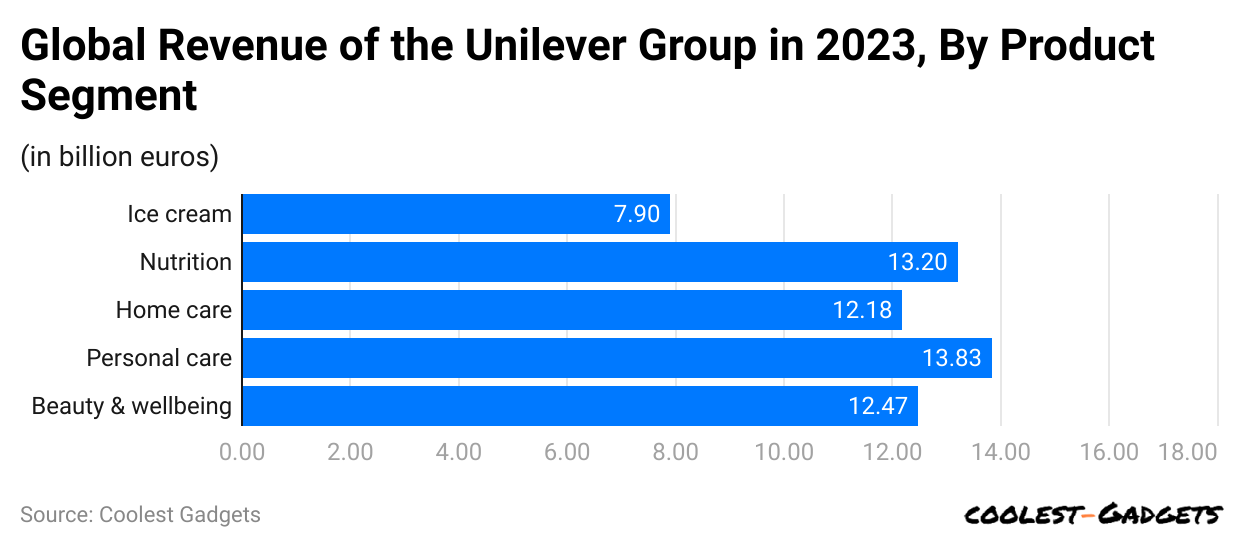
- A report generated by Statista reported that in 2023, Unilever’s personal care segment accounted for the highest revenue of 13.83 billion euros (USD 14.89 billion).
- The second and third-highest revenue earners by the global market were the beauty and wellbeing sector, which earned 12.47 billion euros (USD 13.43 billion), and the home care sector, which earned 12.18 billion euros (USD 13.11 billion).
- The nutrition and ice cream segments of Unilever Groups were 13.2 billion euros (USD 14.21 billion) and 7.9 billion euros (USD 8.51 billion), respectively.
Unilever’s Quarterly Sales Growth Statistics By Beauty And Wellbeing
(Source: unilever.com)
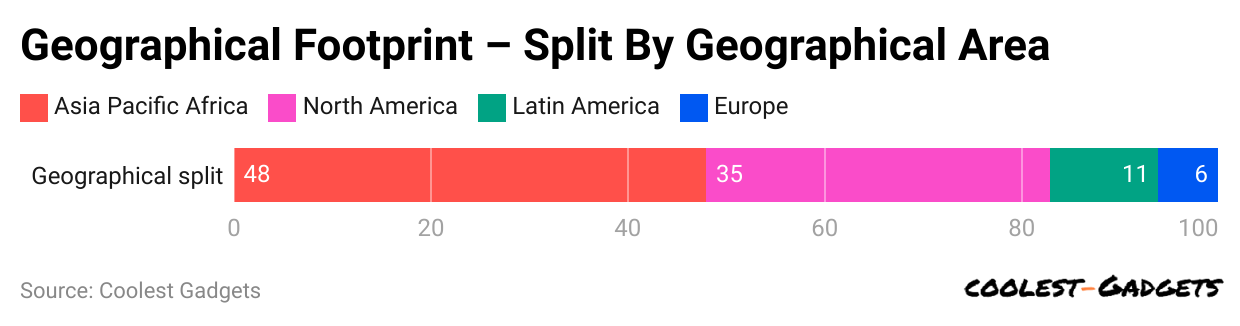
- As per Unilever Statistics, in Q1 of 2024, the Asia Pacific African region generated the highest share, 48%, in the beauty and wellbeing segment.
- Moreover, the Unilever Group’s other regional shares are in North America (35%), Latin America (11%), and Europe (6%).
(Reference: statista.com)
- The above graph is taken from a Statista insight: In 2023, quarterly sales growth in the same segment was Q1 (9.3%), Q2 (8.8%), Q3 (7.4%), and Q4 (7.9%).
- Similarly, the global turnover of the sector was around 12.5 billion euros, resulting in USD 13.46 billion.
By Personal Care Segment
(Source: unilever.com)
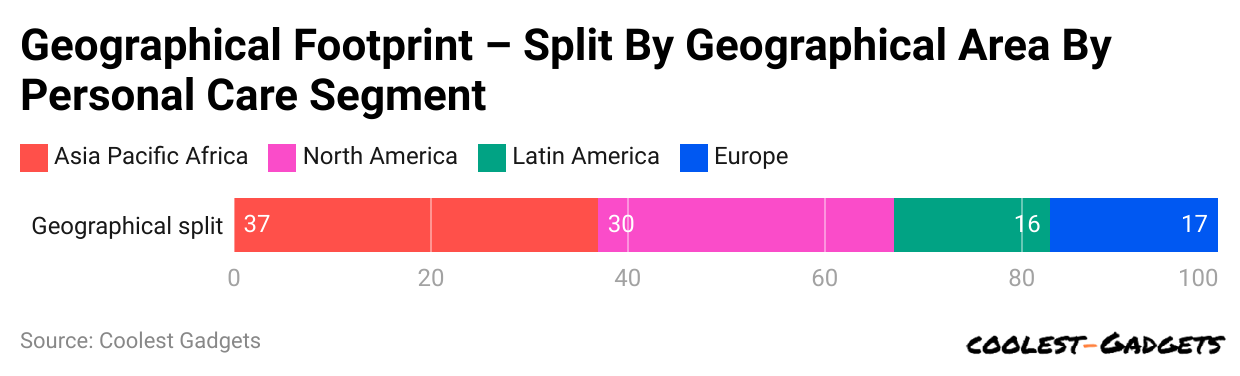
- In Q1 of 2024, the Asia Pacific African region generated the highest share, 37%, in the personal care segment.
- The Unilever Group’s other regional shares are in North America (30%), Latin America (16%), and Europe (17%).
(Reference: statista.com)
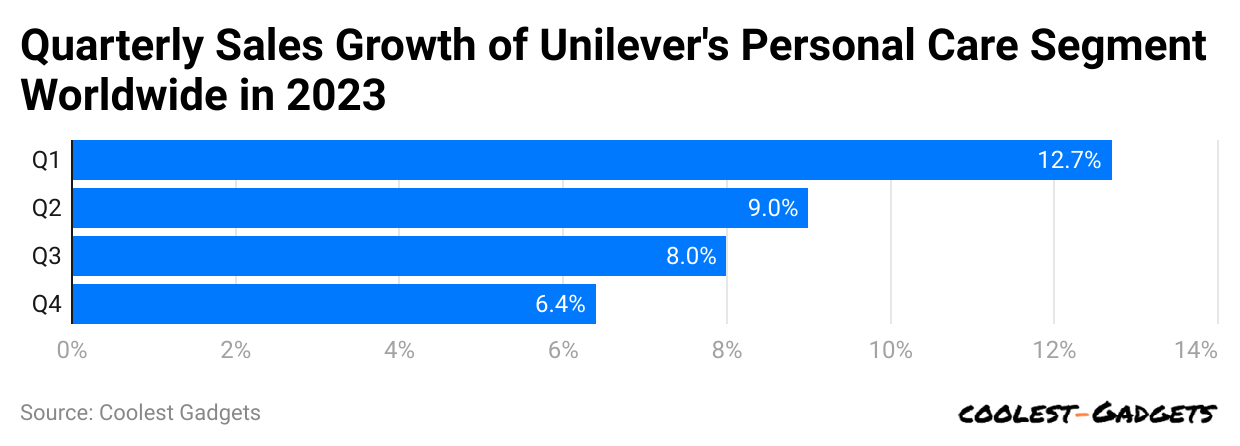
- In 2023, the quarterly sales growth in the same segment were Q1 (12.7%), Q2 (9%), Q3 (8%), and Q4 (6.4%).
- Additionally, global revenue earned by this sector was 13.8 billion euros (USD 14.86 billion).
By Home Care Segment
(Reference: unilever.com)
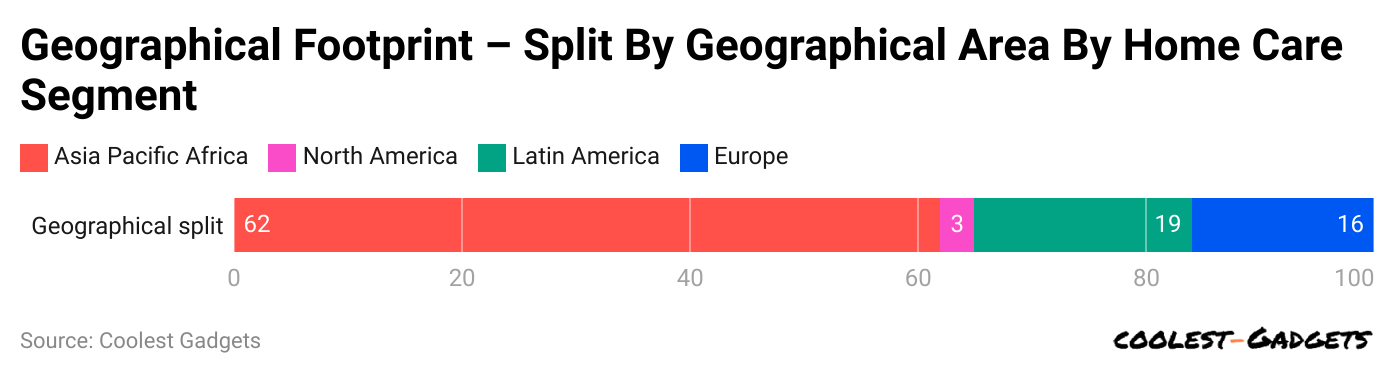
- Unilever Statistics also reports that in the first quarter of 2024, the Asia Pacific region accounted for 62% of sales share in the home care segment, followed by Latin America (19%), Europe (16%), and North America (3%).
- Home care sales increased by over 10% in the first quarter of 2023 and by 1.7% in the last quarter.
By Nutrition Segment
(Reference: unilever.com)
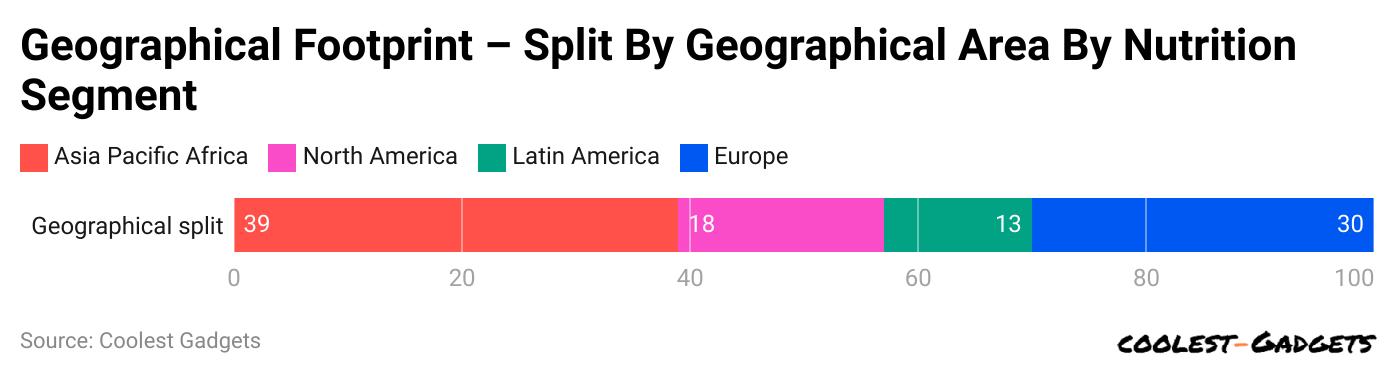
- In Unilever’s nutrition segment, the Asia Pacific African region accounted for the largest sales share, representing 39% of the total in Q1 of 2024.
- Furthermore, sales share by other regions are Europe (30%), North America (18%), and Latin America (13%)
(Reference: statista.com)
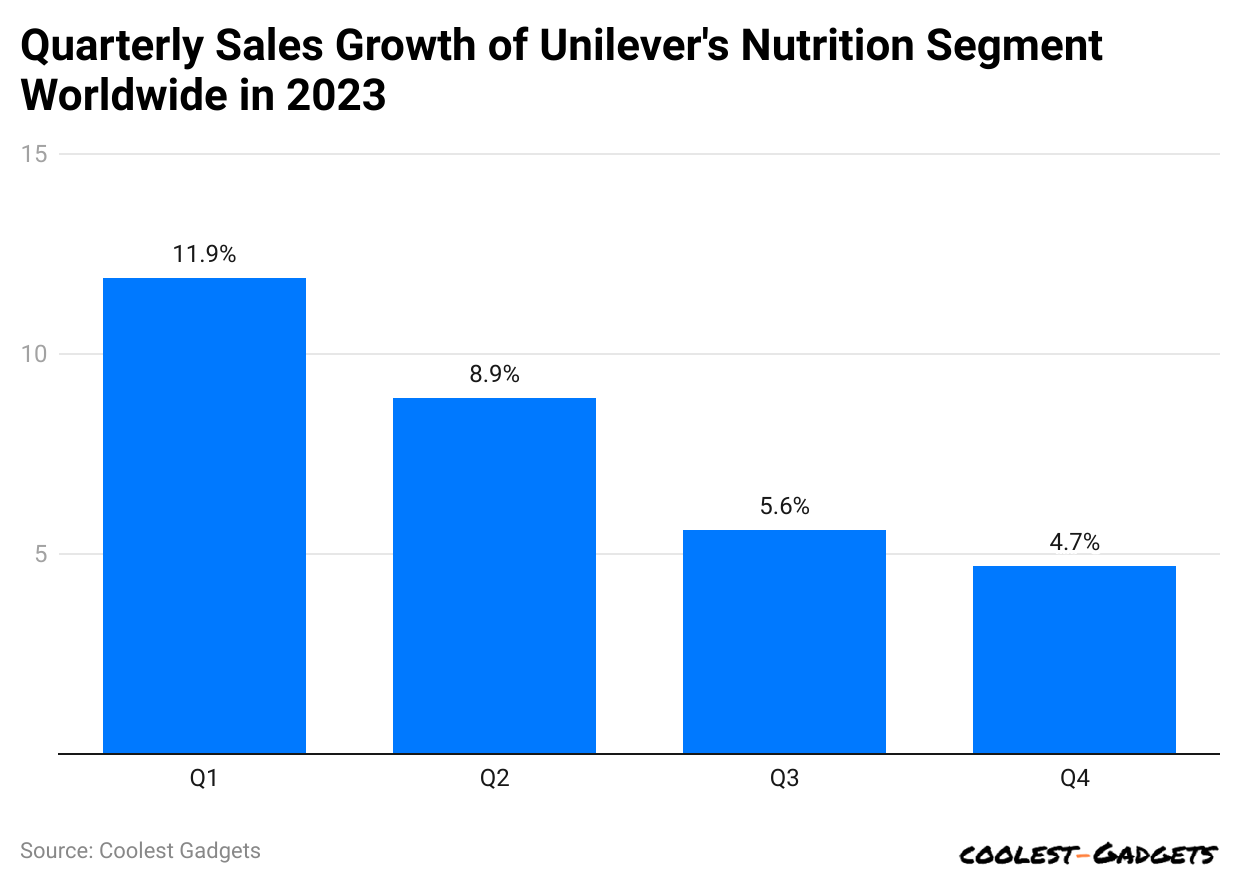
- In the fiscal year 2023, the quarterly sales growth of Unilever’s nutrition segment were Q1 (11.9%), Q2 (8.9%), Q3 (5.6%), and Q4 (4.7%).
By Ice Cream
(Reference: unilever.com)
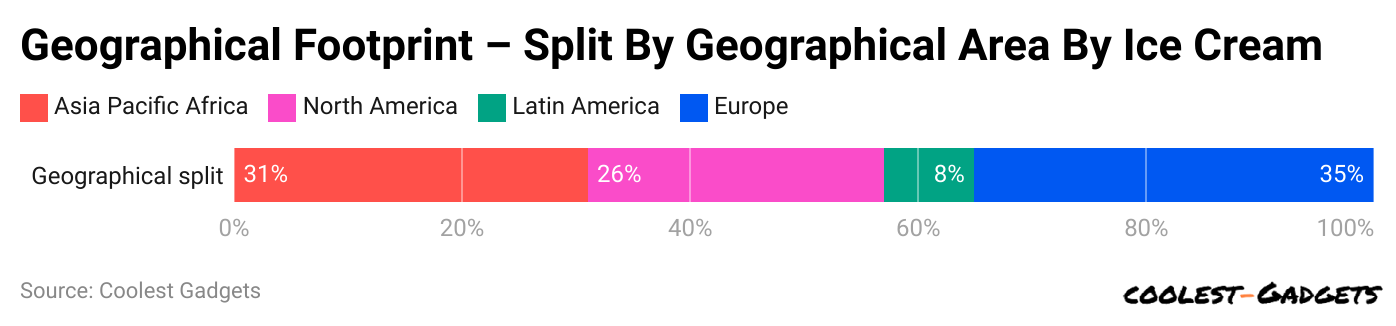
- Unilever Statistics reports that in the European region, the ice cream segment’s sales growth captured the highest share, 35%.
- Followed by Asia Pacific Africa (31%), North America (26%), and Latin America (8%).
(Reference: statista.com)
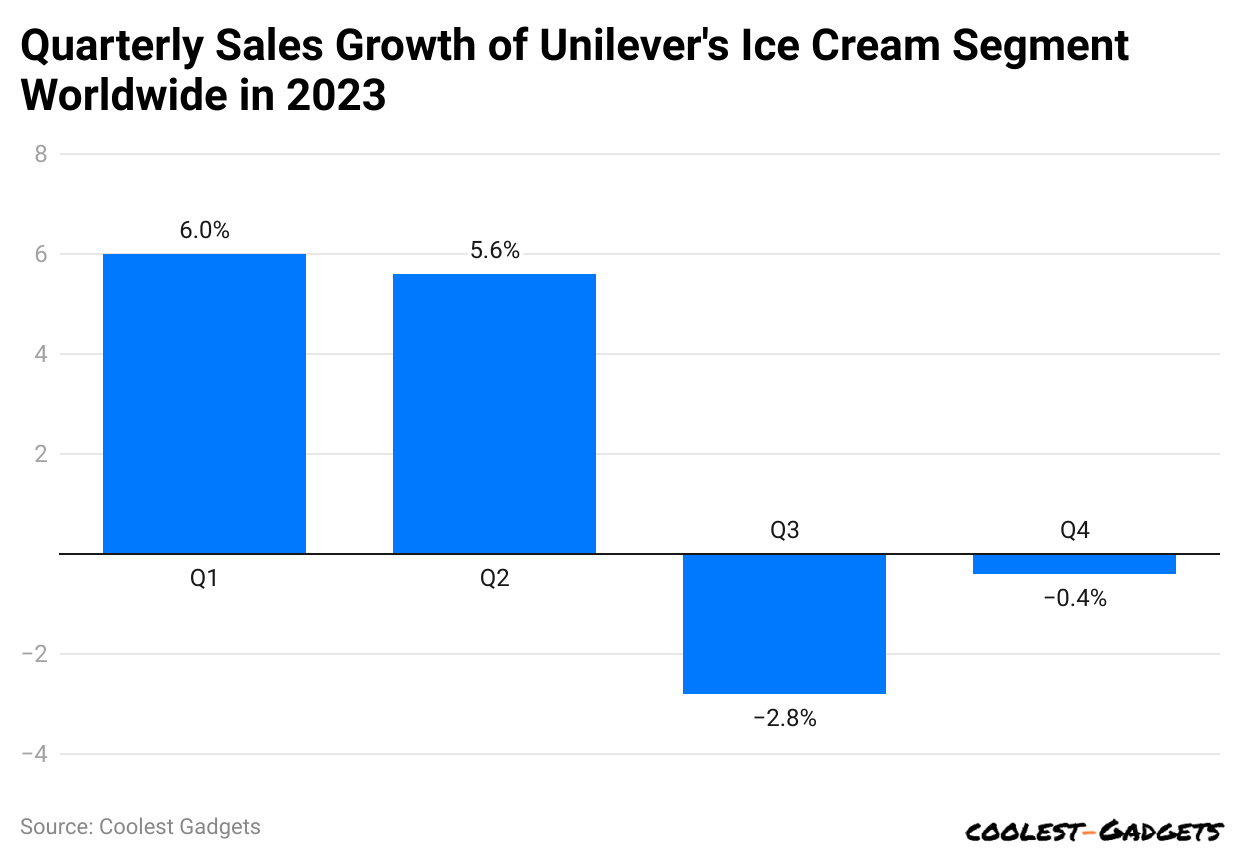
- In Q1 and Q2 of 2023, Unilever’s ice cream segment saw a sales increase of 6% and 5.6%, respectively.
- Similarly, sales declined by 2.8% in Q3 and 0.4% in Q4 of the same year.
You May Also Like To Read
- Anker Statistics
- Sennheiser Statistics
- Seagate Statistics
- Razer Statistics
- Motorola Statistics
- Samsung Statistics
- Garmin Statistics
- Panasonic Statistics
- LG Statistics
- Huawei Statistics
- Oppo Statistics
- iPhone Statistics
Unilever Demographic Statistics
- Unilever Statistics 2024 also states that Unilever’s global workforce was around 127,000 employees, representing men and women employees holding a share of 57.9% and 42.1%, respectively.
- Based on race, the most common ethnicity at Unilever is white, representing 57%, while others are Hispanic or Latino (15.7%), Asian (12.2%), Black or African American (10.6%), and unknown (4.6%).
- The annual salary earned by each employee of Unilever was around USD 50,339.
- On average, employees at Unilever remain with the company for 5.3 years.
- 6% of Unilever employees are predominantly affiliated with the Democratic Party.
- The top five major shares of Unilever employees include Business (26.1%), Marketing (8.8%), Accounting (6.9%), Computer Science (6.7%), and Biology (5.7%).
- The degrees of Unilever employees are by Bachelors (61.7%), Masters (12.5%), and High School Diplomas (10%).
Unilever New Product Launches Statistics
| Products | Launch Date | Price | Details |
| Hair Care Products | |||
|
Dove Bond Strength Collection: |
February, 2024 | Not yet announced | This new line focuses on bond repair technology, leveraging advanced formulations to strengthen hair (Glossy). |
| SheaMoisture Bond Repair Collection (Amla Oil & Amino Blend Bond Repair Shampoo, Conditioner, Leave-in Conditioner, Bonding Oil, Repair Masque, and Regrowth Treatment) | January, 2024 | Various, starting at USD 8.99 for hair masks |
A comprehensive range aimed at repairing and strengthening hair with natural ingredients (Glossy). |
| Fragrance and Personal Care | |||
|
Lynx Fine Fragrance Collection (Five premium scents in 150ml aerosol cans) |
January 22, 2024 | Affordable | This range targets Gen Z males, offering high-end fragrances at accessible prices. The collection includes Black Vanilla, Blue Lavender, Aqua Bergamot, Emerald Sage, and Copper Santal (Unilever). |
| Rexona 72-Hour Deodorant: | May, 2024 | Not Specific |
Features advanced motion-sense technology for extended protection from sweat and odor. The launch includes a comprehensive marketing campaign to educate consumers on personal hygiene (The Nation Newspaper). |
| Home Care | |||
|
Domestos Power Foam Spray: |
February 20, 2024 | – | Expanded range with new fragrances like Floral Burst and a Limescale Remover variant. The product is designed for superior hygiene performance and convenience (Unilever). |
| Sustainable Laundry Capsules: | 2024, first in France | – |
These capsules feature biodegradable ingredients and plastic-free packaging, reducing the carbon footprint by 16%. They are optimized for cold, short washing cycles (Unilever). |
Unilever Website Traffic Statistics By Country
(Source: similarweb.com)
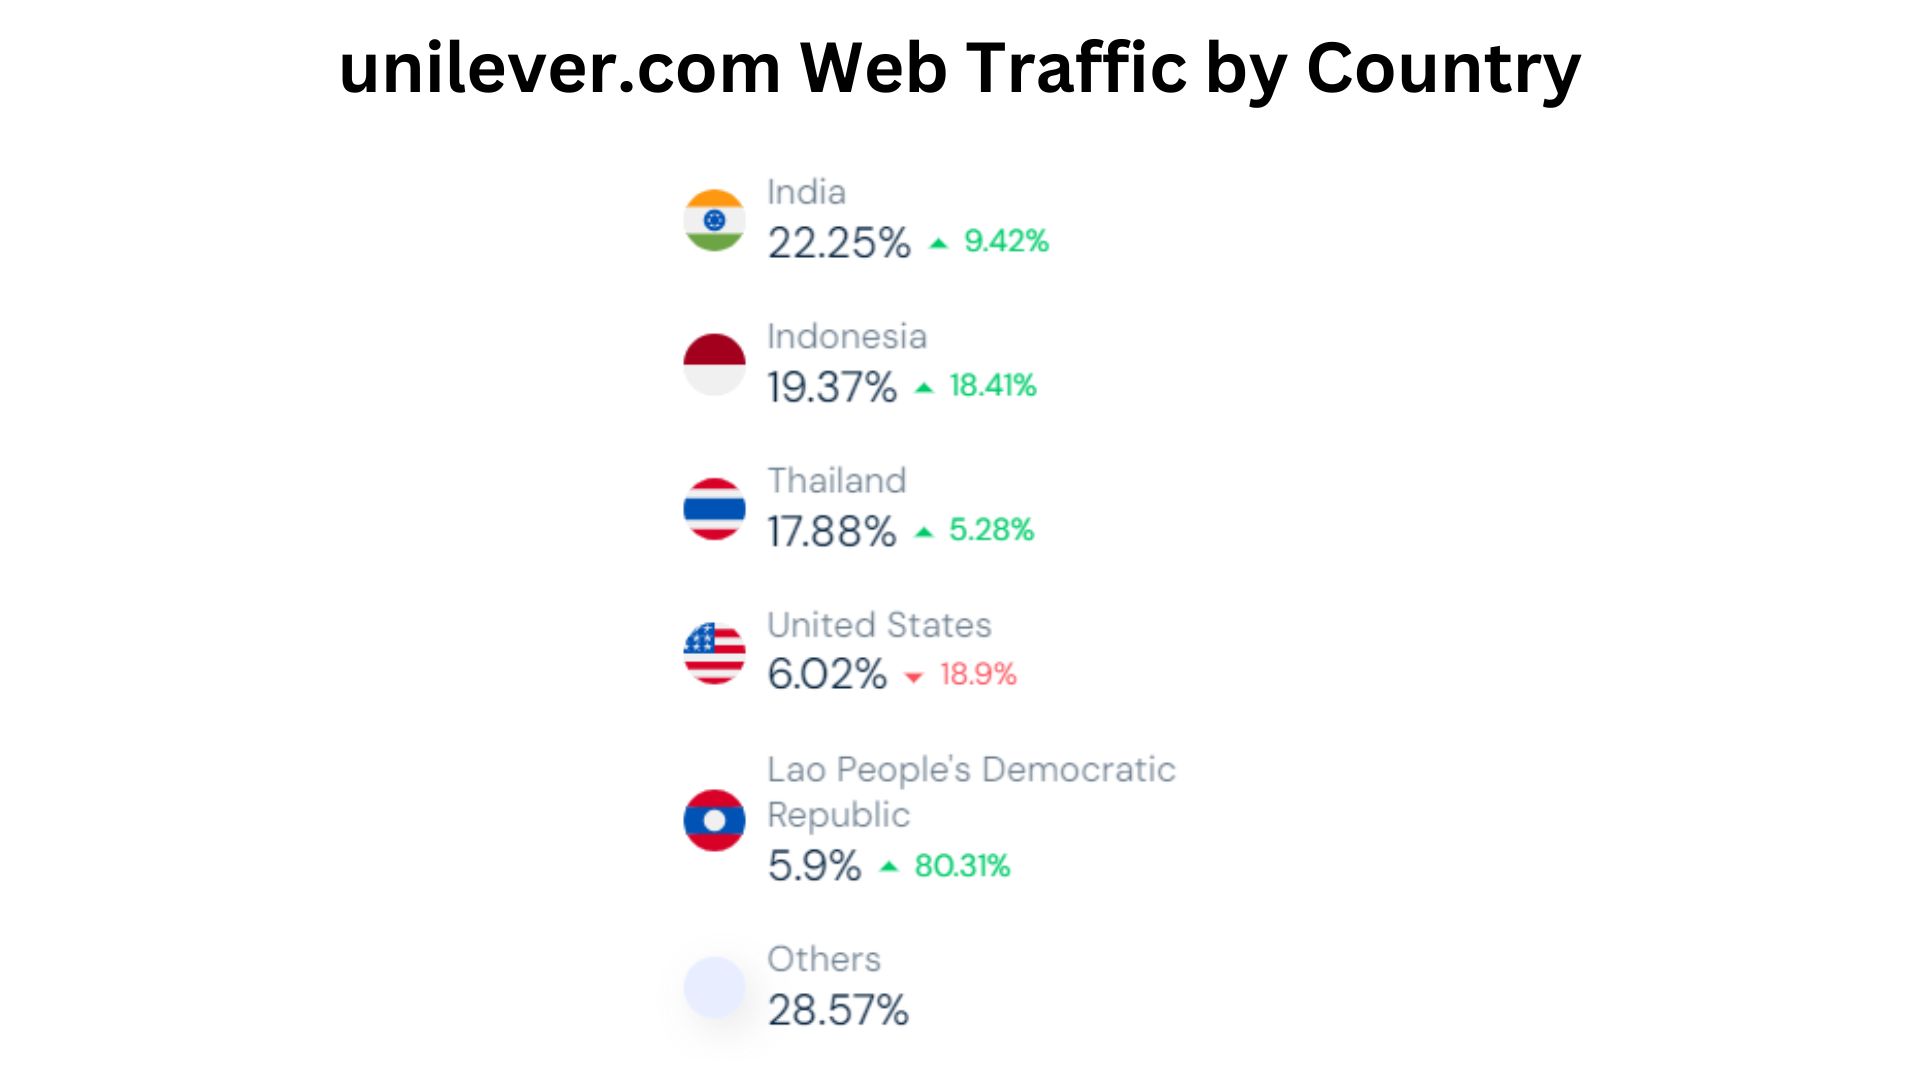
- Unilever Statistics 2024: India had 22.25% of Unilever’s website’s total traffic, up by 9.42%.
- During the same duration, other countries recorded the following contribution in total traffic: Indonesia = 19.37% (+18.41%), Thailand = 17.88% (+5.28%), the United States = 6.02% (-18.9%), and Lao People’s Democratic Republic = 5.9% (+80.31%)
- Other countries collectively made up around 28.57% of visitor share on unilever.com.
By Device
(Reference: semrush.com)
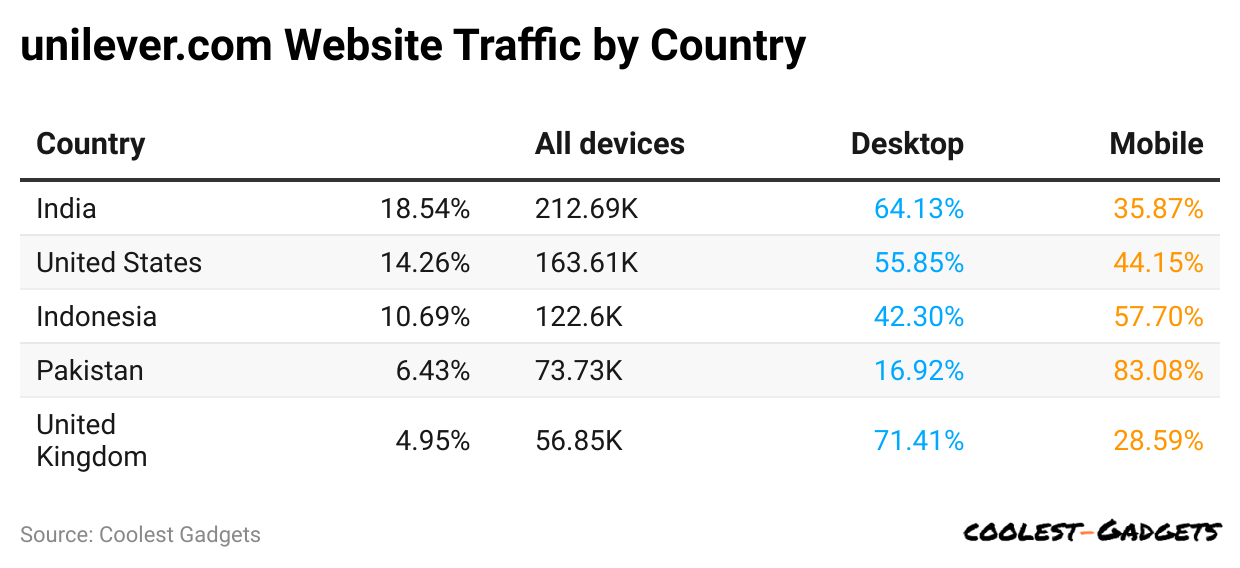
- As per Unilever Statistics, in May 2024, India had 212.69 thousand users on Unilever.com, with a user share of 18.54%. Meanwhile, around 64.13% of traffic share came via desktop and 35.87% on mobile devices.
- Website users make up around 14.26% of the United States user base, resulting in 163.61K, of which 55.85% have access to the desktop version and 44.15% by mobile devices.
- In Indonesia, Unilever’s website had 122.6K users and 10.69% user traffic, with desktop and mobile users being 42.3% and 57.7%, respectively.
- Pakistan has around 6.43% user share, resulting in 73.73K users, and the United Kingdom’s user share secured 4.95% (56.85K)
- Besides, 16.92% of desktop and 83.08% of mobile users in Pakistan accessed unilever.com.
- Similarly, in the United Kingdom, around 71.41% of users access the website via desktops, and 28.59% access it through mobile devices.
By Demographics
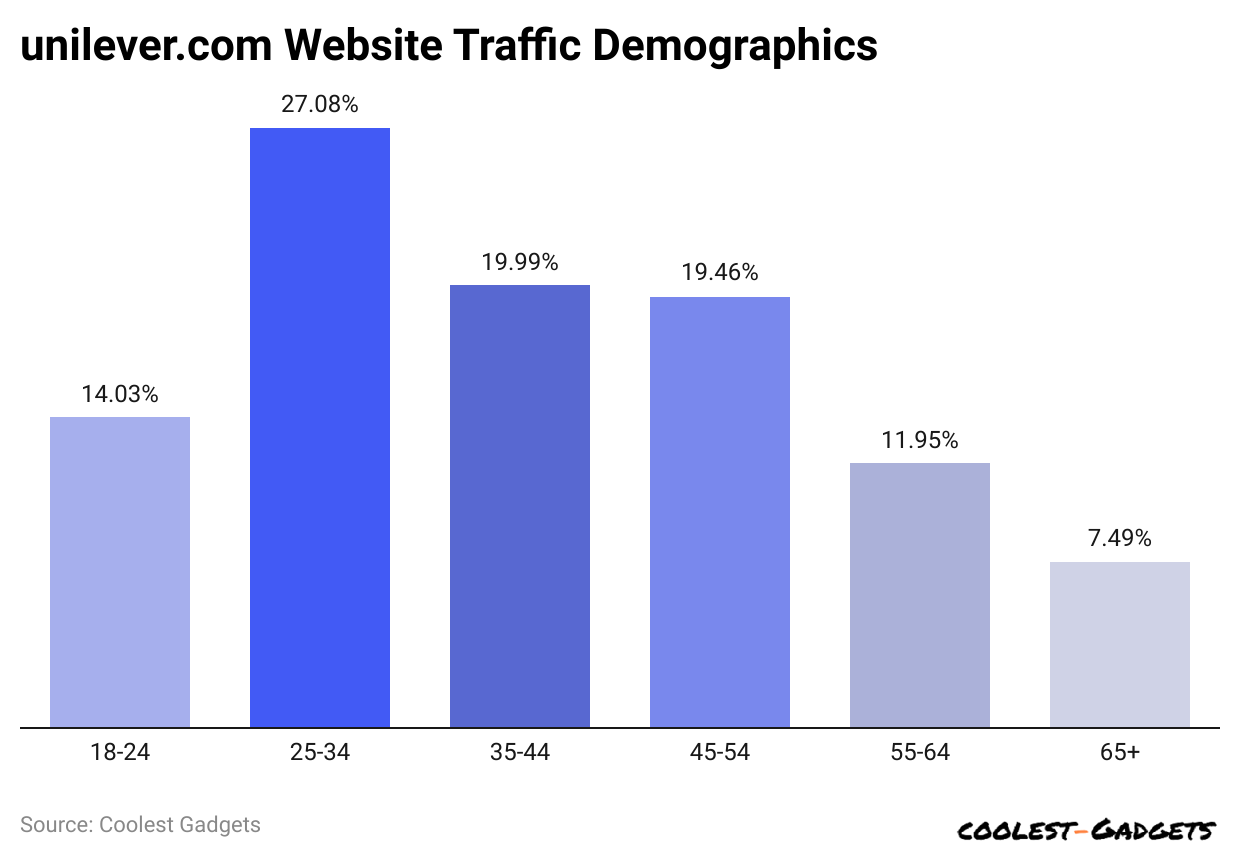
(Reference: similarweb.com)
- In May 2024, male and female users of unilever.com were 44.14% and 55.86%, respectively.
- The Unilever Statistics by age group state that the highest number of website users observed is between 25 and 34 years old, which is 36.79%.
- 17% of Unilever’s website users are aged 35 to 44 years.
- In contrast, 17.22% and 14.02% belong to individuals aged 18 to 24 and 45 to 54, respectively.
- Around 8.81% of website users are aged from 55 to 64 years.
- Nearly 4.99% of user shares of unilever.com contributed from the age group above 65 years.
By Traffic Source
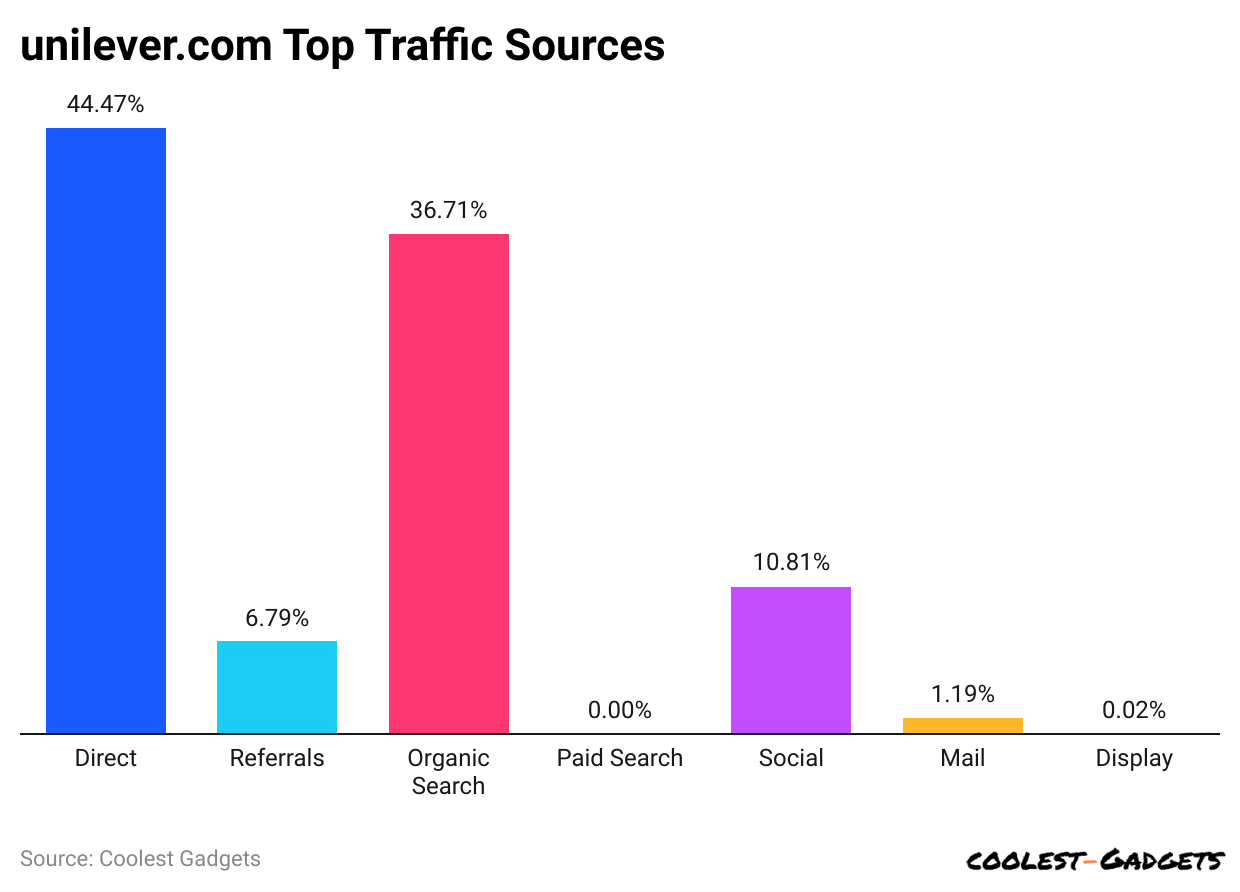
(Reference: similarweb.com)
- Unilever Statistics 2024 also shows that direct search generated the highest traffic rate to Unilever.com, 44.47%.
- Almost 36.71% of the share is generated by organic traffic searches, while 10.81% is from social media searches.
- Furthermore, the website’s other traffic sources are referrals (6.79%), mail (1.19%), and display (0.02%).
By Social Media Referral Statistics
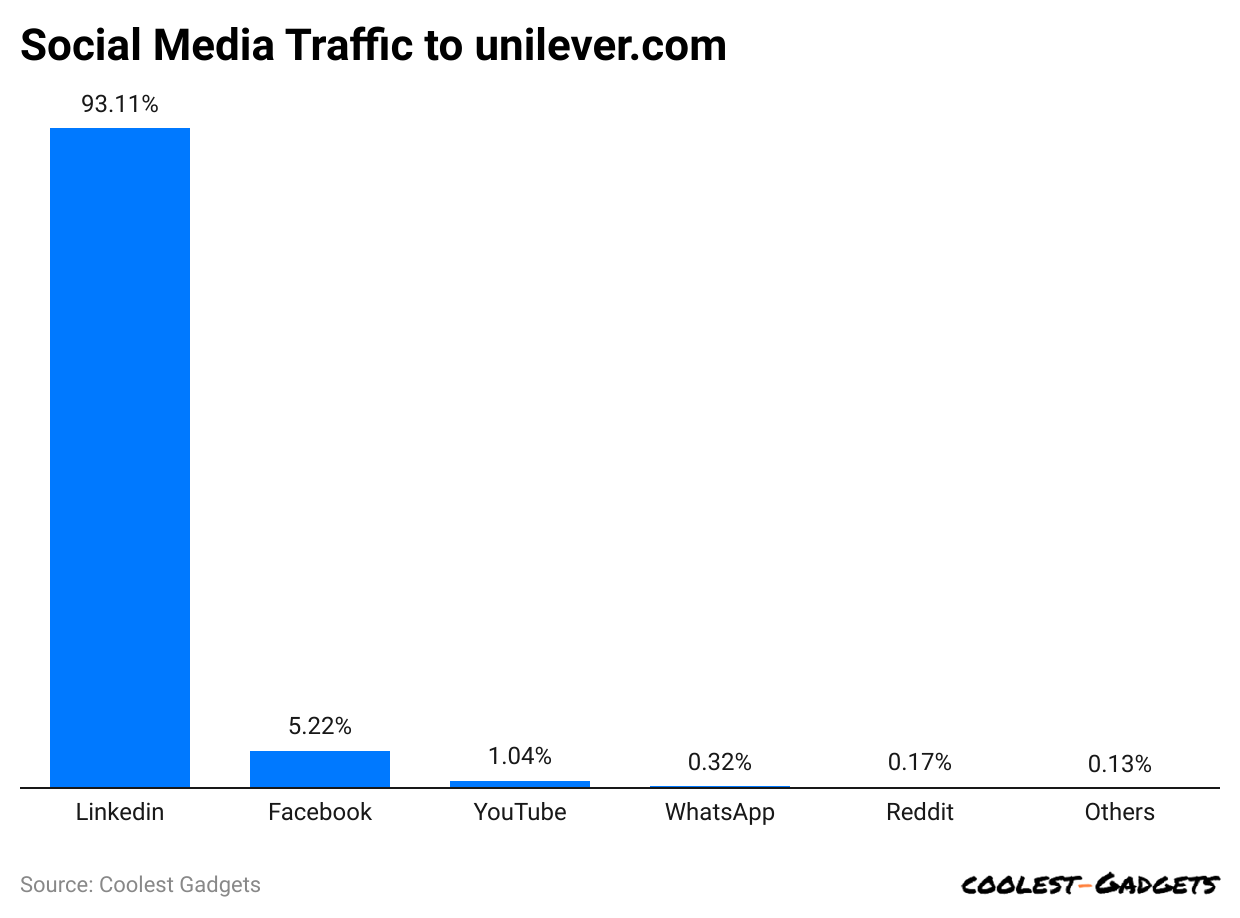
(Reference: similarweb.com)
- Unilever Statistics reported that LinkedIn had the highest social media referral rate in com, with a 93.11% share compared to other social network traffic.
- Facebook and YouTube each contributed a share of 5.22% and 1.04% on unilever.com.
- Meanwhile, traffic sent by WhatsApp was 0.32%, and Reddit contributed 0.17%.
- Similarly, the rest of Unilever’s website’s social networks together made up around 0.13% of the traffic share.
The Top Player’s Statistics By the Beauty Industry
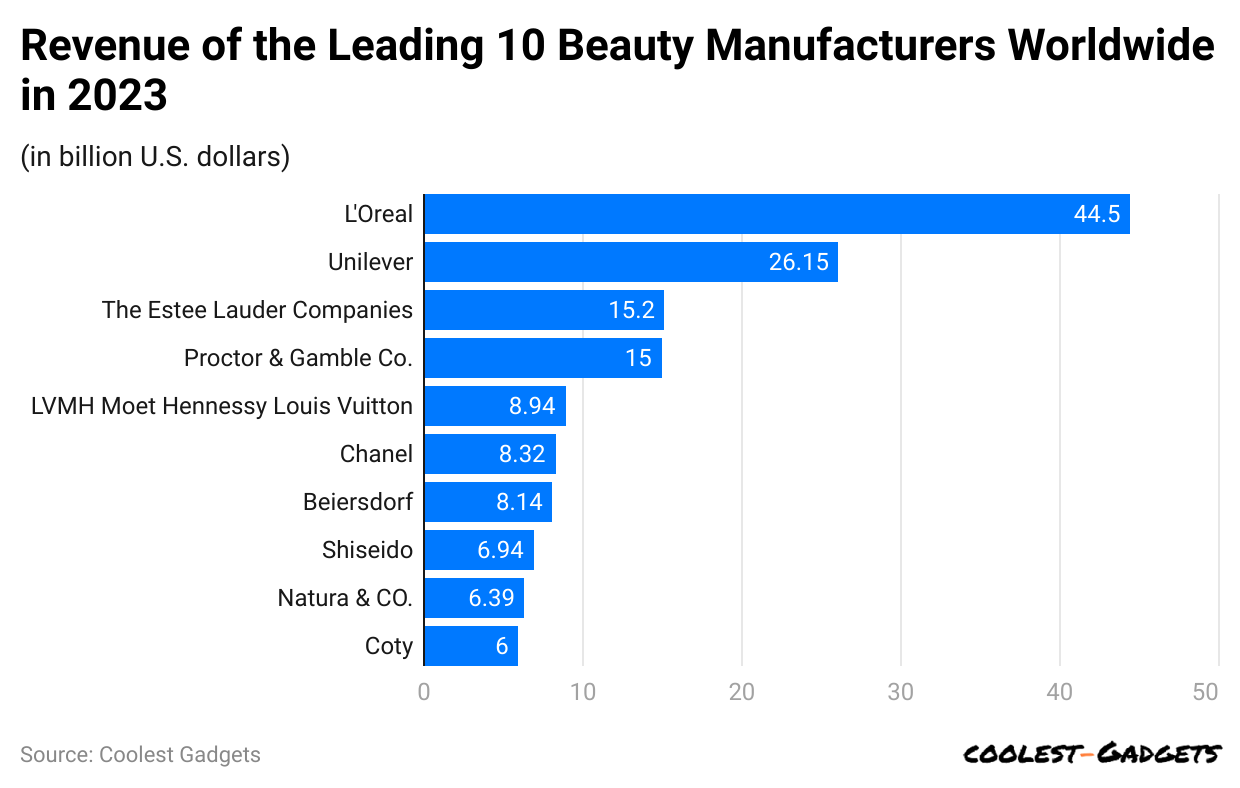 (Reference: statista.com)
- As of 2023, L’Oréal led the global beauty market, generating approximately 44.5 billion U.S. dollars in revenue.
- On the other hand, Unilever secured the second position, resulting in USD 26.15 billion.
- Other brands beauty sales revenue were Estée Lauder (USD 15.2 billion), P&G (USD 15 billion), LVM (USD 8.94 billion), Chanel (USD 8.32 billion), Beiersdorf (USD 8.14 billion), Shiseido (USD 6.94 billion), Nature & Co (USD 6.39 billion), and Coty (USD 6 billion).
Unilever Shipments Statistics By Trends
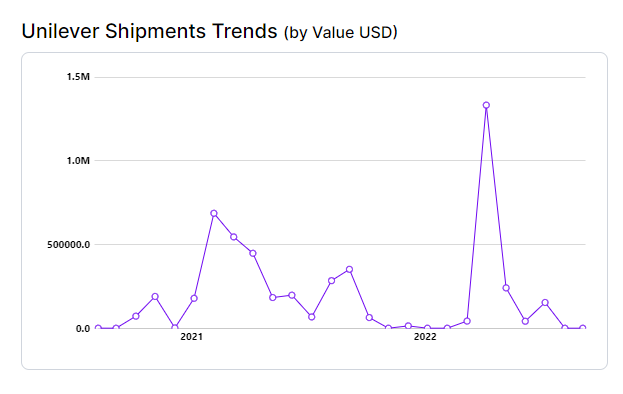
(Source: trademo.com)
- According to Trademo Intel, Unilever recorded 987 import shipments and 158 export shipments from the U.S.
- Unilever, a global consumer goods company, sources a significant portion of its products from Brazil, Taiwan, and Ecuador.
- As of April 2024, the shipment value of Unilever shipments trends, representing USD 178408.0.
The monthly shipment values of Unilever from 2023 to 2024 are detailed below:
| Months (shipment value) | 2023 (USD) | 2024 (USD) |
| January | 245490 |
68130 |
|
February |
309962 | 0.0 |
| March | 664268 |
40270 |
|
April |
220774 | 178408 |
| May | 422167 |
– |
|
June |
366533 | – |
| July | 305959 |
– |
|
August |
284117 | – |
| September | 193344 |
– |
|
October |
351293 | – |
| November | 65647 |
– |
|
December |
342164 |
– |
Unilever Patent Statistics
- Unilever holds over 20,000 patents, which protect the company’s discoveries and breakthrough innovations.
- In the first quarter of 2024, the company saw a 137% increase in patent filings in February and a 140% increase in grants in March compared to the previous quarter.
- Unilever Statistics 2024 also represents a 100% increase in filings and an 84% increase in grants from Q4 2023 (Just Food).
- Globally, Unilever holds a total of 43,123 patents, with 17,946 of these granted (Insights; Gate).
- The European Patent Office (EPO) is particularly notable, with Unilever having 46% of its grants and 30% of its filings there in Q1 2024.
- Unilever’s patent portfolio is heavily focused on innovations in climate change, emissions reduction, and circular plastic economy, with nearly 18% of its patents related to climate change.
| Name | Share | Equities |
| BlackRock Investment Management (U.K.) Ltd. | 3.86% |
96,642,665 |
|
The Vanguard Group, Inc. |
3.58% | 89,762,000 |
| BlackRock Fund Advisors | 2.61% |
65,430,000 |
|
Legal & General Investment Management Ltd. |
1.31% | 32,910,420 |
| Artisan Partners LP | 1.08% |
27,135,000 |
|
Clearstream Banking SA |
1.04% | 26,192,000 |
| SSgA Funds Management, Inc. | 0.96% |
24,206,000 |
|
Fundsmith LLP |
0.93% | 23,468,368 |
| Vanguard Global Advisers LLC | 0.91% |
22,979,000 |
|
Aviva Investors Global Services Ltd. |
0.84% |
21,182,797 |
(Source: marketscreener.com)
Sustainable Initiatives of Unilever
- Unilever Statistics further show that the company aims to achieve net zero emissions across its entire value chain by 2039. As of now, they have already reduced their operational greenhouse gas (GHG) emissions by 74% from a 2015 baseline (Unilever) (ESG Today).
- By 2030, Unilever plans to cut energy and industrial emissions from its purchased goods and services, as well as other activities, by 42%. They also aim to reduce GHG emissions related to forest, land, and agriculture (FLAG) by 30.3% (ESG Today).
- Unilever has invested €1 billion (USD 1.07 billion) over ten years to transform its packaging processes. One example is the new Dirt is Good (DiG) re-engineered capsules, which are packed in fully recyclable cardboard boxes, saving around 6,000 tonnes of plastic annually (Unilever).
- The company consumes energy at 245 sites in over 70 countries and is working to ensure all its electricity and heat come from renewable sources. Pilot projects include using heat pumps in ice cream factories to offset heat requirements, potentially reducing CO2 emissions by up to 70% (Unilever).
- Unilever supports regenerative agricultural practices to enhance ecosystem resilience. They have committed to a €325 million (USD 349.25 million) investment in their oleochemicals facility in Indonesia to ensure deforestation-free commodity sourcing (Unilever).
Conclusion
In summary, Unilever stands out as a global leader in the consumer goods sector, driven by a strong commitment to sustainability, innovation, and consumer satisfaction. The company’s significant investments in research and development and its diverse portfolio of leading brands ensure its continued market dominance and growth.
With a vast global presence and a strategic focus on emerging markets, Unilever is well-positioned to maintain its trajectory of success and positive impact on consumers and communities worldwide.
Sources
Joseph D'Souza started Coolest Gadgets in 2005 to share his love for tech gadgets. It has since become a popular tech blog, famous for detailed gadget's reviews and companies statistics. Joseph is committed to providing clear, well-researched content, making tech easy to understand for everyone. Coolest Gadgets is a trusted source for tech news, loved by both tech fans and beginners.