Tablet Statistics By Revenue, Region, Vendors, Demographics, Brand And Users

Updated · Mar 03, 2025


TABLE OF CONTENTS
- Introduction
- Editor’s Choice
- General Tablet Statistics
- Tablet Revenue Statistics
- By Revenue Per Capita
- By Sales Volume
- By Price
- Revenue Comparison of eBooks Statistics by Country
- By Region
- Key Players of Tablet Statistics
- Tablet Shipments Market Share by Vendors
- Tablet Vendor Market Share Statistics By Months
- Tablet User Demographics Statistics
- Tablet Ownership Statistics by Brand
- By Vendors
- Tablet User Statistics By Age Group
- Weekly Time Spent Using Tablets by Users Statistics
- Tablets Lifespan Statistics By Types
- Table Screen Resolution Statistics By Region (June 2024)
- By Country (June 2024)
- Tablets Product Development Analysis
- Conclusion
Introduction
Tablet Statistics: A tablet is a small, lightweight device with a touchscreen that combines the features of a smartphone and a laptop. It is easy to carry and use, making it popular for work, study, and entertainment. Tablets allow users to browse the Internet, watch videos, play games, read e-books, and even perform office tasks.
Most tablets run on operating systems like Android, iOS, or Windows and support apps for different needs. They also come in various screen sizes, have long battery lives, and have fast processors for smooth performance.
With their portability and ease of use, tablets have become essential for students, professionals, and travelers. They provide a great balance between a smartphone’s convenience and a laptop’s functionality.
Editor’s Choice
- Tablet Statistics show that the global tablet market will earn USD 53.7 billion in 2024, and the revenue will decrease by 2.3% from last year.
- By late 2024, tablet shipments grew to 39.6 million units in Q3, showing a 20.4% increase compared to last year.
- The United States will account for the leading position globally in revenue generation of USD 9.7 billion in 2024,
- Meanwhile, the tablet market revenue per person is estimated to be USD 6.93.
- The average price of a tablet in the same period is expected to be approximately USD 305.60.
- By 2024, tablet sales are supposed to reach 175.8 million units.
- Tablet sales are expected to decrease slightly in 2025, with a projected decline in growth of around 1.9%.
- Tablet Statistics further report that Apple held 31.7% of the tablet market in Q3 2024, keeping its position as the top tablet brand globally.
- Moreover, in the same duration, Samsung secured the second position with a tablet market share of 21.7%.
- Huawei’s shipments grew by 44.1% compared to last year, reaching 3.2 million units in the third quarter of 2024.
You May Also Like To Read
- Cameras Statistics
- Fitness Trackers Statistics
- Drones Statistics
- Foldable Smartphones Statistics
- Sleep Tracker Statistics
- Tablet Statistics
- Smart Home Statistics
- Dashboard Camera Statistics
General Tablet Statistics
- More than 1.28 billion people around the world now use tablets, showing how popular these devices have become.
- Meanwhile, most tablet users, about 54%, mainly use them to send and read emails.
- About 23% of people use tablets to watch movies and videos.
- In the United States, people use tablets for an average of 7.42 minutes per session, which is short but frequent.
- Tablet Statistics also show that the total number of tablets shipped is expected to reach 156 million units by 2025.
- By March 2024, about 1.28 billion people globally were using various types of tablets.
- The tablet market grew slightly by 1% in the first quarter of 2024, with total shipments hitting 33.7 million units.
- As of February 2024, China ranked first, holding 71% of the total share.
Tablet Revenue Statistics
 (Reference: statista.com)
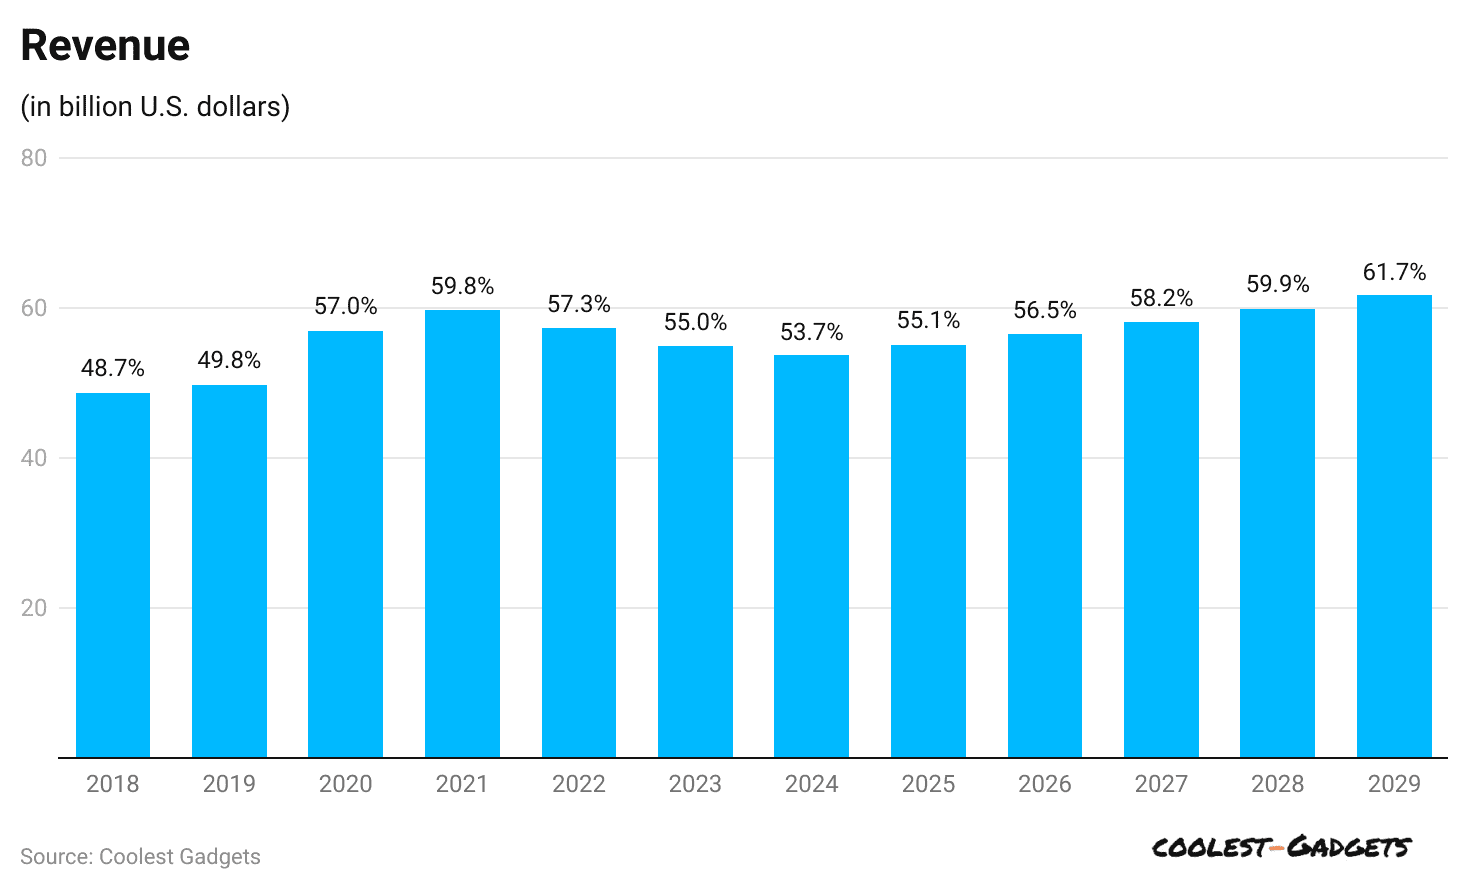
- The worldwide tablet market is expected to generate USD 53.7 billion in revenue by the end of 2024, down from USD 55 billion in 2023.
- Tablet Statistics also reports that other revenue and revenue change for the coming years is estimated to be USD 55.1 billion (2.6%) in 2025, USD 56.5 billion (2.5%) in 2026, USD 58.2 billion (2.9%) in 2027, USD 59.9 billion (3%) in 2028, and USD 61.7 (3%) in 2029.
By Revenue Per Capita
 (Reference: statista.com)
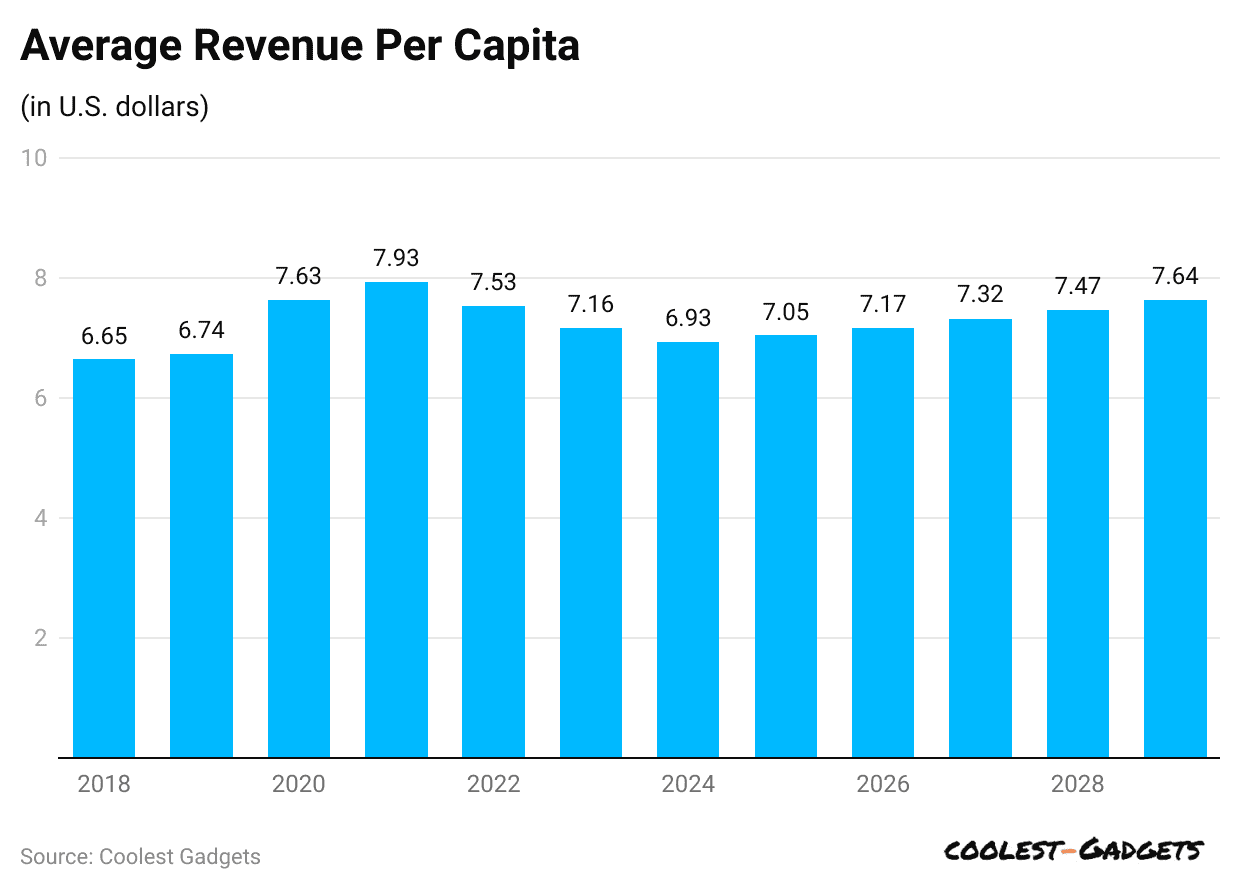
- In 2023, the average revenue per capita in the worldwide tablet industry was USD 7.16, and it is supposed to decrease by USD 6.93 in 2024.
- Furthermore, in coming years, the estimated average revenue per capita will increase subsequently, such as in 2025 (USD 7.05), 2026 (USD 7.17), 2027 (USD 7.32), 2028 (USD 7.47), and 2029 (USD 7.64).
By Sales Volume
 (Reference: statista.com)
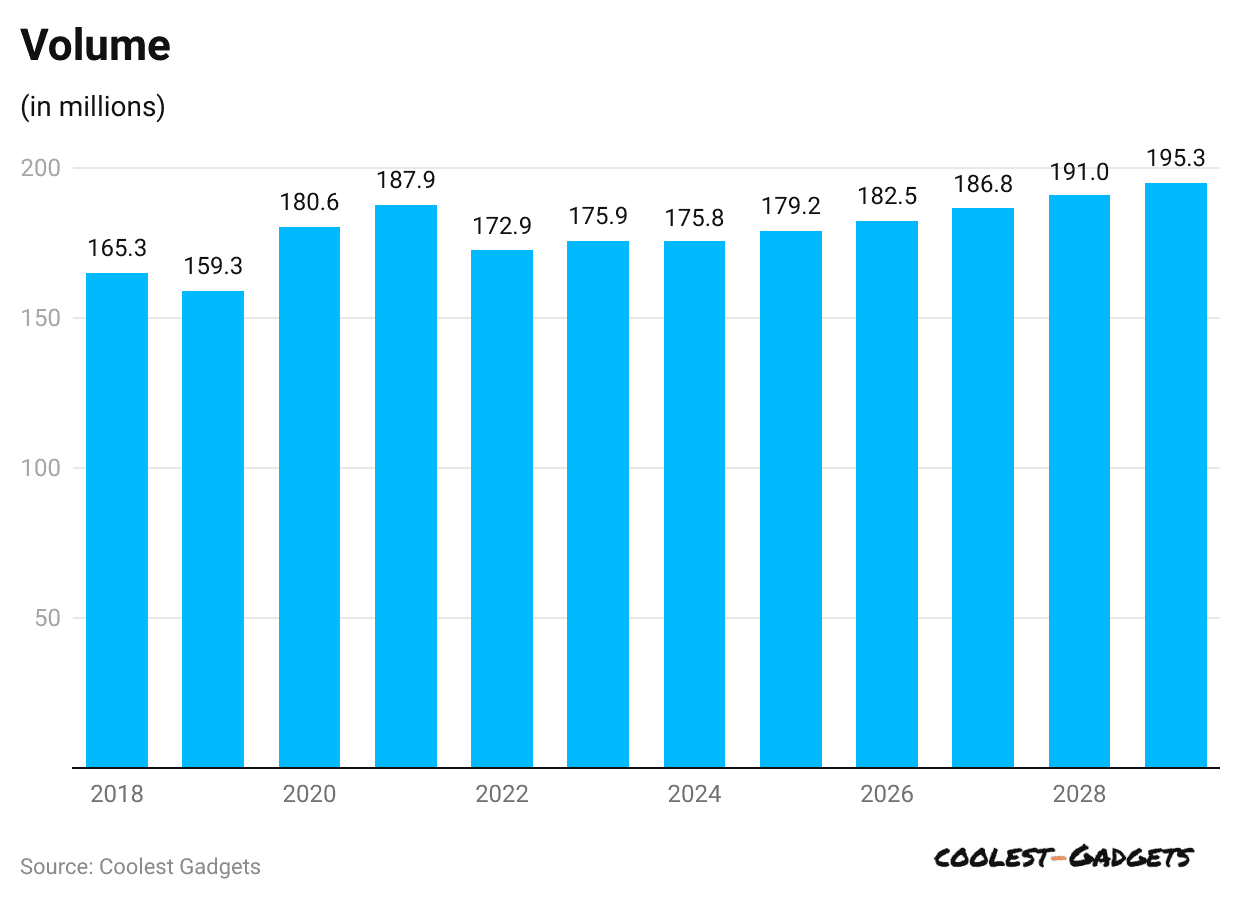
- Tablet Statistics also show that by 2024, tablet sales are supposed to reach 175.8 million units, with a slight decrease from 2023, resulting in 175.9 million units.
- The above Statista graphical representation also represents the next few years’ sales volume, and volume changes are represented as 2025: 179.2 million (1.9%), 2026: 182.5 million (1.8%), 2027: 186.8 million (2.4%), 2028: 191 million (2.2%), and 2029: 195.3 million (2.2%).
By Price
- The average price of a tablet in 2024 is expected to be approximately USD 305.60, decreasing by USD 312.60 in 2023.
- Furthermore, other prices per unit in the tablet market are estimated to be USD 307.70 by the end of 2025, followed by 2026 (USD 309.70), 2027 (USD 311.20), 2028 (USD 313.40), and 2029 (USD 315.70).
Revenue Comparison of eBooks Statistics by Country
- The United States will have the leading position globally in tablet revenue generation, with USD 9.7 billion in 2024 and a revenue change of -4.3%.
- On average, each person in the United States is expected to contribute USD 28.56 in revenue.
- Tablet Statistics also reports that by 2029, the tablet market is expected to reach a total volume sales of 28.6 million units.
- Moreover, each person is expected to use an average of 0.1 tablet units in 2024.
As per Tablet Statistics, the other top four countries’ market analyses in 2024 are stated in the table below:
| Country | Market size (USD) |
CAGR (from 2024 to 2029) | Per person revenue (USD) |
| China | 7.7 billion | 2.21% |
5.27 |
|
India |
5.1 billion | 6.10% | 3.55 |
| Japan | 2 billion | -1.75% |
16.12 |
|
Nigeria |
1.5 billion | 4.1% |
6.58 |
By Region
- Tablet Statistics further state that in 2024, the tablet market in the Americas is expected to make USD 15.4 billion in revenue, with a change of -3.3%.
- The annual market growth is set to grow at a CAGR of 1.29% from 2024 to 2029.
- Meanwhile, the total population’s revenue per person is estimated to be USD 15.4 billion in 2024
Meanwhile, other regional revenue analyses are segmented in the table below:
| Region | Revenue (USD) |
Revenue change | CAGR (2024 to 2029) |
Per person revenue (USD) |
| Africa | 6.4 billion | 4% | 7.71% | 4.95 |
| Asia | 20.8 billion | -1.9% | 2.96% | 4.56 |
| Australia & Oceania | 0.6 billion | -3.7% | 1.54% | 15.05 |
| Caribbean | 0.4 billion | 1.5% | 5.48% | 8.90 |
| Europe | 10.6 billion | -4.7% | 1.34% | 12.52 |
Key Players of Tablet Statistics
- Globally, Apple will be the top brand of tablets in 2024, with a market share of 7% in the third quarter of 2024 and a growth rate of 1.4% year over year.
- The total number of Apple tablet shipments will reach up to 12.6 million units.
As per Tablet Statistics, other top key players of the global tablet market in 2024 are stated in the table below:
| Players | Market share | YoY growth rate |
Shipments (in units) |
| Samsung | 17.9% | 18.3% | 7.1 million |
| Amazon | 11.6% | 111.3% | 4.6 million |
| Huawei | 8.2% | 44.1% | 3.3 million |
| Lenovo | 7.6% | 14.7% | 3 million |
 (Source: statista.com)
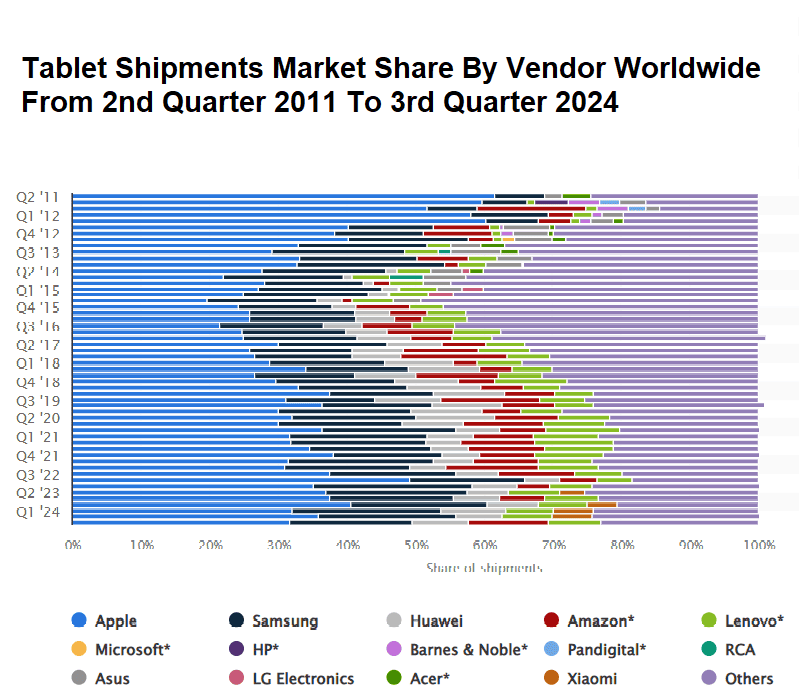
- By the third quarter of 2024, Apple iPads made up 31.7% of the global tablet market, down from about 36% in the earlier quarter.
As mentioned in Tablet Statistics, the quarterly tablet shipment market share in 2024 by vendors is elaborated down:
| Tablet Vendors | Q1 | Q2 | Q3 |
| Apple | 32% | 35.8% |
31.7% |
|
Samsung |
21.7% | 20.1% | 17.9% |
| Huawei | 9.4% | 6.8% |
8.2% |
|
Lenovo |
7% | 7.3% | 11.6% |
| Xiaomi | 5.9% | 5.8% |
7.6% |
|
Others |
24% | 24.3% |
22.9% |
(Reference: statcounter.com)
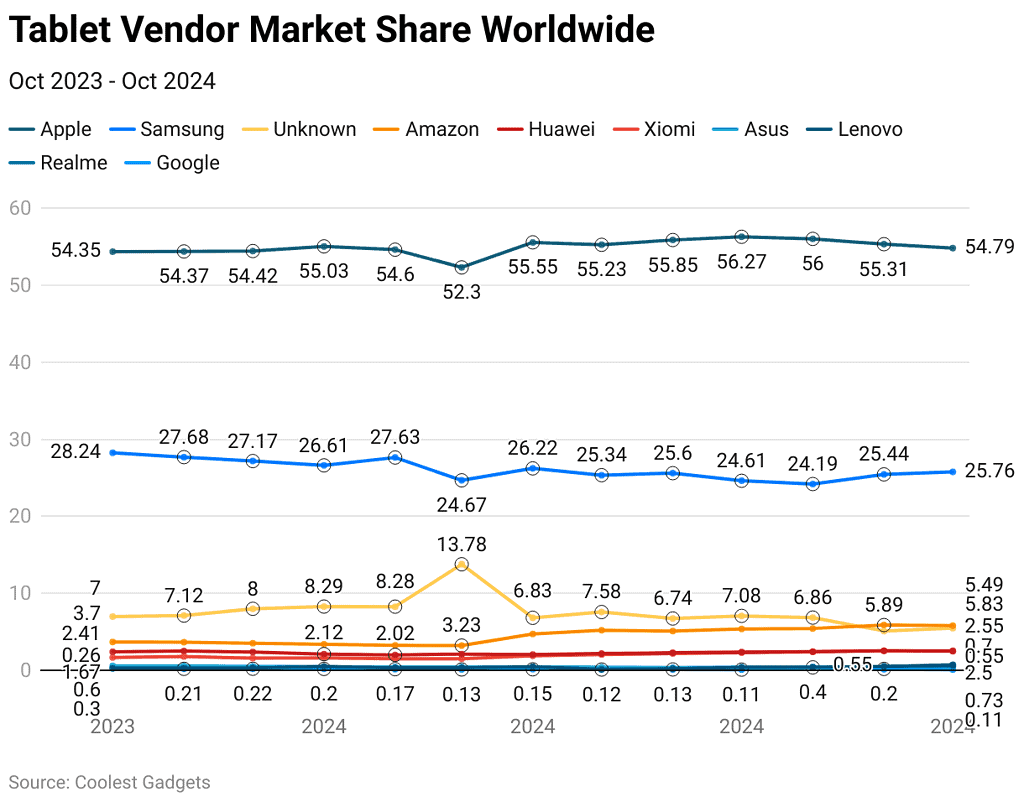
- Tablet Statistics show that in October 2024, the market’s top six tablet vendors’ market shares are followed by Apple (54.79%), Samsung (25.76%), Amazon (5.83%), Xiaomi (2.55%), Huawei (2.01%), Asus (0.38%), Lenovo (0.73%), Realme (0.55%), Google (0.11%) and unknown (5.5%).
Furthermore, other tablet vendor’s monthly market share in 2024 is detailed below:
| Tablet Vendors | January | February | March | April | May | June | July | August | September |
| Apple | 55.03% | 54.6% | 52.3% | 55.55% | 55.23% | 55.85% | 56.27% | 56% |
55.31% |
|
Samsung |
26.61% | 27.63% | 24.67% | 26.22% | 25.34% | 25.6% | 24.61% | 24.19% | 25.44% |
| Amazon | 3.4% | 3.25% | 3.23% | 4.73% | 5.21% | 5.11% | 5.37% | 5.45% |
5.89% |
|
Huawei |
2.29% | 2.12% | 2.02% | 2.12% | 2.04% | 2% | 1.97% | 1.93% | 2.04% |
| Xiaomi | 1.62% | 1.52% | 1.51% | 1.91% | 2.05% | 2.19% | 2.3% | 2.42% |
2.55% |
|
Asus |
0.48% | 0.45% | 0.45% | 0.46% | 0.43% | 0.45% | 0.42% | 0.43% | 0.4% |
| Lenovo | 0.33% | 0.33% | 0.34% | 0.38% | 0.38% | 0.37% | 0.39% | 0.49% |
0.71% |
|
Realme |
0.17% | 0.17% | 0.17% | 0.18% | 0.19% | 0.19% | 0.17% | 0.29% | 0.55% |
| 0.2% | 0.17% | 0.13% | 0.15% | 0.12% | 0.13% | 0.11% | 0.43% |
0.16% |
|
|
Unknown |
8.29% | 8.28% | 13.78% | 6.83% | 7.58% | 6.74% | 7.08% | 6.86% |
5.12% |
Tablet User Demographics Statistics
- In 2024, women will account for 50.8% of tablet users, while men will represent 49.2%, a nearly equal distribution.
- According to Tablet Statistics, the largest group using tablets in 2024 will be people aged 25 to 34, who will make up 25% of users.
- Tablet users include 35-44 years (22%), 18-24 years (19%), 45-54 years (18%), 55-64 years (10%), and 65+ years.
- Tablet ownership is highest among Millennials (55%) and Generation X (53%).
Tablet Ownership Statistics by Brand
 (Reference: statista.com)
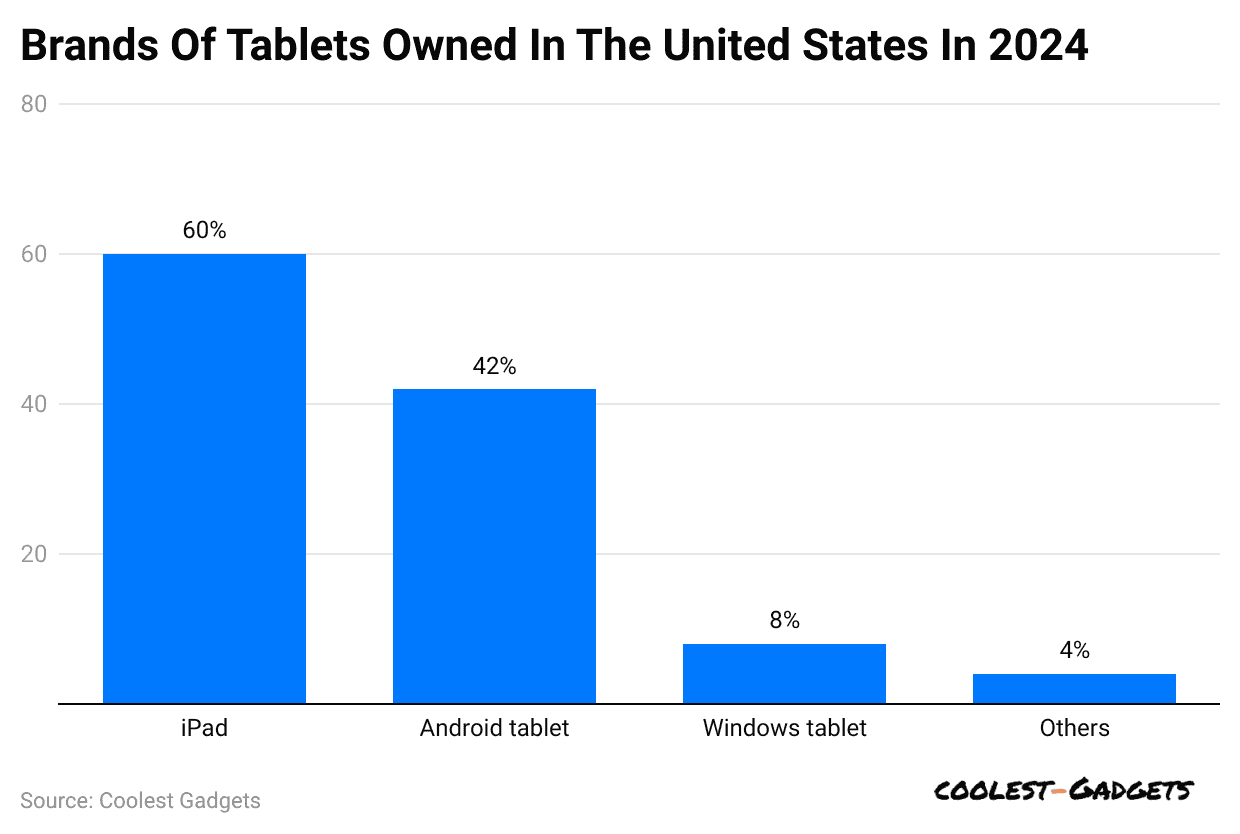
- A 2024 Statista survey in the United States showed that 60% of respondents owned an iPad, making it the most popular tablet.
- Android tablets were popular, with more than 40% of people saying they owned one, followed by others 4%.
By Vendors
 (Reference: statista.com)
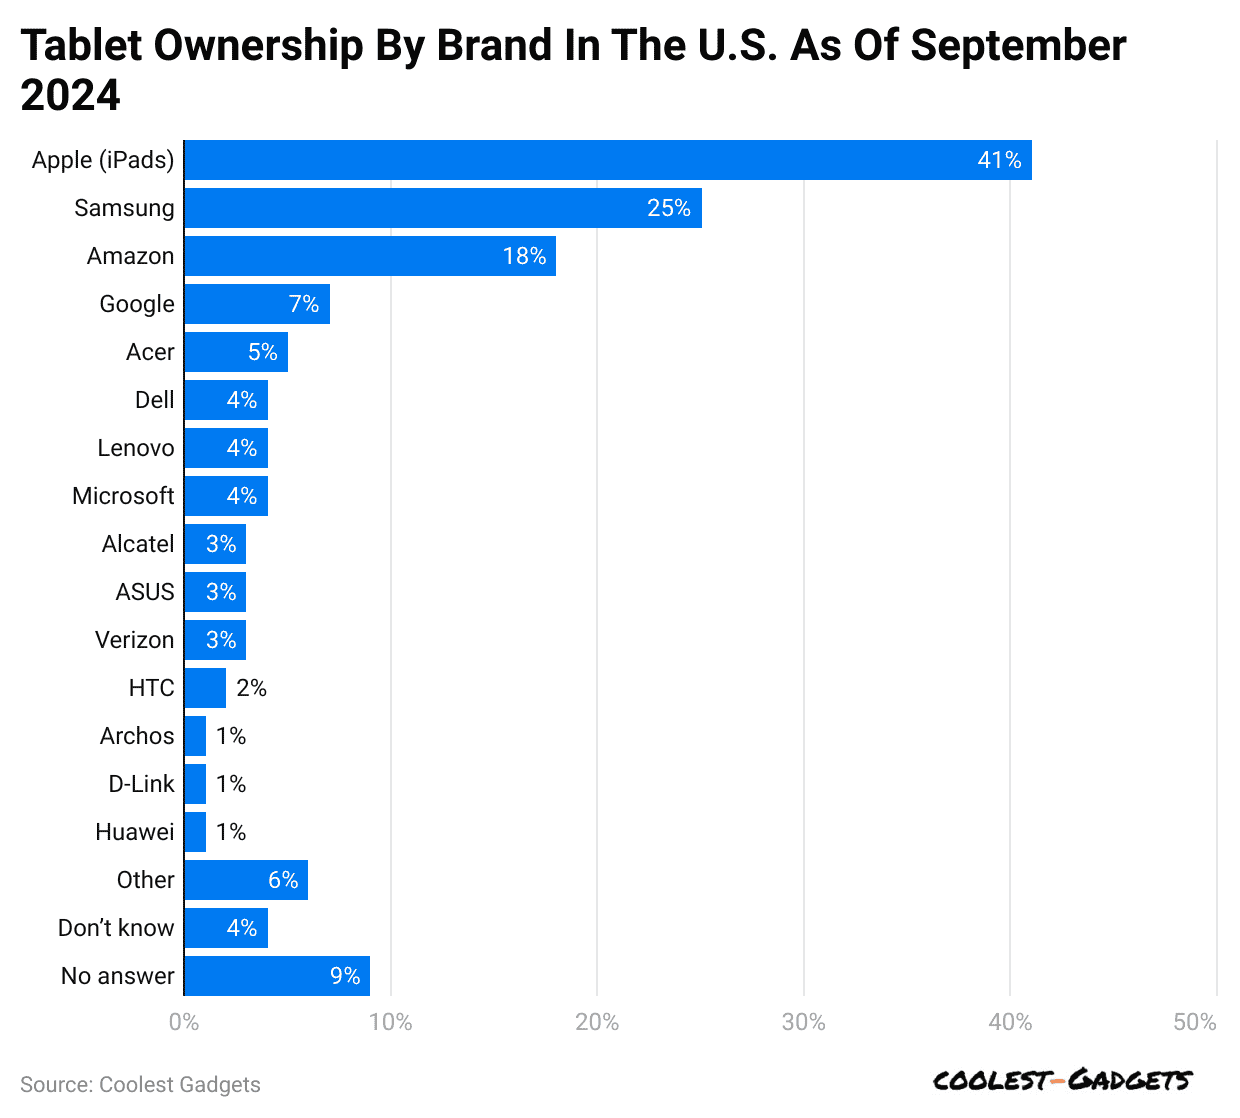
- A Statista report analyses show that in the U.S., as of September 2024, Apple iPads hold the maximum tablet ownership percentage of 41%.
- Furthermore, during the same period, other tablet vendor ownership shares were Samsung (25%), Amazon (18%), Google (7%), Acer (5%), Dell (4%), Lenovo (4%), Microsoft (4%), Alcatel (3%), ASUS (3%), and Verizon (3%). HTC (2%), Archos (1%), D-link (1%), Huawei (1%), other (6%), don’t know (4%), and no answer (9%).
Tablet User Statistics By Age Group
 (Reference: statista.com)
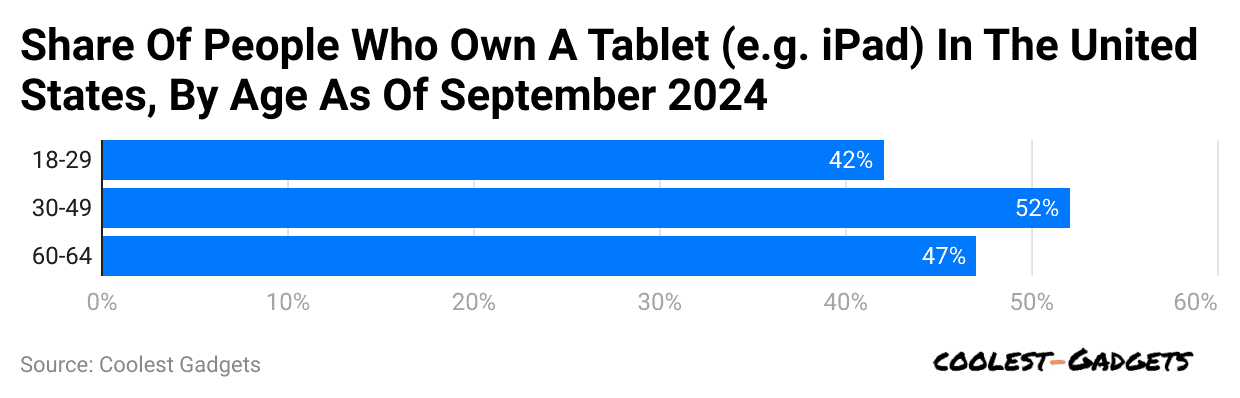
- The global Statista survey on Tablet Statistics shows that in 2024, around 52% of people aged 30 to 49 in the United States will be tablet users.
- Meanwhile, 42% of people aged 18 to 29 own a tablet like an iPad.
- Besides, tablet users aged from 50 to 64 years old account for a share of 47%.
Weekly Time Spent Using Tablets by Users Statistics
- As per Tablet Statistics, people spend an average of 13.8 hours every week using tablets for activities like browsing, reading, gaming, and entertainment.
In the U.S., weekly tablet user distribution in 2024 is stated in the following table.
| Usage Time | User Share |
| 2 to 10 hours |
30% |
|
10 to 20 hours |
25% |
| 20+ hours |
25% |
|
Less than 2 hours |
20% |
You May Also Like To Read
- Smart Video Doorbell Statistics
- Wireless Gaming Mouse Statistics
- Electric Kettle Statistics
- Leaf Blower Statistics
- Zero Turn Mower Statistics
- Android TV Box Statistics
- Video Doorbells
- 360 Camera Statistics
- Portable Power Bank Statistics
- Bose Corporation Statistics
- Smartphone Sales Statistics
- Portable Printer Statistics
Tablets Lifespan Statistics By Types
 (Source: amazonaws.com)
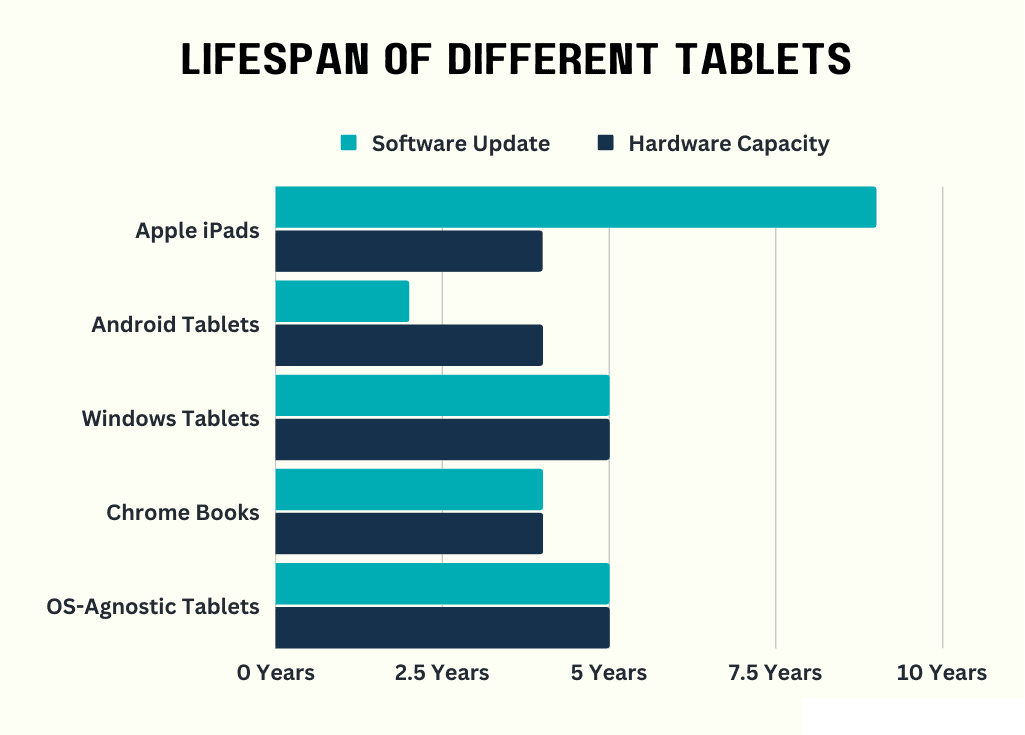
- According to Techjury, Apple iPads last the longest, with a lifespan of about five years. This is due to regular software updates and strong hardware.
- Apple provides software updates for up to 10 years, but hardware limitations typically cap usage at five years.
The table below includes other tablet types’ specifications:
| Tablet types | Life Span (years) |
Software and Hardware Capacity |
| Chrome | 4 to 5 |
4 |
|
Android |
2 to 3 | up to 5 |
| Windows | 5 |
5 |
|
OS-Agnostic |
5 |
5 |
Table Screen Resolution Statistics By Region (June 2024)
| Africa | 800×1280 (25.39%) |
800×1334 (12.81%) |
768×1024 (8.26%) |
601×962 (6.59%) |
1280×800 (4.96%) |
1334×800 (4.67%) |
| Asia | 768×1024
(22.78%) |
810×1080
(11.46%) |
820×1180
(9.73%) |
1280×800
(4.05%) |
834×1194
(3.95%) |
744×1133 (3.45%) |
| Europe | 768×1024
(23.21%) |
810×1080
(10.79%) |
1280×800
(9.36%) |
800×1280
(9.27%) |
820×1180
(4.32%) |
1334×800
(3.18%) |
| North America | 768×1024
(20.19%) |
810×1080
(12.88%) |
800×1280
(8.06%) |
1280×800
(7.6%) |
820×1180 (6.74%) |
1024×1366 (5.15%) |
| Oceania | 768×1024
(32.93%) |
810×1080
(14.53%) |
820×1180
(10.07%) |
834×1194
(6.17%) |
1024×1366
(6.04%) |
744×1133
(3.73%) |
| South America | 768×1024
(12.64%) |
800×1280
(7.88%) |
1280×800
(7.84%) |
601×962
(7.12%) |
1334×800
(5.12%) |
810×1080 (4.87%) |
By Country (June 2024)
| 768×1024 | 810×1080 | 800×1280 | 1280×800 | 820×1180 | 1024×1366 | |
| United States Of America | 19.1% | 12.27% | 8.88% | 8.33% | 6.53% | 5.53% |
| United Kingdom | 30.16% | 14.17% | 9.14% | 7.24% | 5.11% | – |
| India | 5.65% | 5.77% | 5.55% | – | – | – |
| Canada | 26.78% | 18.15% | 4.2% | 4.16% | 8.72% | 4.02% |
| Germany | 15.89% | 6.63% | 10.8% | 13.54% | 3.76% | – |
Tablets Product Development Analysis
- Apple: Introduced the seventh-generation iPad Pro in May 2024, featuring the M4 chip and OLED dis
- Samsung: Released the Galaxy Tab S10 series in October 2024, equipped with MediaTek Dimensity 9300+ processors.
- Amazon launched a new Fire HD 8 tablet in October 2024. This tablet incorporates AI-powered tools for an enhanced user experience.
- Apple: Announced a new iPad Mini powered by the A17 Pro chip, available from October 23, 2024.
Conclusion
The tablet market is growing strongly in 2024, with more people wanting devices that can do many things. Apple holds the largest share of the market, while Samsung and Lenovo are growing as well. Amazon’s affordable tablets and Huawei’s new features have also helped increase sales. Tablets are popular for work, entertainment, and learning, and shipments are rising as competition between top brands increases.
This shows that the tablet market will keep growing as more people choose them for their convenience and good performance.
Sources
FAQ.
Tablets usually cost between USD 100 and USD 1,500, depending on the brand, model, features, and storage capacity offered.
A tablet battery typically lasts between 6 to 12 hours, depending on the model, usage, and screen brightness settings.
Yes, some tablets support SIM cards, allowing users to make calls, send messages, and access mobile data for internet connectivity.
The Apple iPad Air (M2) is an excellent choice for students. It offers a balance of performance, portability, and compatibility with educational apps.
Tablets offer storage options like 16GB, 32GB, 64GB, 128GB, and even up to 1TB, with some supporting expandable memory using microSD cards.
Aruna Madrekar is an editor at Coolest Gadgets, focusing on SEO and content creation. She writes and edits engaging articles, making complex information easy to understand with charts and graphs. Aruna's work on smartphone reviews and app statistics helps Coolest Gadgets reach a wide audience with valuable insights.