Smart Home Statistics By Segment, Revenue, Device Ownership, User and Country

Updated · Mar 05, 2025


TABLE OF CONTENTS
- Introduction
- Editor’s Choice
- General Smart Home Statistics
- Smart Home Benefit Statistics
- Smart Home Revenue Statistics By Segment
- Average Revenue Statistics By Per Smart Home
- Smart Home Penetration Rate Statistics By Segment
- Smart Home User Statistics
- Revenue Comparison of Smart Home Statistics By Country
- Smart Home Shipment Statistics
- Smart Home Device Ownership Statistics
- Most Popular Smart Home Device Brands Statistics By Country
- Smart Home Demand Statistics
- Smart Home Devices Statistics that Provide Most Home Protection
- Purchasing Behavior of Smart Home Device Statistics By Gender
- Sustainable Initiatives of Smart Home Statistics
- Conclusion
Introduction
Smart Home Statistics: A smart home is a house where technology makes life easier by automating tasks. Devices like smart lights, security cameras, and voice assistants help people control their homes with just a phone tap or a voice command.
The use of smart home technology is growing fast. More people are choosing smart devices to improve security, save energy, and make daily tasks more convenient. Companies are also investing in innovations to make homes even smarter.
Statistics show that the smart home market is expanding, with millions of households using connected devices. Understanding these numbers helps us see how smart homes are shaping the future of living. This article explores key data on smart home trends and growth.
Editor’s Choice
 (Reference: explodingtopics.com)
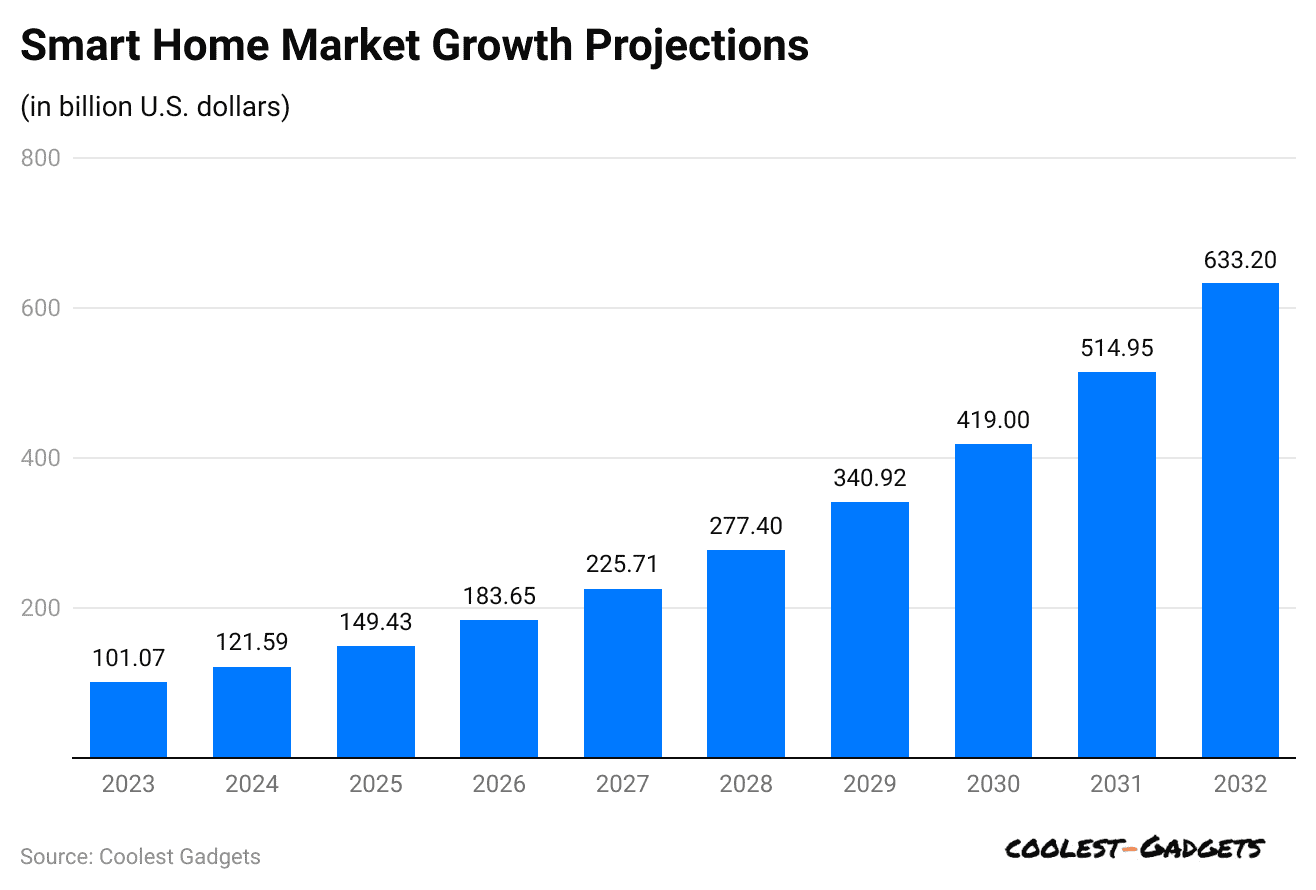
- Smart Home Statistics show that the global smart home market will grow to USD 149.43 billion by the end of 2025.
- The revenue is expected to grow at a yearly rate of 22.9% CAGR from 2023 to 2032, reaching a market size of USD 633.2 billion by 2032.
- In 2024, approximately 73.5% of households are expected to use smart home technology, and the number will reach around 90.7% by 2029.
- The expected average revenue for each installed smart home is currently around USD 62.40.
- The United States is estimated to lead in revenue generation in 2024, bringing in approximately USD 38.8 billion.
- More than 133 million homes in North America are expected to use smart home technology by the end of 2025.
- At the same time, Europe is expected to have 84 million homes equipped with smart technology.
- Smart Home Statistics further show that by 2024, people will spend around USD 158 billion on smart home systems and services globally.
- About 21% of Americans say they own at least one smart home device or more.
- The smart home market in Asia-Pacific is predicted to grow 23.5% yearly from 2021 to 2026.
You May Also Like To Read
- Smart City Statistics
- Smart Home Statistics
- Smart Rings Statistics
- Smart TV Statistics
- Smart Clothing Statistics
- Smart Glasses Statistics
- Smart Door Lock Statistics
- Smart Door Statistics
- Smart Fans Statistics
- Smart Bed Statistics
General Smart Home Statistics
- The United States has recently led the smart home market with more than 63 million homes using smart technology.
- More than 50% of U.K. homes now use a smart speaker, showing how popular voice-controlled devices have become.
- Moreover, around 68% of people worldwide feel concerned that hackers might break into their smart home devices.
- Smart thermostats help homeowners save around 23% on yearly heating and cooling bills, making homes more energy-efficient.
- About 76% of people in the U.S. now have at least one smart home device in their homes.
- Smart Home Statistics further reports that by 2027, the smart home security market is estimated to grow and reach USD 137.91 billion globally.
- Approximately 68% of people worldwide worry about hackers targeting their smart home devices for breaches.
- On average, U.S. homes with smart technology now have eight devices, compared to six before.
- In early 2024, global smart home shipments will reach 186 million, dropping 5.6% from 2023.
- By 2030, shipments of devices like Alexa, Siri, and Google Home will reach 5.5 million.
- To date, the world will have more than 400 million smart homes in use.
- Meanwhile, around 42% of homeowners choose smart home technology mainly to save energy and reduce electricity costs in their daily lives.
- Smart Home Statistics also show that the global smart home market is growing fast, with an expected yearly increase of 21% from 2021 to 2026.
- Smart home devices can help lower energy bills by as much as 30%, making homes more cost-efficient.
- In contrast, almost 46% of Americans use smart home devices for convenience, security, and energy savings.
- Artificial Intelligence in smart home security can reduce emergency response times by 30% to 60%.
Smart Home Benefit Statistics
(Source: buttercms.com)
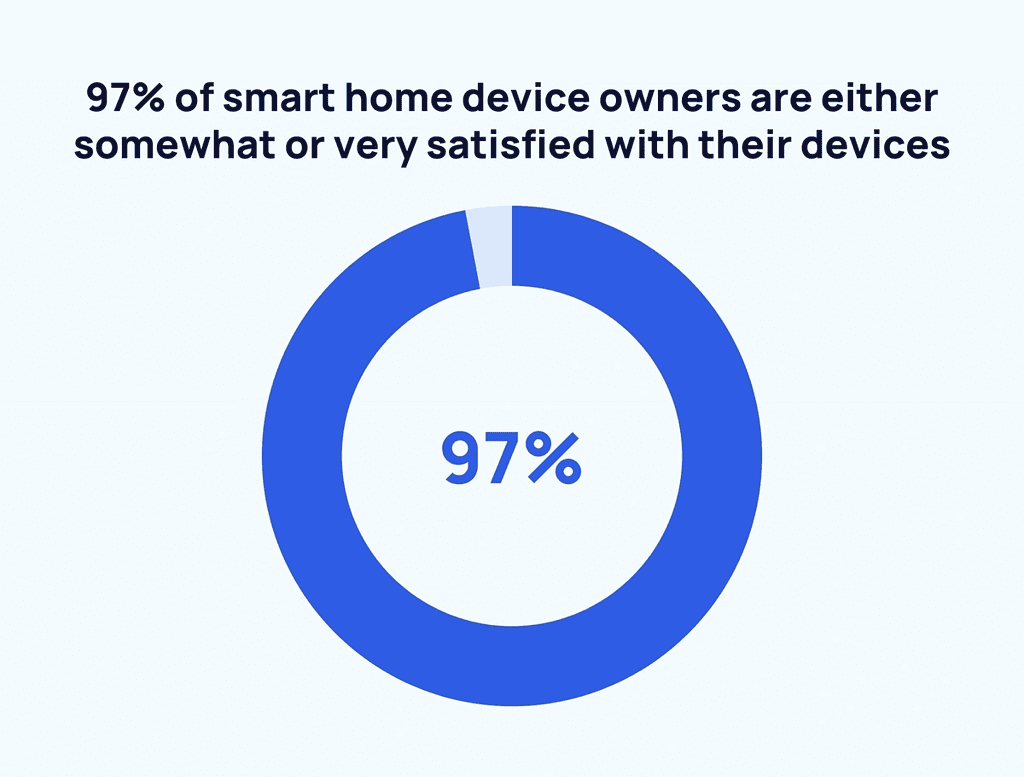
- In 2024, most people who own smart speakers, thermostats, plugs, lights, or appliances feel satisfied with how their devices work.
- Between 58% and 64% of smart device owners report being very happy and satisfied with their gadgets in general.
- Around 79% of people claimed using smart home devices has made their lives better and easier.
- Smart Home Statistics elaborates that the common benefits of smart homes are founded happiness (57%), safety (45%), and productivity (44%).
- 71% of consumers found smart home devices to be more beneficial than expected (Frontier)
- 75% of consumers found smart homes to be more beneficial than expected, as convenience was the most cited benefit (75%), followed by usefulness (62%) and time savings (49%).
Smart Home Revenue Statistics By Segment
(Reference: statista.com)
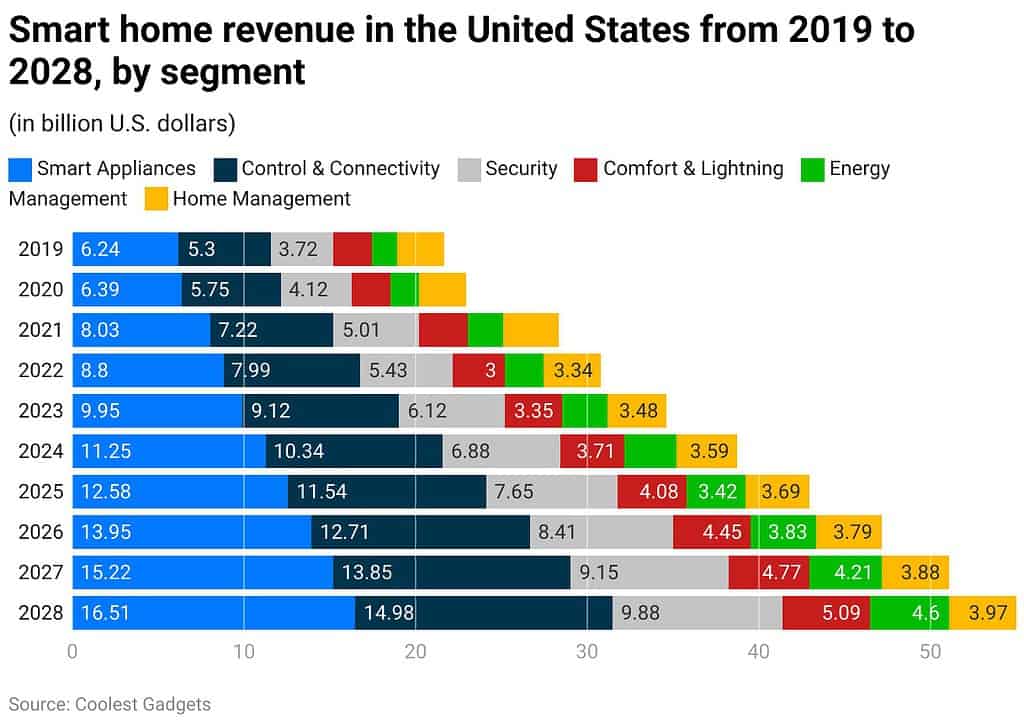
- Smart appliances lead the market, valued at USD 11.25 billion, making them the most valuable segment in 2024. They are followed by the control and connectivity segment, which has around USD 10.34 billion in revenue.
The above Statista graph-based Smart Home Statistics estimates the segmental revenue analyses from 2024 to 2028
| Segments (USD billion) | 2024 | 2025 | 2026 | 2027 | 2028 |
| Smart Appliances | 11.25 | 12.58 | 13.95 | 15.22 | 16.51 |
| Control & Connectivity | 10.34 | 11.54 | 12.71 | 13.85 | 14.98 |
| Security | 6.88 | 7.65 | 8.41 | 9.15 | 9.88 |
| Comfort & Lightning | 3.71 | 4.08 | 4.45 | 4.77 | 5.09 |
| Energy Management | 3.02 | 3.42 | 3.83 | 4.21 | 4.6 |
| Home Management | 3.59 | 3.69 | 3.79 | 3.88 | 3.97 |
Average Revenue Statistics By Per Smart Home
(Source: statista.com)
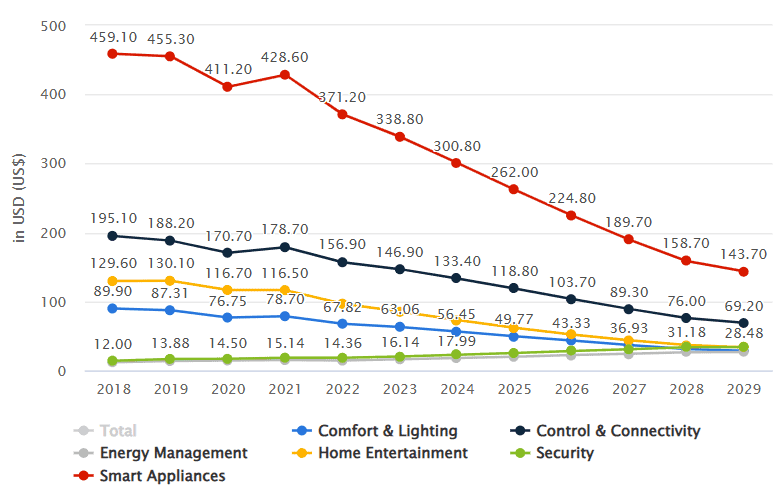
- Smart Home Statistics in 2024 show that the average revenue earned per smart home worldwide will remain highest on Smart Appliances, at USD 300.80, followed by Control and connectivity (USD 133.40).
Furthermore, other segmental revenue per smart home users in coming years are stated in the table below:
| Segments (USD) | 2024 | 2025 | 2026 | 2027 | 2028 | 2029 |
| Comfort & Lightning | 56.45 | 49.77 | 43.33 | 36.93 | 31.18 | 28.48 |
| Control & Connectivity | 133.40 | 118.80 | 103.70 | 89.30 | 76 | 69.20 |
| Energy Management | 17.99 | 20.03 | 22.30 | 24.34 | 26.52 | 26.94 |
| Home Entertainment | 73.13 | 61.96 | 52.23 | 43.87 | 36.79 | 33.57 |
| Security | 22.79 | 25.45 | 28.21 | 30.94 | 33.67 | 33.99 |
| Smart Appliances | 300.80 | 262.00 | 224.80 | 189.70 | 158.70 | 143.70 |
Smart Home Penetration Rate Statistics By Segment
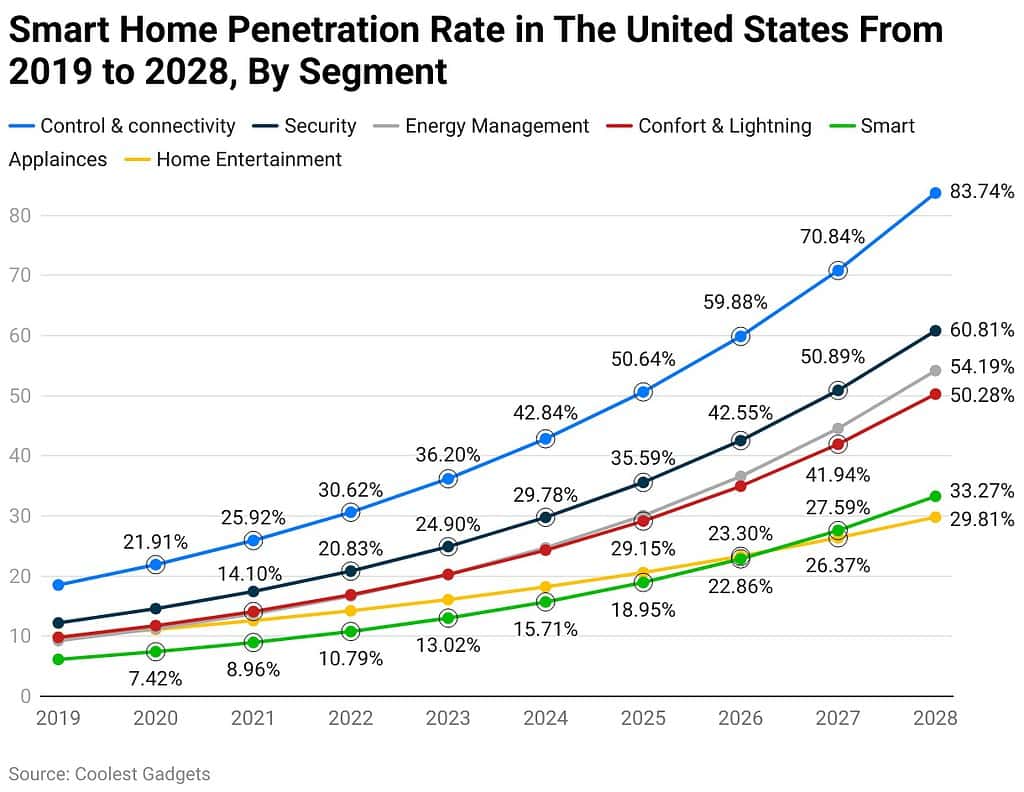
(Reference: statista.com)
| Segments | 2024 | 2025 | 2026 | 2027 | 2028 |
| Control & Connectivity | 42.84% | 50.64% | 59.88% | 70.84% | 83.74% |
| Security | 29.78% | 35.59% | 42.55% | 50.89% | 60.81% |
| Energy Management | 24.72% | 30.07% | 36.59% | 44.55% | 54.19% |
| Comfort & Lightning | 24.315 | 29.15% | 34.96% | 41.94% | 50.28% |
| Smart Appliances | 15.71% | 18.95% | 22.86% | 27.59% | 33.27% |
| Home Entertainment | 18.21% | 20.59% | 23.3% | 26.37% | 29.81% |
Smart Home User Statistics
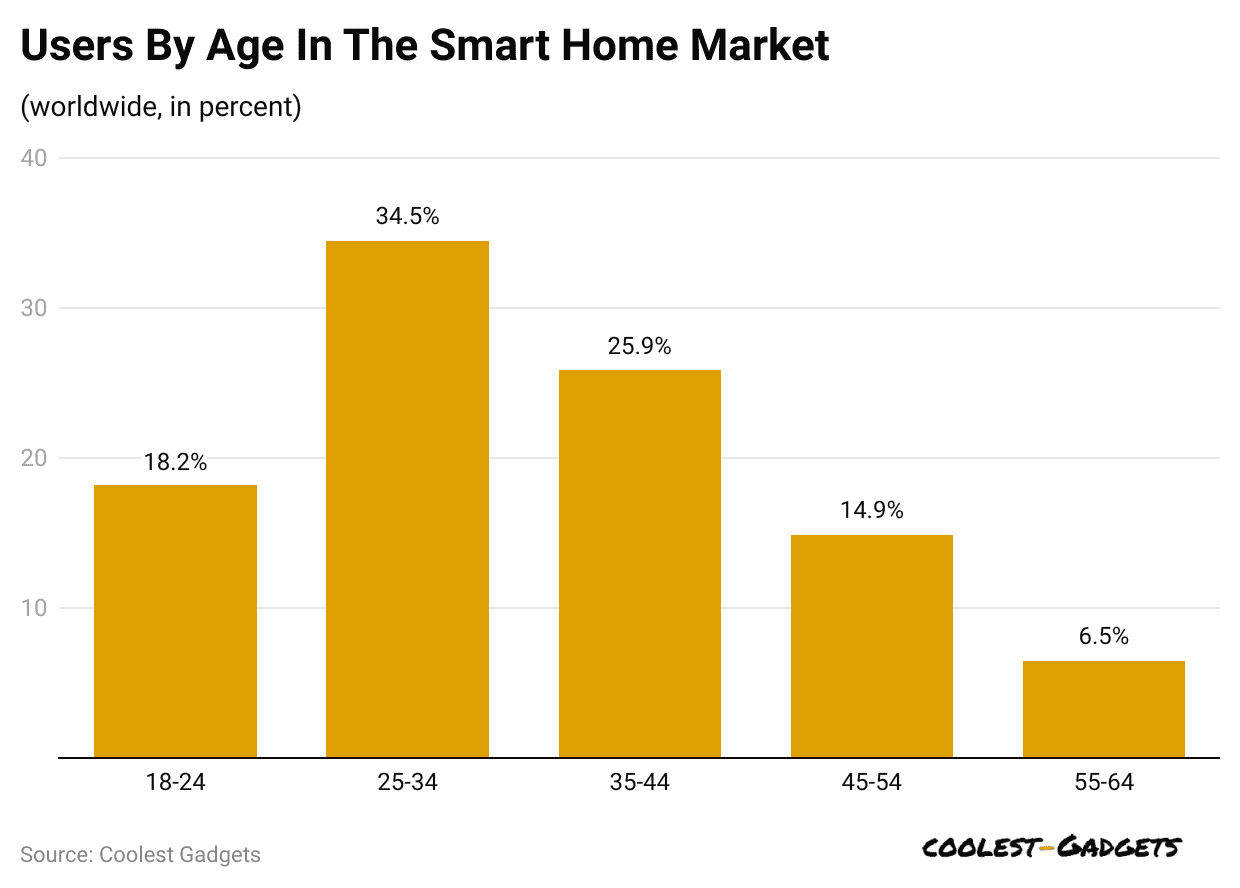 (Reference: infineon.com)
- It is estimated that around 34.5% of the global users aged from 25 to 34 years are using smart home devices.
- Meanwhile, the shares of other users of smart home devices and their age groups are 25.9% (35 to 44 years), 18.2% (18 to 24 years), 14.9% (45 to 54 years), and 6.5% (55 to 64 years).
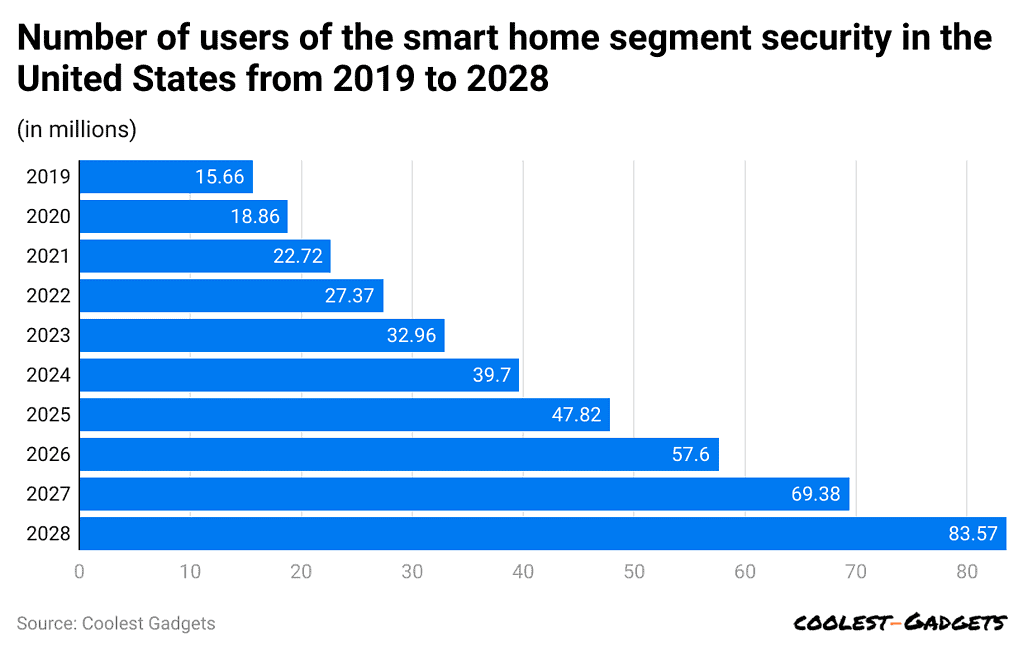
(Reference: proxy.parisjc.edu)
- The number of smart homes in the U.S. focused on security is expected to grow by 50.6 million users from 2023 to 2028, a 153.52% rise.
- In the United States, the total number of people using smart home security systems in 2024 will be around 39.7 million.
- Furthermore, in coming years, the estimated number of smart home users will be 2025 (47.82 million), 2026 (57.6 million), 2027 (69.38 million), and 2028 (83.57 million).
By Product Types
| Number of Users by Segments (Billions ) | 2024 | 2025 | 2026 | 2027 | 2028 | 2029 |
| Comfort & Lightning | 0.2 | 0.3 | 0.4 | 0.5 | 0.7 | 0.7 |
| Control & Connectivity | 0.2 | 0.3 | 0.4 | 0.5 | 0.6 | 0.7 |
| Energy Management | 0.6 | 0.6 | 0.6 | 0.6 | 0.6 | 0.6 |
| Home Entertainment | 0.2 | 0.3 | 0.3 | 0.4 | 0.5 | 0.6 |
| Security | 1.0 | 1.1 | 1.1 | 1.1 | 1.1 | 1.1 |
| Smart Appliances | 0.2 | 0.3 | 0.3 | 0.5 | 0.6 | 0.6 |
Revenue Comparison of Smart Home Statistics By Country
- The U.S. Smart Home market will reach USD 38.8 billion in 2024 and grow at a CAGR of 8.74% from 2024 to 2029, reaching around USD 59 billion by 2029.
- Smart Home Statistics also show that the expected average revenue for each installed smart home is currently around USD 167.40.
- Around 85.5% of households are expected to use smart home devices in 2024, and this number will rise to 98.7% by 2029.
As per Smart Home Statistics, the other top four countries’ market analyses in 2024 are stated in the table below:
| Country | Market Size (USD) |
CAGR (from 2024 to 2029) | Average revenue for each installed smart home device (USD) | Household share |
| China | 32.4 billion | 11.97% | 39.16 | 85.3% |
| United Kingdom | 11 billion | 11.11% | 193.70 | 83.4% |
| Japan | 9.4 billion | 13.09% | 160.90 | 69.4% |
| Germany | 8.7 billion | 8.69% | 123.00 | 73.5% |
By Region
- Smart Home Statistics further state that in 2024, the global market in the Americas will make around USD 47.4 billion in revenue.
- The annual market growth is set to reach USD 72.7 billion in 2029, with a CAGR of 8.95% from 2024 to 2027.
- The average revenue from each installed smart home is estimated to be around USD 124.20.
Meanwhile, other regional revenue analyses are segmented in the table below:
| Region | Revenue (USD) |
CAGR (2024 to 2029) | Average revenue from each installed smart home |
|
Africa |
2,397 million | 11.31% | USD 19.22 |
| Asia | 60.6 billion | 11.52% |
USD 38.26 |
|
Australia & Oceania |
4.0 billion | 8.39% | USD 210.10 |
| Caribbean | 376.4 million | 7.56% |
USD 60.27 |
|
Europe |
40.1 billion | 9.58% |
USD 109.70 |
Smart Home Shipment Statistics
- In 2025, the Far East and China will account for the largest current smart home shipment units, resulting in USD 726.7 million.
- The other regions’ shipments in 2025 are estimated to be Europe (384.9 million), North America ( 329.2 million), Latin America ( 68.8 million), and the rest of the world (260.9 million).
Previous years, shipment analysis in different regions is detailed below:
| Year | The Far East and China | Europe | North America | Latin America | Rest of World |
| 2024 | 521.8 million | 283.1 million | 250 million | 45 million |
175.8 million |
|
2023 |
375 million | 219.6 million | 192.5 million | 31 million |
121.8 million |
You May Also Like To Read
- Smart Video Doorbell Statistics
- Google Home Smart Device Statistics
- Smart Alarm Systems Statistics
- Smart Refrigerators Statistics
- Smart Bulb Statistics
- Smart Home Cameras Statistics
- Smart Kitchen Appliances Statistics
- Smart Switches Statistics
- Smart Robot Vacuum Cleaners Statistics
- Smart AC’s Statistics
- Smart Home Devices Statistics
- Smart Washing Machine Statistics
- Smart Dishwasher Statistics
Smart Home Device Ownership Statistics
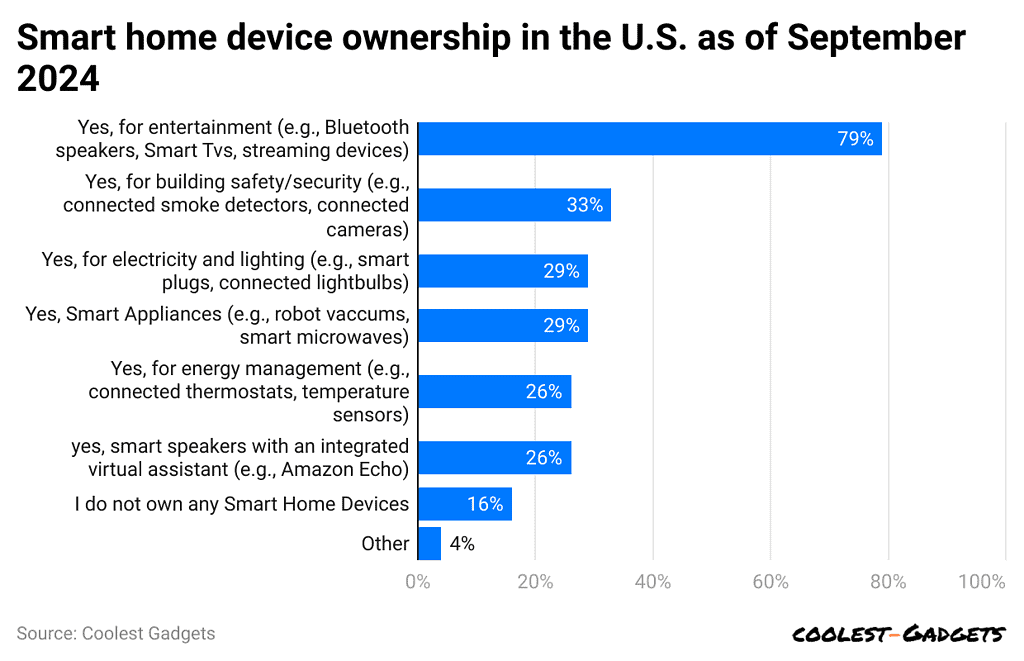
(Reference: statista.com)
- A 2024 Statista survey analyzed 10,106 U.S. consumers, and 79% said they use Bluetooth speakers, Smart TVs, and streaming devices for entertainment.
- 33% of American people said they own smart home devices for safety, like cameras or smoke detectors.
- As mentioned in Smart Home Statistics, other smart device ownership shares are 29% (for building safety and security): smart plugs and connected lightbulbs; 29% (Smart appliances): robot vacuums and smart microwaves; 26% (for energy management): connected thermostats and temperature sensors; 16% (don’t use any smart devices); and 4% (others).
Most Popular Smart Home Device Brands Statistics By Country
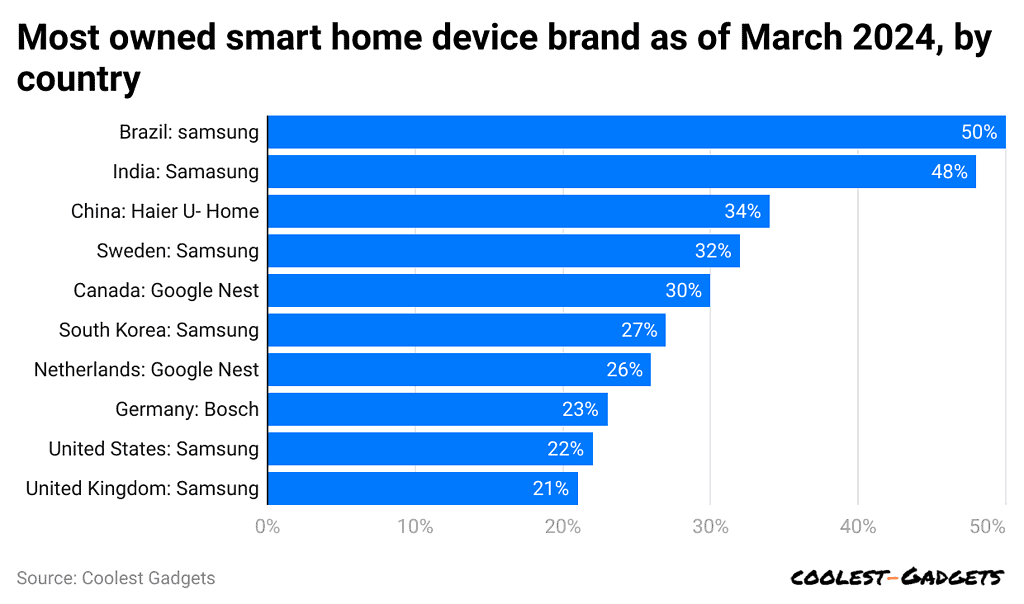
(Reference: statista.com)
- The above Statista graph analyses show that Samsung was Brazil’s most-owned smart home device brand, with a share of 50%, followed by India: Samsung (48%).
- As per Samart Home Statistics, other countries smart home brand share were represented by China: Haier U-home (34%), Sweden: Samsung (32%), Canada: Google Nest (30%), South Korea: Samsung (27%), Netherlands: Google Nest (26%), Germany: Bosch (23%), United States: Samsung (22%), and United Kingdom: Samsung (21%).
Smart Home Demand Statistics
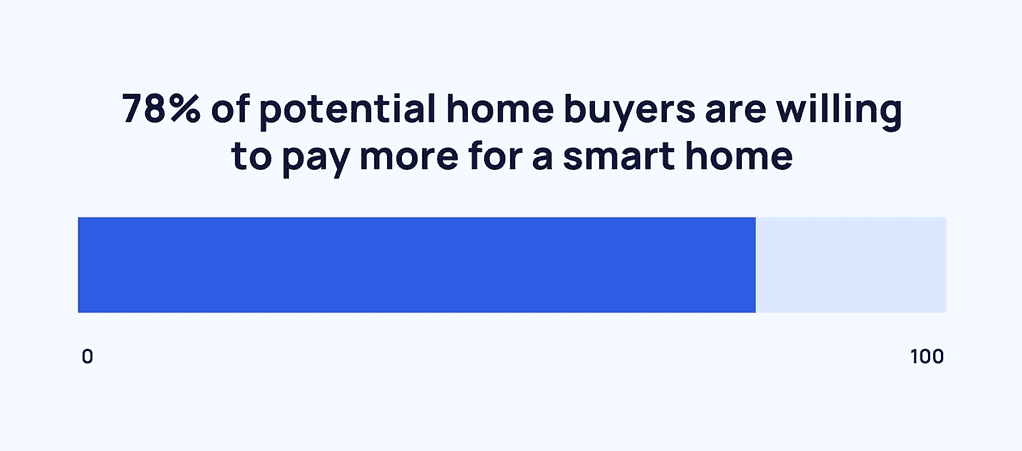
(Source: buttercms.com)
- Smart Home Statistics show that about 78% of people looking to buy a home are ready to spend extra for a smart home.
- Around 70% of people buying homes are specifically searching for properties with smart home features.
- As of 2024, most renters (82%) want smart devices at home, with 35% saying they are “important” or “extremely important” to have.
- The most popular smart home technologies are voice control (50%), smart appliances (41%), and smart lights (36%) among users.
- Nearly 46% of consumers choose smart home technology because it makes their daily tasks easier and more convenient.
- Approximately 57% of people who don’t use smart homes believe they don’t need these technologies in their daily lives.
Smart Home Devices Statistics that Provide Most Home Protection
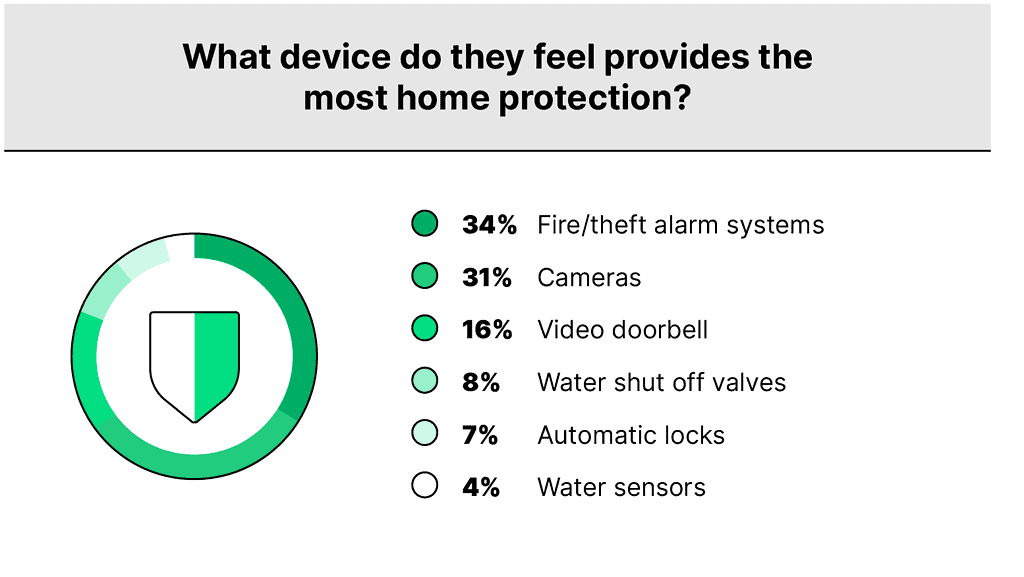
(Source: hippo.com)
- In 2024, fire/theft alarm systems (34%) were the most used smart home device that provides the most home protection.
- Others are followed by cameras (31%), video doorbells (16%), water shut-off valves (7%), and water sensors (4%).
Purchasing Behavior of Smart Home Device Statistics By Gender
- Smart Home Statistics also report that men tend to use smart home devices to save on utility bills more often than women, with 17% versus 13%.
- Similarly, more women (19%) than men (13%) prefer using smart home devices because they provide extra security and peace of mind.
- Men and women aged 35 to 54 believe cameras are the best way to protect homes, with 36% agreeing.
- About 14% of women aged 25 to 34 believe automatic locks are the most protective device in a smart home system.
Sustainable Initiatives of Smart Home Statistics
- Smart Thermostats: Devices like Nest and Ecobee adjust heating and cooling based on occupancy patterns, reducing energy consumption by up to 23%.
(Wikipedia)
- Energy-Efficient Lighting: Smart lighting systems utilize LED bulbs and automation to minimize electricity use, enhancing home energy efficiency.
(Unsustainable Magazine)
- Home Energy Monitors: These devices provide real-time feedback on energy usage, enabling homeowners to identify and reduce unnecessary consumption.
(Wikipedia)
- Integration of Renewable Energy: Smart homes incorporate solar panels and battery storage, optimizing the use of renewable energy sources and reducing reliance on fossil fuels.
(The Times)
- Automated Energy Management Systems: These systems coordinate various smart devices to optimize energy use, leading to significant reductions in household energy consumption.
(Oxford Academic)
Conclusion
Smart homes are changing the way people live by making daily tasks easier and more convenient. With smart devices, homeowners can control lights, security systems, and appliances using their phones or voice commands. These technologies also help save energy and improve safety. As smart home technology advances enormously, more people will enjoy a comfortable and connected lifestyle in the coming years. While there are concerns about privacy and cost, the benefits of smart homes make them a popular choice. In the future, smarter and more advanced features will continue to shape modern homes, making life even easier and more efficient.
FAQ.
A smart home uses connected devices like lights, cameras, and thermostats controlled by apps or voice commands for convenience and automation.
Smart homes are convenient, but security concerns remain. Hackers can target devices, so strong passwords and regular updates are important.
Setting up a smart home costs USD 1,000 to 5,000, depending on devices, installation, and the home’s size.
Yes, you can install many smart home devices yourself. Most come with instructions and are easy to set up.
The future of smart homes includes advanced automation, improved energy efficiency, stronger security features, and seamless integration with everyday devices.
Barry Elad is a tech enthusiast passionate about exploring various technology topics. He collects key statistics and facts to make tech easier to understand. Barry focuses on software and its benefits for everyday life. In his free time, he enjoys creating healthy recipes, practicing yoga, meditating, and walking in nature with his child. Barry's mission is to simplify complex tech information for everyone.