Fitness Trackers Statistics By Market Size, Types, Usage, Apps and Brands

Updated · Mar 05, 2025


TABLE OF CONTENTS
Introduction
Fitness Trackers Statistics: Fitness tracker have become very popular as more people focus on health and wellness. These devices help users track steps, monitor heart rate, measure sleep quality, and count calories. Many fitness trackers also connect to smartphones to provide detailed health reports. Over the years, the demand for fitness trackers has grown as people become more interested in staying active and improving their lifestyles. Companies are also adding advanced features like blood oxygen monitoring and stress tracking.
In this article, we will explore key statistics about the fitness tracker market, including sales growth, market trends, and user preferences. These insights will help us understand how fitness trackers are changing the way people monitor their health.
Editor’s Choice
- The global fitness tracker market is expected to reach USD 62.03 billion in 2024, with projections to grow to USD 290.85 billion by 2032.
- The market is anticipated to grow at a CAGR of 21.3% from 2024 to 2032.
- In the U.S., the fitness tracker market generated USD 18.76 billion in revenue in 2024 and is projected to reach USD 48.28 billion by 2030, reflecting a CAGR of 17.2% from 2025 to 2030.
- User penetration is expected to be 21.00% in 2025 and is projected to reach 26.40% by 2029.
- The ARPU in the fitness tracker market is expected to amount to USD 167.98.
- The number of users in the ‘Smart bands’ segment of the digital health market is forecasted to reach 524.93 million by 2029, marking a 31.85% increase from 2024.
- Fitness apps were downloaded 858 million times in 2023, a slight decrease from the 893 million downloads in 2022.
- The number of smartwatch users globally is expected to reach 454.69 million in 2024 and 562.86 million by 2025.
- The global fitness tracker market is projected to reach USD 187.20 billion by 2032, growing from USD 39.5 billion in 2022.
- The market is expected to expand at a CAGR of 17.3% from 2023 to 2032.
- According to Market.us, the global fitness tracker market is projected to reach USD 187.20 billion by 2032, growing from USD 39.5 billion in 2022.
- The market is expected to expand at a CAGR of 17.3% from 2023 to 2032.
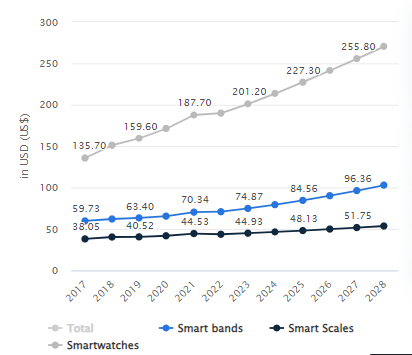
- As the fitness trackers market is segmented into 3 parts, by the end of 2023, the average revenue per user in smartwatches (USD 201.20), Smart bands (USD 74.87), and smart scales (USD 44.93).
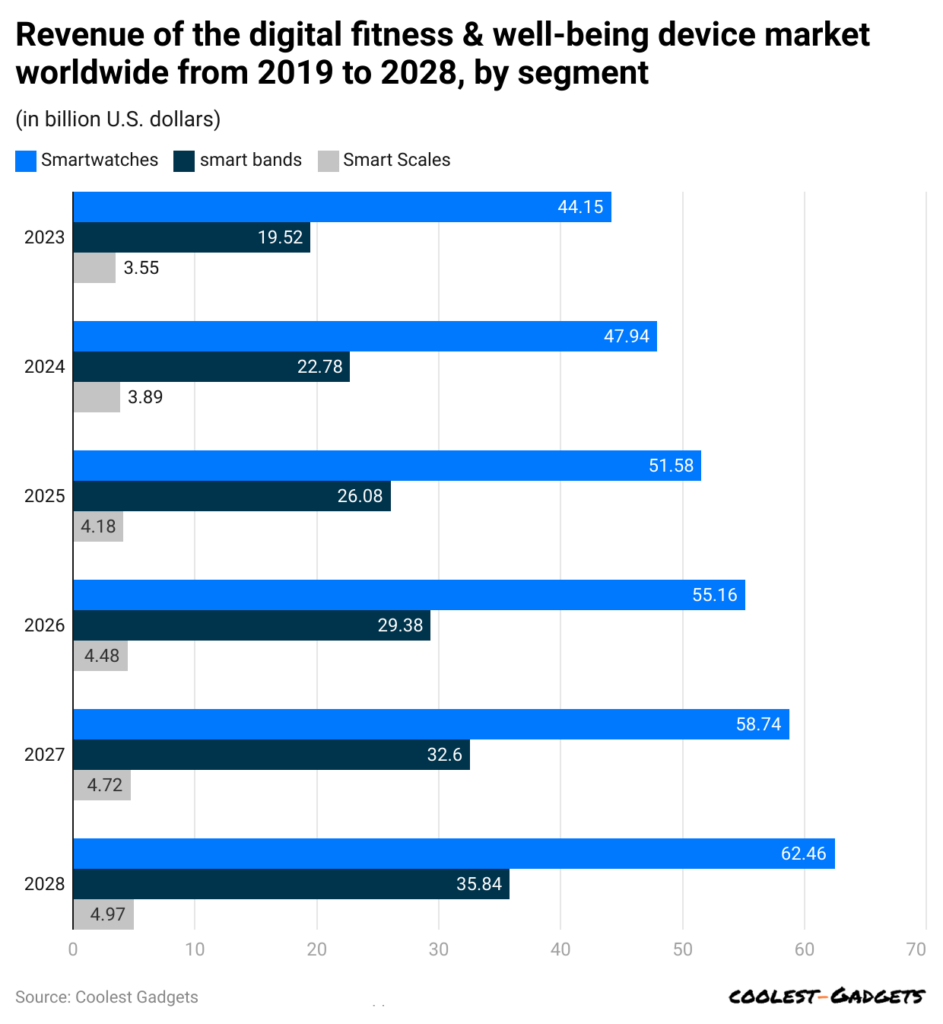
- In 2023, revenue was earned from Smartwatches (USD 44.15 billion), Smart bands (USD 19.52 billion), and Smart scales (USD 3.55 billion).
You May Also Like To Read
- Cameras Statistics
- Fitness Trackers Statistics
- Tablets Statistics
- Drones Statistics
- Foldable Smartphone Statistics
- Sleep Tracker Statistics
- Tablet Statistics
- Smart Home Statistics
- Dashboard Camera Statistics
What is a Fitness Tracker?
The fitness tracker is an electronic device that is enabled with various sensors and batteries, which help in tracking orientation, movement, and trails of various, heal-related activities.
Some of the best fitness trackers in 2023 and their prices worldwide include:
- Amazfit GTR 4 – USD 200
- Garmin Venu Sq 2 – USD 250
- Garmin Fenix 7S Pro – USD 600
- Oura Ring Gen 3 – USD 299
- Amazfit Band 7 – USD 45
- Garmin Vivomove Sport – USD 180
- Apple Watch Series 9 – USD 329
- Samsung Galaxy Watch 6 – USD 228
- Google Pixel Watch 2 – USD 350
- Whoop 4.0 – USD 30
General Fitness Tracker Statistics
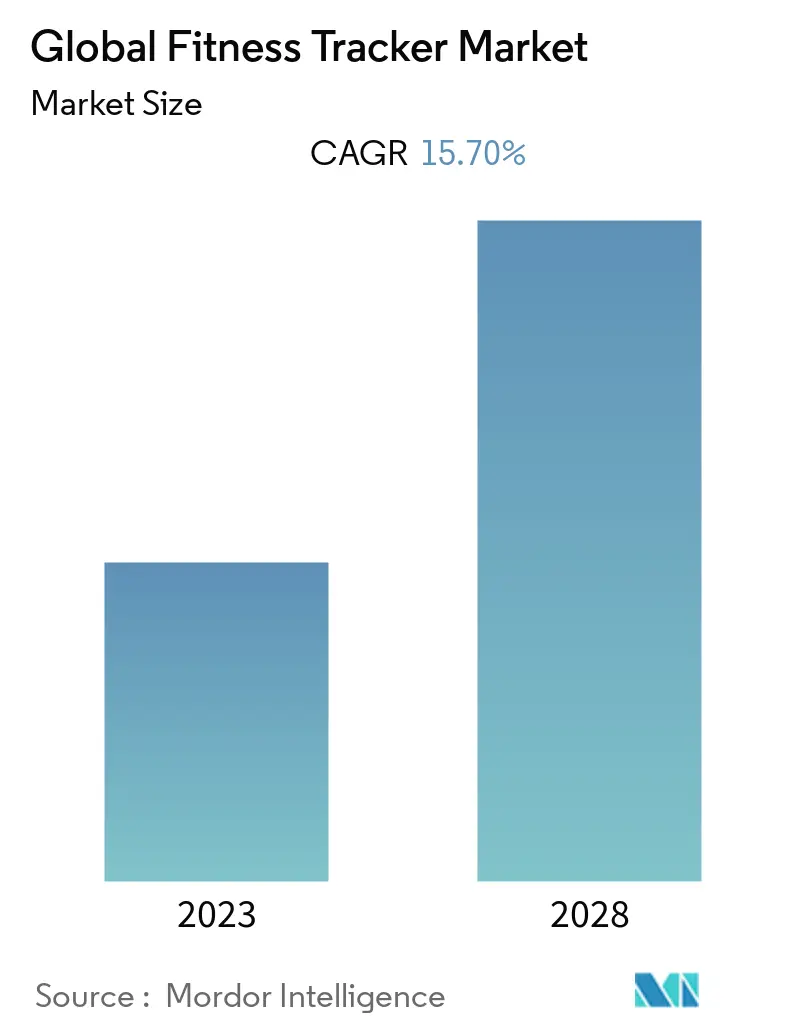
(Source: mordorintelligence.com)
- Fortune Business Insights reports that the global fitness tracker market will reach USD 53.94 billion by the end of 2023.
- The market is expected to grow at an annual rate of 15.70% from 2023 to 2028.
- Precedence Research research analysis shows that the market size is estimated to be USD 56.1 billion in 2023 and may expand to USD 258.48 billion by 2032.
- Leading companies in the fitness tracker industry include Apple Inc., Fitbit Inc., Garmin Ltd., and Xiaomi.
- A report published by Statista stated that the global revenue earned by fitness or activity-tracking wristwearables has reached USD 19.3 billion, and shipment units will total 305 million.
- Reports in the global fitness tracker market, the largest share was achieved by the North American region with a CAGR of 15.5% from 2023 to 2031.
- Revenue earned by fitness wristbands and smartwatches is supposed to grow by more than USD 63 billion by the end of 2023.
By Market Size
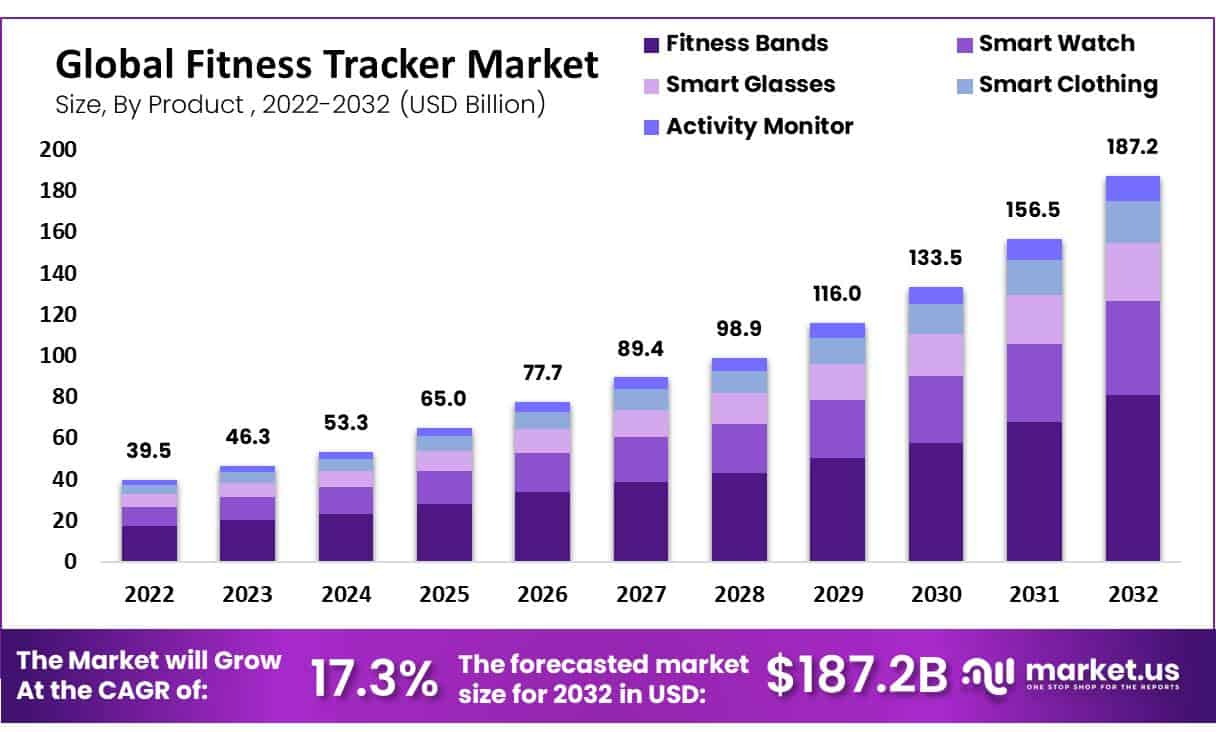
(Source: market.us)
- The analysis shows that fitness bands, smart glasses, activity monitors, smartwatches, and smart clothing generated the most revenue in the global fitness tracker market, which is valued at USD 46.3 billion in 2023.
- The market growth of the global fitness tracker industry is expected to reach a higher level in 2024 (USD 3 billion), 2025 (USD 65 billion), 2026 (USD 77.7 billion), 2027 (USD 89.4 billion), 2028 (USD 98.9 billion), 2029 (USD 116 billion), 2030 (USD 135.5 billion), 2031 (USD 156.5 billion), and 2032 (USD 187.2 billion).
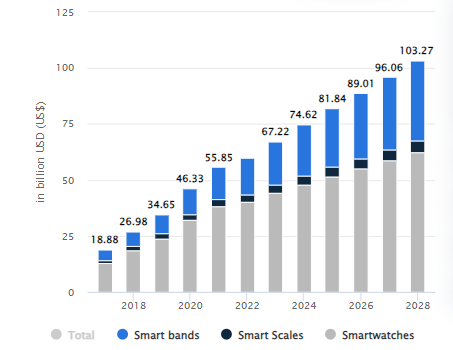
(Source: statista.com)
- The market is divided into three segments: smart bands, smart scales, and smartwatches.
- Thus, the global revenue earned by the smart fitness trackers market is expected to reach USD 22 billion in 2023.
- Furthermore, in the coming year, the market’s revenue rates are supposed to grow more, followed by 2024 (USD 62 billion), 2025 (USD 81.84 billion), 2026 (USD 89.01 billion), 2027 (USD 96.06 billion), and 2028 (USD 103.27 billion).
Revenue By Types
(Reference: statista.com)
- Based on Statista reports, the fitness tracker market is segmented into 3 different segments: smart bands, smart scales, and smartwatches.
- In 2024, the wearable technology market has observed substantial revenue generation with Smartwatches leading at USD 47.94 billion, followed by Smart bands at USD 22.78 billion, and Smart scales at USD 3.89 billion.
- By 2025, the fitness tracker market is expected to keep growing. Smartwatches will likely bring in USD 51.58 billion, smart bands are projected to reach USD 26.08 billion, and smart scales may generate USD 4.18 billion.
- The growth is expected to continue in 2026, with smartwatch revenue increasing to USD 55.16 billion, smart bands reaching USD 29.38 billion, and smart scales contributing USD 4.48 billion.
- The market is forecasted to expand further by 2027, with smartwatches generating USD 58.74 billion, smart bands reaching USD 32.6 billion, and smart scales growing to USD 4.72 billion.
- The fitness tracker market is predicted to generate USD 62.46 billion by 2028, while smart bands are estimated to bring in USD 35.84 billion.
You May Also Like To Read
- Smart Video Doorbell Statistics
- Wireless Gaming Mouse Statistics
- Electric Kettle Statistics
- Leaf Blower Statistics
- Zero Turn Mower Statistics
- Android TV Box Statistics
- Video Doorbells – The Future of Home Security and Convenience Introduction
- 360 Camera Statistics
- Portable Power Bank Statistics
- Bose Corporation Statistics
- Smartphone Sales Statistics
- Portable Printer Statistics
By Average Revenue Per User
(Source: statista.com)
- As the fitness trackers market is segmented into 3 parts, thus by the end of 2023 average revenue per user in smartwatches (USD 201.20), Smart bands (USD 74.87), and smart scales (USD 44.93).
- In 2025, the average revenue per user will be USD 227.30 for smartwatches, USD 84.56 for smart bands, and USD 48.13 for smart scales.
- The average revenue per user for smartwatches is predicted to increase to USD 255.80 by 2027, USD 96.36 for smart bands, and USD 51.75 for smart scales.
By Country-Wise Revenue
- In 2023, China earned the highest revenue in the fitness tracker market, generating nearly USD 23.15 billion.
- This amount is expected to grow to USD 38.38 billion by the end of 2028, with an annual growth rate (CAGR) of 10.64% from 2023 to 2028.
- Other top countries in 2023 based on revenue include the United States with USD 16.14 billion, India at USD 5.32 billion, Japan with USD 1.41 billion, and the United Kingdom at USD 1.38 billion.
- Several other countries also earned significant revenue from fitness tracker sales. France recorded USD 21.23 billion, while Germany earned USD 1.26 billion.
- In South America, Brazil generated USD 634.30 million, Mexico reached USD 576.10 million, Canada earned USD 668.30 million, and Australia recorded USD 525.40 million.
- Other notable earnings include Russia (USD 814.30 million), Italy (USD 916.50 million), Switzerland (USD 403.40 million), and Turkey (USD 492.50 million). In Southeast Asia, Indonesia (USD 522.70 million), Malaysia (USD 148.10 million), Thailand (USD 193.20 million), and Vietnam also contributed to the market. Smaller markets, such as Kenya (USD 25.30 million) and Zimbabwe (USD 65.48 million), also saw growth in fitness tracker sales.
By Region
Fitness Trackers Statistics show that the North American region holds the largest market share, accounting for 45.3% in 2024, resulting in USD 28.08 billion in revenue.
Other regions’ revenue and market share of the Fitness Trackers industry are stated in the table below:
| Region | Revenue (USD billion) |
Market Share |
| Europe | 15.50 |
25% |
|
Asia-Pacific |
14.88 | 24% |
| Latin America | 2.48 |
4% |
|
Middle East & Africa |
1.86 |
3% |
By Segmentation
- The running segment is expected to grow the most, with a 16.3% annual growth rate (CAGR) from 2023 to 2031.
- In terms of sales channels, offline stores will have the biggest market share, growing at 16.5% CAGR during this period.
- Among different device types, smartwatches will contribute the most, with a 16.6% CAGR.
- The hardware sector will be the largest part of the market, growing at 16.9% CAGR.
- In connectivity, Bluetooth will dominate, with an estimated growth rate of 17.1% CAGR.
By Demographics
(Source: ncbi.nlm.nih.gov)
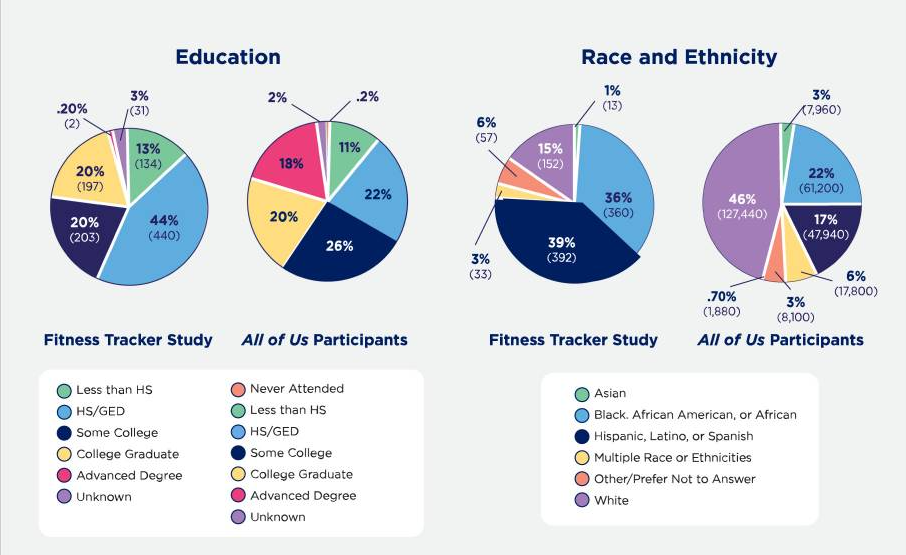
- A survey by the United States National Center for Biotechnology Information shows that by race and ethnicity, Hispanic users make up 39%, followed by non-Hispanic Black or African American users (36%) and non-Hispanic White Americans (15%).
- In terms of education, high school graduates have the highest usage at 44%, followed by two-year and four-year college graduates (20% each), and those with less than a 9th-grade education (13%).
- The largest age group is 45-55 (21%), followed by 26-35 (20%) and 36-46 (20%).
- By gender, women (71%) use fitness trackers more than men (25%). Minorities and others make up 2% each.
U.S. Fitness Tracker Statistics
- Around 21% of Americans have used fitness trackers in recent years.
- 11% of the population uses Apple Watch, followed by Fitbit (6%), Garmin (10%), and others (4%).
- Around 58% of fitness tracker users use them to track steps (27%), get more exercise (16%), and continuously analyse heart rate (14%).
(Source: nitrocdn.com)
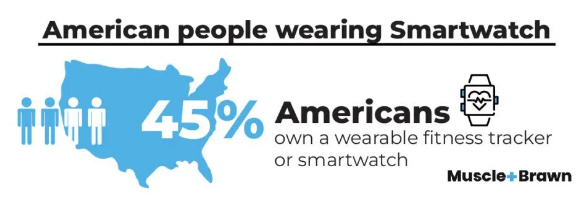
- In 2023, nearly 45% of Americans used wearable fitness trackers or smartwatches.
- Among them, 20% preferred Apple fitness trackers, while 16% chose Fitbit.
- Around 58% of people earning between USD 75,000 and USD 90,000 owned a fitness tracker.
- In the United States, fitness tracker users included 70% of Gen Z, 57% of Millennials, and 51% of women.
- The main reasons for using fitness trackers were stress management (30%), tracking exercise routines (27%), monitoring nutrition and diet (26%), and counting daily steps (24%).
By Brands
- As of the third quarter of 2024, several key brands led the global smartwatch market, each holding significant shares, including Apple (21%), Huawei (14%), Samsung (11%), and others (54%).
- In the United States, the usage of smartwatches and eHealth trackers by brand as of September 2024 is as follows: Apple (56%), Fitbit (24%), and other brands (20%).
 (Reference: sammyfans.com)
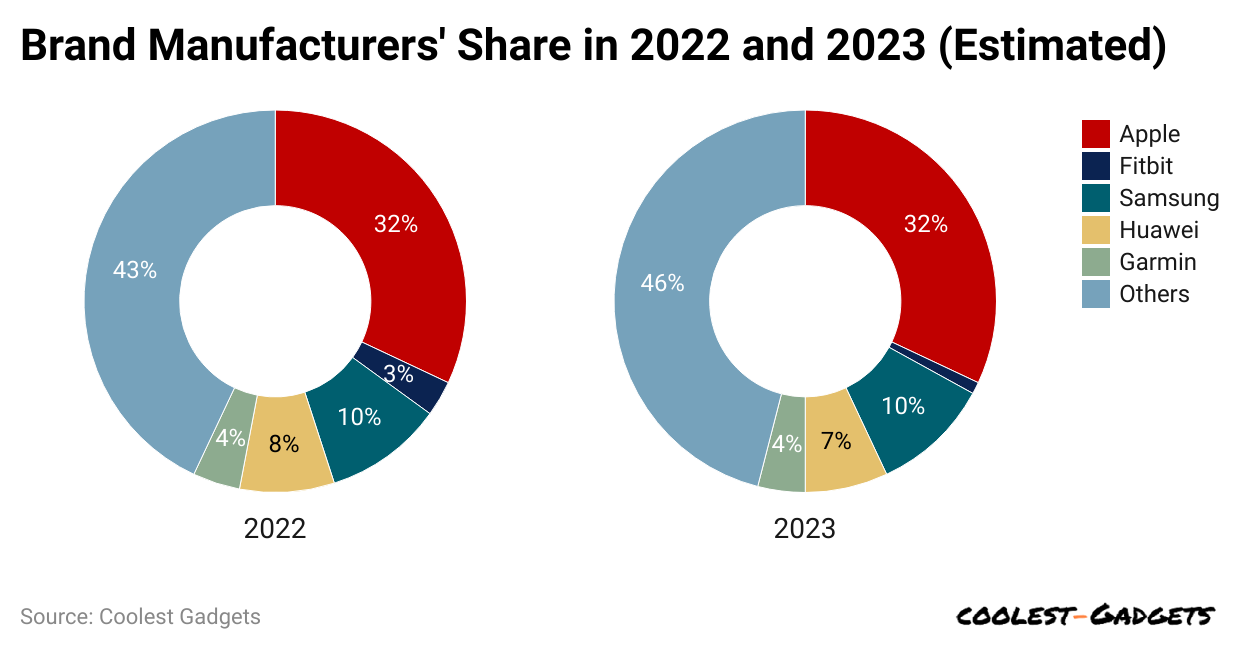
- As of 2023 reports, the global market of Apple fitness tracker is expected to be 32% of the share.
- Based on the analysis, the market share of leading fitness tracker manufacturers is as follows: Samsung holds 10%, Huawei has 7%, Garmin owns 4%, and Fitbit accounts for 1%.
- Other brands share the remaining 46% of the market.
Indian Fitness Trackers Statistics
- The market share of leading fitness tracker brands shows Samsung holds 10%, followed by Huawei at 7%, Garmin at 4%, and Fitbit at just 1%.
- Other brands share the remaining 46% of the market.
By Apps
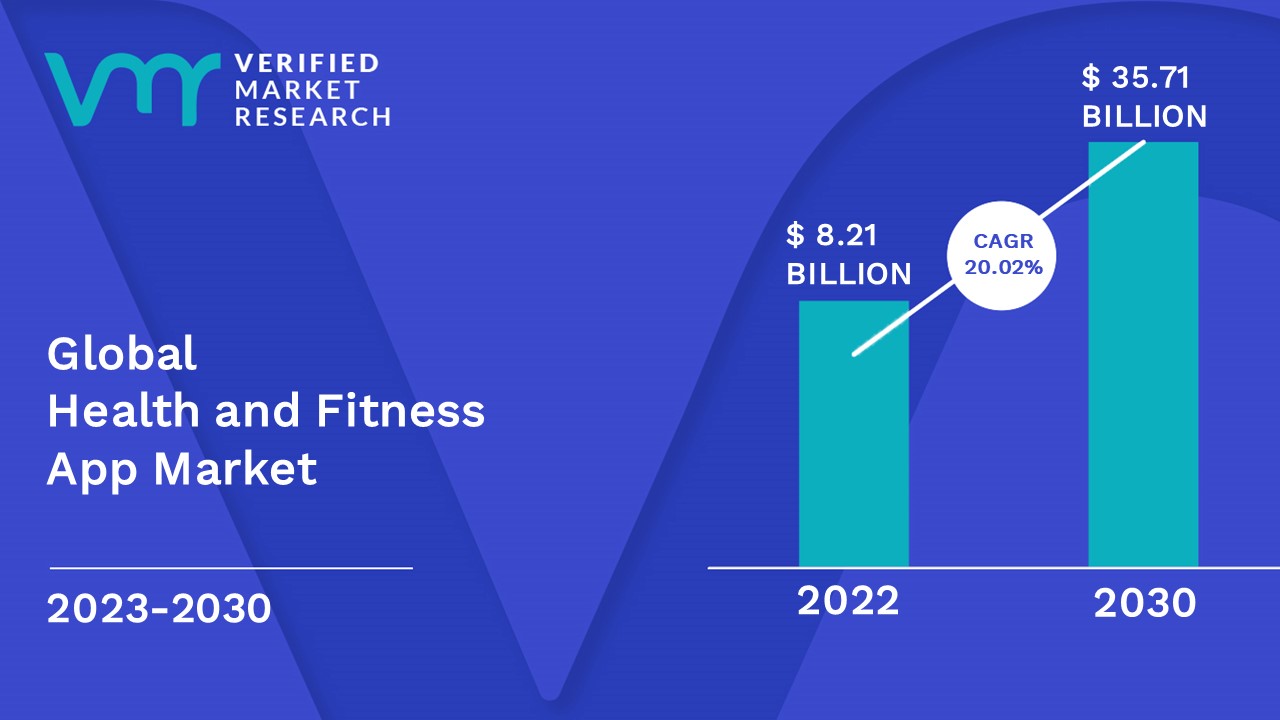
(Source: verifiedmarketresearch.com)
- The global health and fitness app market is expected to grow to USD 35.71 billion by 2030, with an annual growth rate of 20.02% from 2022 to 2030.
- A 2023 report shows that 81% of people worldwide use fitness tracker apps on wearable devices and smartphones.
- By 2023, the fitness tracker app industry is valued at USD 19.3 billion and is predicted to reach USD 33.04 billion by the end of 2027.
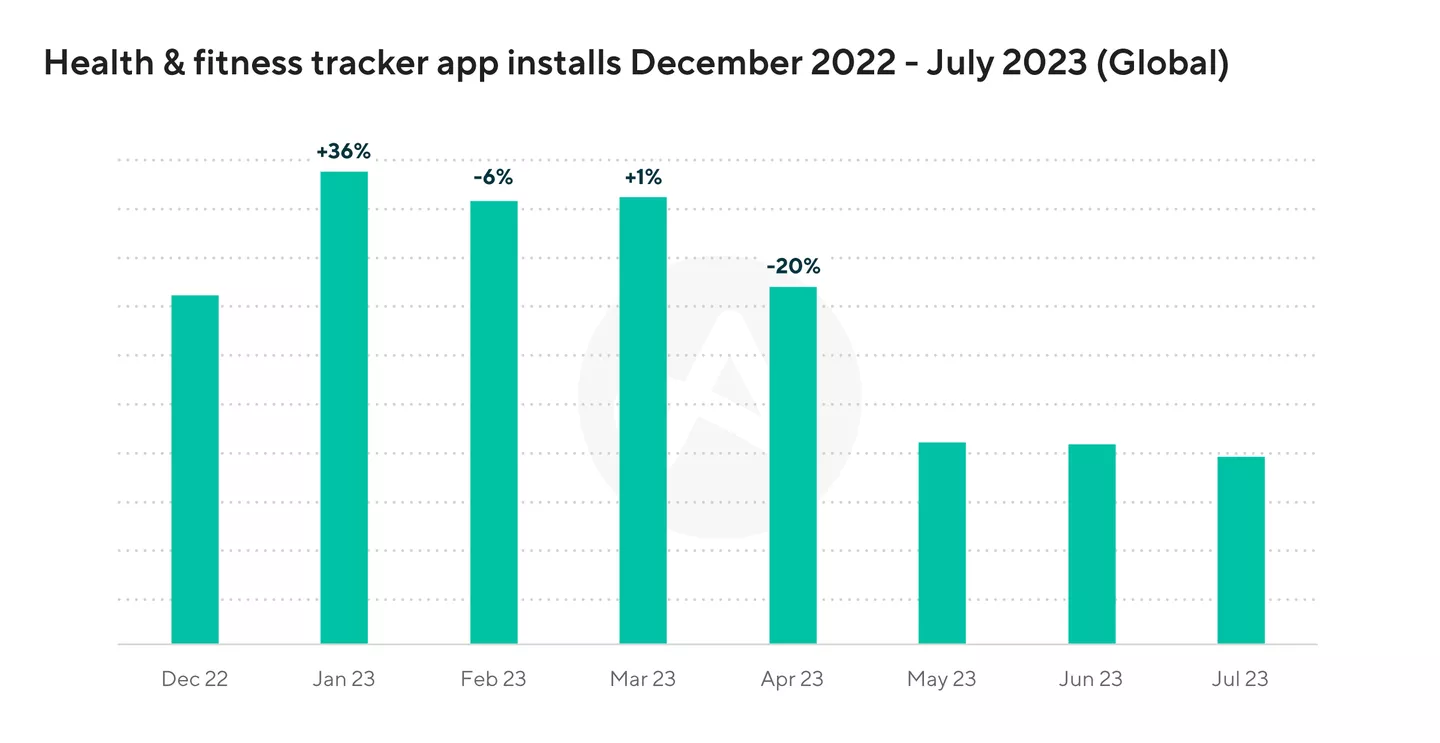
(Source: storyblok.com)
- The number of health and fitness tracker app downloads worldwide increased by 36% in January 2023 compared to December 2022.
- However, the trend changed in the following months. February saw a 6% decrease, while March saw a 1% increase.
- By April, downloads had dropped by 20%.
By Shipments
- According to Volza’s Global Reports 2023, the total import and export shipments of fitness trackers worldwide reached 2,200 units.
- The top importers of fitness trackers are India (1,069 shipments), the United States (210 shipments), and Bangladesh (145 shipments).
- The most imported product categories include HSN Code 85176290, HSN Code 90318000, and HSN Code 90291090.
- China (1,260 shipments), the United States (410 shipments), and India (138 shipments) are the leading exporters of fitness trackers.
- The most exported product categories are HSN Code 85176290, HSN Code 90291090, and HSN Code 90318000.
- In 2023, there were 538 buyers in 45 countries and 421 suppliers in 32 countries.
- India (108), the United States (58), and the Philippines (50) were the top country buyers.
- The top country suppliers were India (1,059), the United States (207), and Bangladesh (124).
Recent Developments
Product Launches
- In February 2024, Zepp Health’s Amazfit launched the Amazfit Active Smartwatch, designed for advanced health tracking. The smartwatch provides personalised health advice using data from heart rate, stress levels, sleep, and other health indicators.
- In September 2023, Google introduced the Fitbit Charge 6, a next-generation fitness tracker. It uses AI and machine learning to improve heart rate accuracy and offers new exercise modes for a better experience.
- In January 2023, Garmin Ltd. released the Garmin ECG App for its Venu 2 Plus smartwatch. The FDA-approved app helps users check their heart rhythm and detect atrial fibrillation.
Strategic Acquisitions
- Google’s purchase of Fitbit still impacts the market. As a result, Fitbit has introduced new products like the Charge 6, which uses Google’s AI technology to offer advanced features and improvements.
Technological Innovations
- In May 2023, Apple launched Quartz, an AI-powered health coaching service that will offer personalized wellness support in future Apple Watch and iPhone models.
Conclusion
Fitness trackers have changed how people monitor their health. These devices help users track steps, heart rate, sleep, and overall activity. As more people focus on health and fitness, the demand for fitness trackers keeps growing. Companies are adding new features like stress tracking and blood oxygen monitoring to improve user experience.
With advanced technology, fitness trackers are becoming more accurate and useful. In the future, these devices will continue to play a big role in helping people live healthier lives
Sources
Joseph D'Souza started Coolest Gadgets in 2005 to share his love for tech gadgets. It has since become a popular tech blog, famous for detailed gadget's reviews and companies statistics. Joseph is committed to providing clear, well-researched content, making tech easy to understand for everyone. Coolest Gadgets is a trusted source for tech news, loved by both tech fans and beginners.