Drones Statistics By Revenue, Market Size, Usage and Manufacturers

Updated · Mar 10, 2025


TABLE OF CONTENTS
- Introduction
- Editor’s Choice
- Let’s Understand About Drones!
- Advantages and Disadvantages of Drones
- Facts About Drones
- General Drones Statistics
- Drone Market Size By Market.us
- By Country-Wise Revenue Comparison
- By Regional Analysis
- By Top Manufacturers
- By Usage Share
- By Industry
- By User Share
- By Ownership
- Drone Injury Statistics
- Drone Incident Statistics
- Reasons for Adopting Drones
- Drone Incidents Statistics
- Commercial Drones Statistics
- By Earning
- Drones Efficiency Statistics
- Drone US Demographics Statistics
- Drone Revenue and Cost Statistics
- Drones FAA Statistics
- US Drone Service Provider’s Income
- Drone Insurance Statistics
- Best Drones to Take Photos and Video in 2024
- Drones Website Traffic Statistics
- Conclusion
Introduction
Drones Statistics: In recent years, the drone industry has gained considerable popularity across various consumer and industrial sectors worldwide. Advanced technological developments, including artificial intelligence and machine learning, increased consumer demands, and higher adoption rates, are some of the main factors responsible for the rapid growth of the drone market in recent times.
If you are interested in gaining an in-depth understanding of the drone industry and its various segments, then the Drones Statistics will be helpful for you.
Editor’s Choice
- The global drone market is projected to reach approximately USD 101.1 billion by 2033, growing from USD 34.5 billion in 2023.
- This reflects a CAGR of 12.7% from 2024 to 2033.
- In 2023, the Rotary Wing Drone segment dominated the market, capturing over 62.3% of the market share due to their versatility and widespread use in various applications.
- The Military segment held a significant position in the drone market in 2023, representing more than 48.8% of the total market share, driven by increasing adoption in defense strategies.
- The Asia-Pacific (APAC) region led the drone market in 2023, accounting for over 40.2% of the market with revenues reaching USD 13.4 billion.
- As of 2024, the Federal Aviation Administration (FAA) in the United States registered 855,860 drones, with 96% of these owned by men and only 4% by women.
- By 2025, the drone industry is expected to create 103,776 jobs in the United States, highlighting its growing economic impact.
- The drone services market is set to reach USD 63.6 billion globally by 2025, reflecting the expanding use of drones in various sectors.
- The drone delivery service market, valued at USD 426.1 million in 2023, is expected to soar to over USD 7,217.4 million by 2033.
- By the end of 2023, drones worldwide recorded a total flight time of 7.6 million hours, demonstrating the extensive use of drone technology.
- DJI continues to dominate the drone manufacturing industry, holding 79% of the market share in 2023, with 54% of the global market share and 80% in the US market by 2024.
- Global drone shipments reached 2.4 million units in 2023, with expectations to surpass 3.1 million units annually by the end of 2025.
- In 2023, China led the world in drone revenue generation, contributing USD 1,526 million to the global market.
You May Also Like To Read
- Cameras Statistics
- Fitness Trackers Statistics
- Tablets Statistics
- Drones Statistics
- Foldable Smartphones Statistics
- Sleep Tracker Statistics
- Tablet Statistics
- Smart Home Statistics
- Dashboard Camera Statistics
Let’s Understand About Drones!
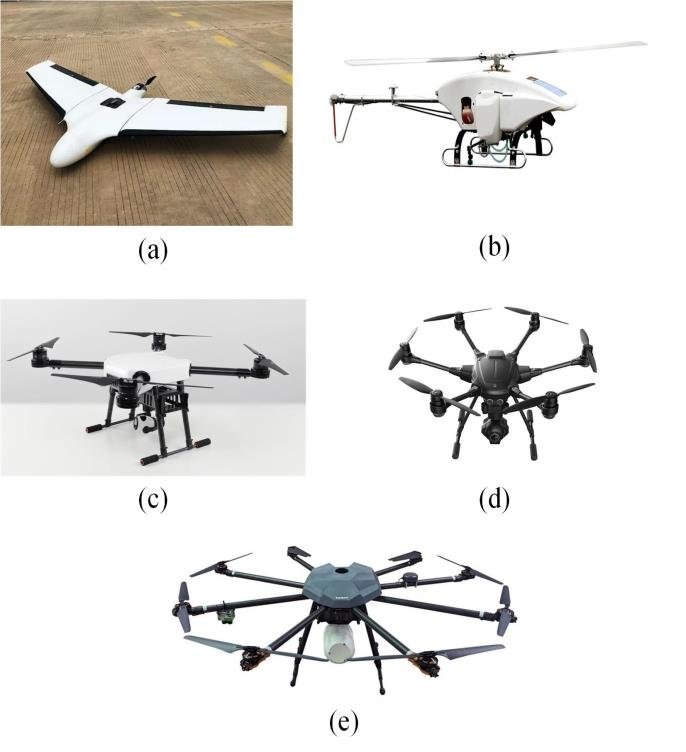
Drones, or Unmanned Aerial Vehicles (UAVs), are flying devices attached to sensors and cameras. They offer various applications and advantages, such as surveillance, monitoring, delivery services, aerial photo and video capture, and more.
(Source: researchgate.net)
There are five types of drones, as shown in the above image, such as (a) Fixed wing, (b) Single rotor, (c) Quadcopter, (d) Hexacopter, and (e) Octocopter drone.
Advantages and Disadvantages of Drones
Advantages include faster data collection modes, enhanced safety features, capturing information from hazardous situations, increased accuracy, real-time monitoring, and long-term cost-effectiveness.
Disadvantages include the expensive drone technology, huge maintenance costs, separate training charges to operate drones legally and safely, legal requirements, airspace limitations, weather setbacks, fly time, etc
Facts About Drones
- In 1989, for the first time, a drone was used.
- Now, drones can easily carry a passenger! Which is made possible by Alibaba drones and costs $40,000.
- According to Drones Statistics 2024, in the United States of America, almost 67% of small drone businesses are threatened with closure.
- In 2023, DJI released three new drones only in China: Matrice 3D, the DJI Dock 2, and the FlyCart 30.
- In recent times, companies’ most effective reasons for using drones are improving work safety (45%), time savings (42%), and quality (41%).
- Based on Drone Statistics in 2023, the driving factors in the drone industry are rule-making authorities (52%), drone manufacturers (47%), drone service providers (45%), drone manufacturers (29%), organizations of safety concepts for drone design and operation (21%), drone associations (16%), and others (9%).
- A report published by Statista estimates that drones’ global revenue will be $4.3 billion in 2024.
- In addition, this accounts for per-person revenues of $0.55.
- Meanwhile, the market’s annual growth rate will be 2.26% from 2024 to 2028.
General Drones Statistics
- As of 2023, the market size of drones resulted in USD 33.4 billion, whereas the expected market size of drones is followed by 2024 (USD 36.8 billion) and 2025 (USD 40.5 billion).
- In the United States, the total number of recreational drones will reach around 1.5 million by 2023.
- Conversely, DJI in the USA owned around 80% of the drone market share.
- In July 2023, the total number of registered drones in the U.S. was 863,728, of which drone registrations by 59% (506,635) were for recreational purposes and 41% (352,222) for commercial operations.
- Drones were mostly used for mapping and surveying projects, which were claimed by Business-Internal-Service (BIS) companies with a 37% share and Drone Service Providers (DSPs) with a 33% share.
- Drone-powered solutions market size will be USD 43.2 billion in 2024.
- By 2025, the U.S. drone industry is supposed to create more than 100,000 jobs.
- The personal drones segment accounts for almost 94% of unit sales, resulting in 40% of the market’s revenue share.
- In 2024, the military drone market is anticipated to reach USD 11.47 billion.
Drone Market Size By Market.us
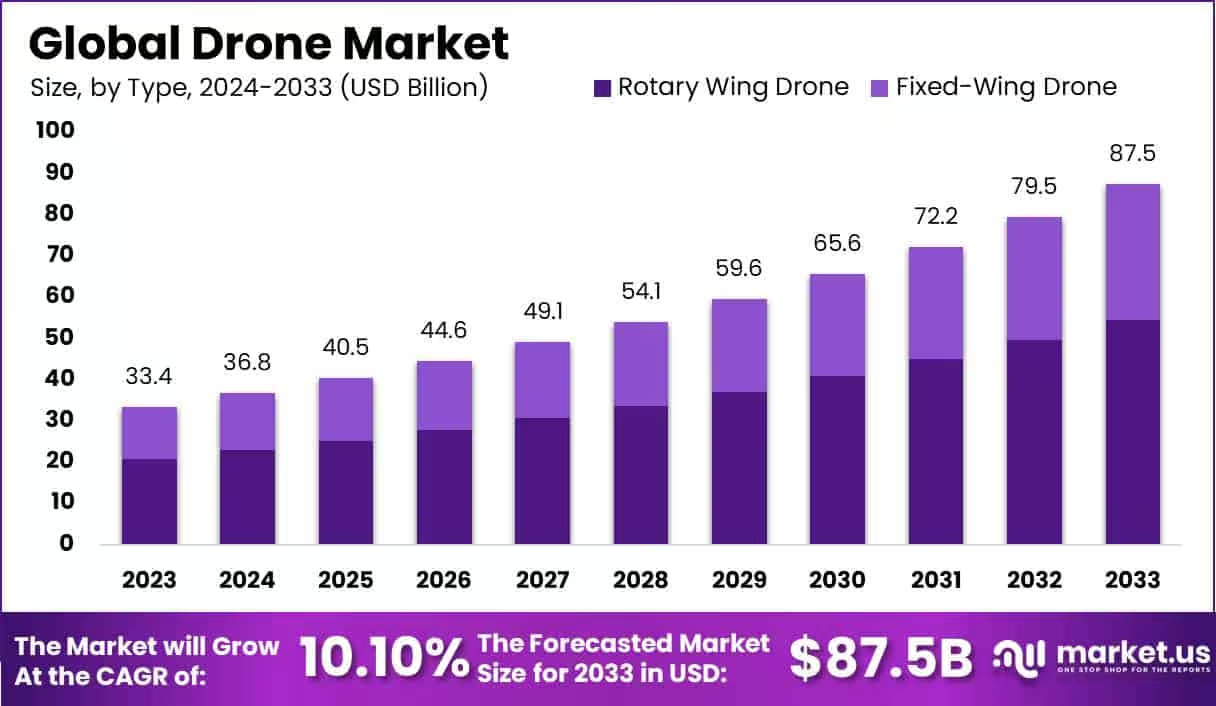
- The global drone market is projected to expand from USD 34.4 billion in 2023 to USD 87.5 billion by 2033, growing at a CAGR of 10.1% from 2024 to 2033.
- In 2023, the APAC region held a dominant position in the market with a 40.2% share, generating USD 13.4 billion in revenue.
- The rotary wing drone segment led the market in 2023, accounting for 62.3% of the market share.
- The military applications of drones constituted 48.8% of the market share in 2023.
- As of 2024, the Federal Aviation Administration (FAA) has registered 855,860 drones in the United States.
- There are 270,183 individuals with remote pilot certification in the United States.
- The drone industry in the U.S. is projected to create 103,776 jobs by 2025.
- DJI, a Chinese company, holds approximately 60% of the global drone market and 80% of the American market.
- Businesses and government agencies in the United States spent a total of USD 13 billion on drones.
By Country-Wise Revenue Comparison
- Drones Statistics further states that China will generate the highest drone revenue worldwide, resulting in USD 1.52 billion by the end of 2024, along with a growth rate of 4.29% from 2024 to 2028.
- Expected drone revenue in the United States will be USD 1.4 billion, with a CAGR of 0.36% in the forecasted period.
- Furthermore, in 2024 other countries estimated revenue generation and CAGR are followed by France (USD 171.4 million and -0.09%), Germany (USD 137.1 million and -0.07%), and the United Kingdom (USD 120 million and -0.08%).
By Regional Analysis
(Source: twimg.com)
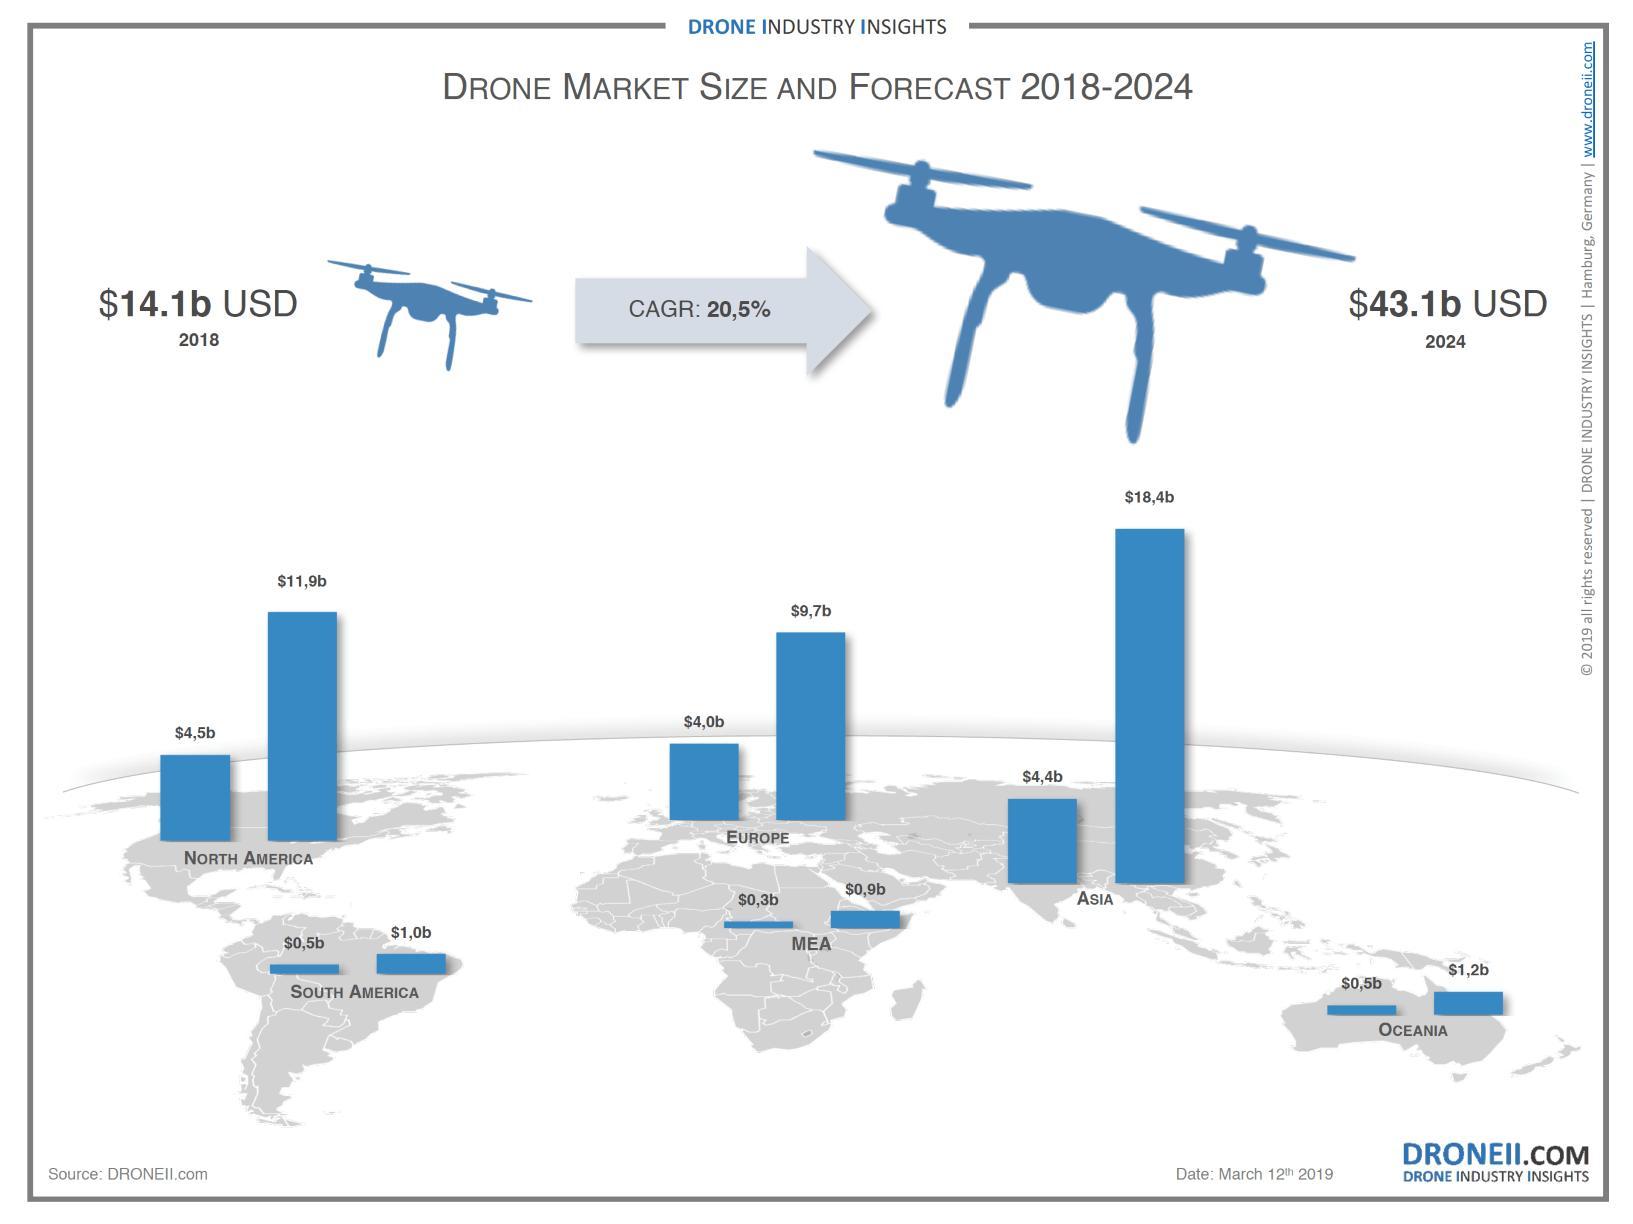
- As per a report generated by Drone Industry Insights, in 2024, the Asia Pacific region is predicted to account for the highest market size, resulting in $18.4 billion.
- Followed by another region-wise market size of the drone industry are North America ($11.9 billion), Europe ($9.7 billion), Oceania ($1.2 billion), South America ($1.0 billion), and Middle East Asia ($0.9 billion).
By Top Manufacturers
- As of 2023, the DJI brand (China) is still dominant among the overall manufacturing industries of civil drones by a substantial margin of 79%.
- Other drone manufacturers with a margin share are Skydio (USA), which has a margin of 20.6%; XAG (China), which has a margin of 15.9%; Parrot (France), which has a margin of 13.3%; and JOUAV (China), which has a margin of 12.8%.
- The market valuation of Skydio will hit around $2.2 billion in 2023.
- Drone Statistics further states that the top 5 dual-use drone manufacturers share are Insitu (39.5%), Schiebel (37.5%), Edge Autonomy (26.8%), Quantum Systems (26.1%),
(Reference: thedronegirl.com)
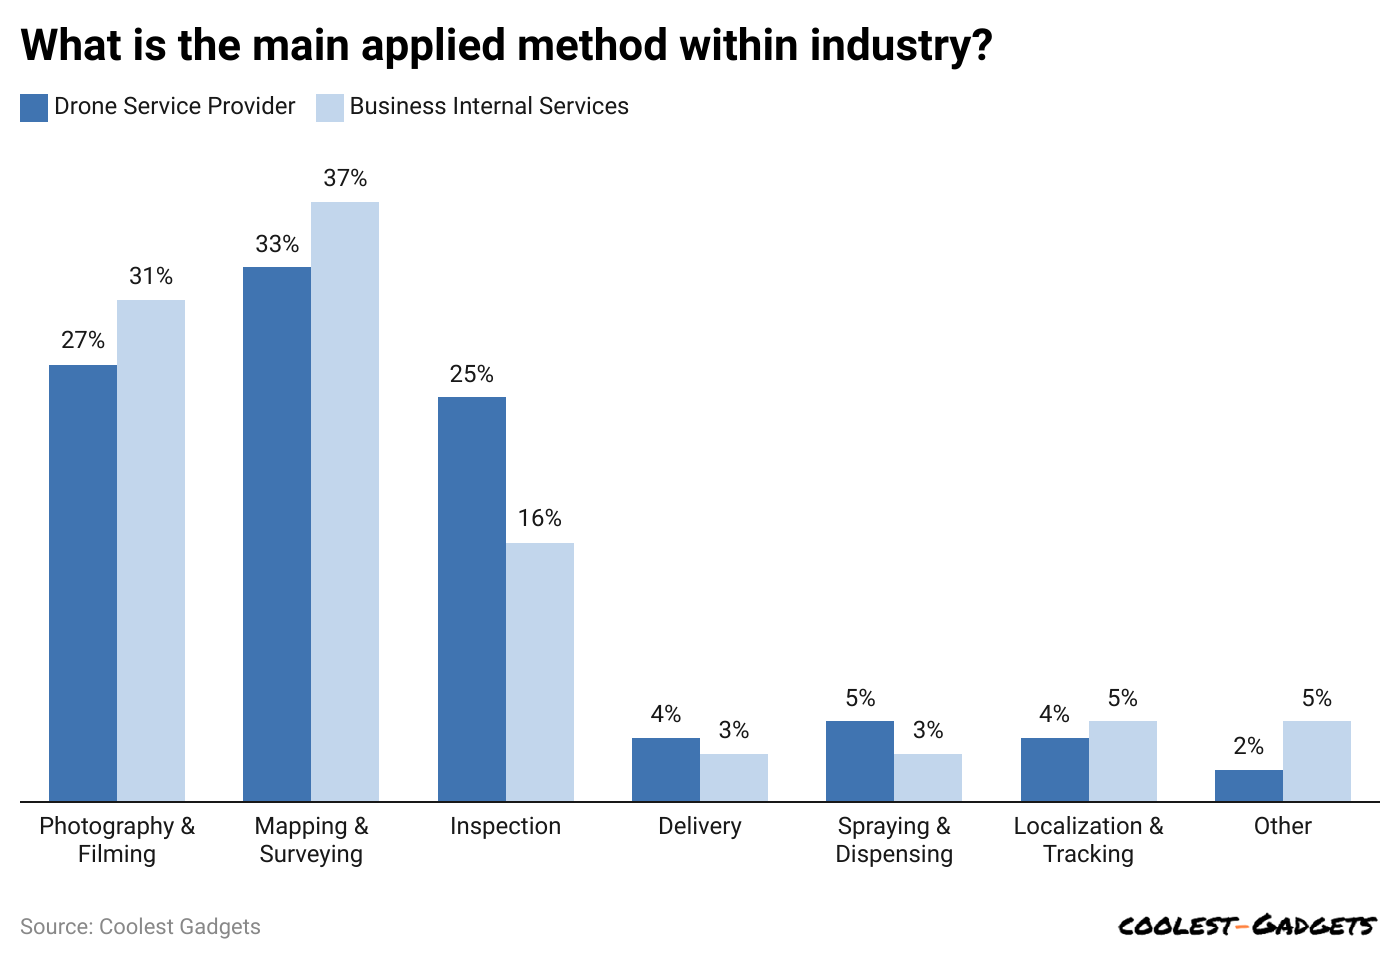
- According to Drone Statistics, as of 2023, drones were mostly used for mapping and surveying projects, which was claimed by Business-Internal-Service (BIS) companies with a 37% share and Drone Service Providers (DSPs) with a 33% share.
- Meanwhile, the use of drones for Photography and Filming accounted for a share of 31% (BIS) and 27% (DSP).
- Besides, DSP and BIS’s other usage shares of drones in 2023 are inspection (25% and 16%), delivery (4% and 3%), spraying and dispensing (5% and 3%), localization and tracking (4% and 5%), and others (2% and 5%), respectively.
By Industry
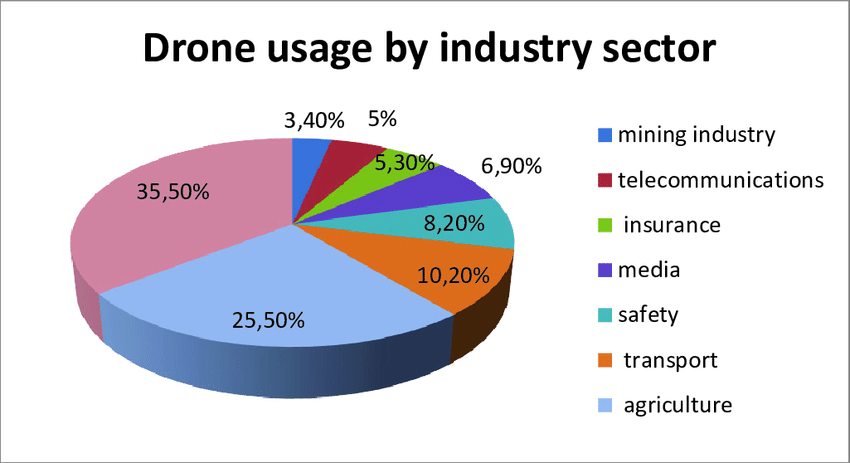
(Source: researchgate.net)
- Drones Statistics also mentioned that the usage share in the agriculture sector covered 25.50% share in 2023.
- On the contrary, other industry usage shares are transport (10.20%), safety (8.20%), media (6.90%), insurance (5.30%), telecommunications (5%), and the mining industry (3.40%).
- Meanwhile, other industries’ usage shares collectively made up around 35.50% of the share.
- According to an Air Survey done by Philly in 2023, 15% of people in the United States have used drones currently.
- In the U.S., 24% of men used drones, and only 10% of women used drones.
- Based on drone statistics usage, around 22% of drone users were aged between 45 and 54 years.
- Other drone users, by age group, are 35 to 44 (20%), 18 to 24 (19%), 25 to 34 (17%), 55 to 64 (13%), and above 65 (6%).
By Ownership
- 8% of Americans own a drone, reflecting a growing interest in drone technology across the country.
- The largest segment of drone owners in the U.S. is aged 45 to 54, making up 22% of the total ownership.
- The second largest group of drone owners is between 35 and 44 years old, representing 20% of drone ownership.
- People aged 25 to 34 years account for 17% of drone ownership, making them the third largest demographic.
- The smallest group of drone owners is those 65 years and older, representing only 6% of all drone owners in the U.S.
- In terms of income, 70.4% of U.S. drone service providers earn less than $50,000 per year, indicating that the majority of the industry operates on a smaller scale.
- A significant majority of drone owners are men, with 96% of drones being owned by men and only 4% by women.
- Drone ownership share by age is as follows: 9% of owners are aged 18 to 24 years, 9% are aged 25 to 34 years, 10% are aged 35 to 44 years, 5% are aged 45 to 54 years, 9% are aged 55 to 64 years, and 4% are aged 65 years and older.
Drone Injury Statistics
- From 2015 to 2020, approximately 4,250 injuries related to drones were reported.
- A significant 72% of these injuries were lacerations, making it the most common type of drone-related injury.
- Multirotor drones were responsible for over 70% of the reported drone incidents.
- 56% of injuries in drone accidents involved the upper extremities, specifically the fingers.
- Head injuries accounted for 24% of the reported cases, while injuries to the lower extremities were at 14%, and trunk injuries made up 6%.
- The majority of drone injuries (84%) occurred in males, with females accounting for only 16% of the injured.
- Around 21% of those injured were individuals under the age of 18.
- Most drone incidents (75%) took place between 10 a.m. and 10 p.m., with the remaining 25% occurring overnight.
- Other types of injuries reported included contusions/abrasions (10%), strains/sprains (5%), and internal injuries (5%).
Drone Incident Statistics
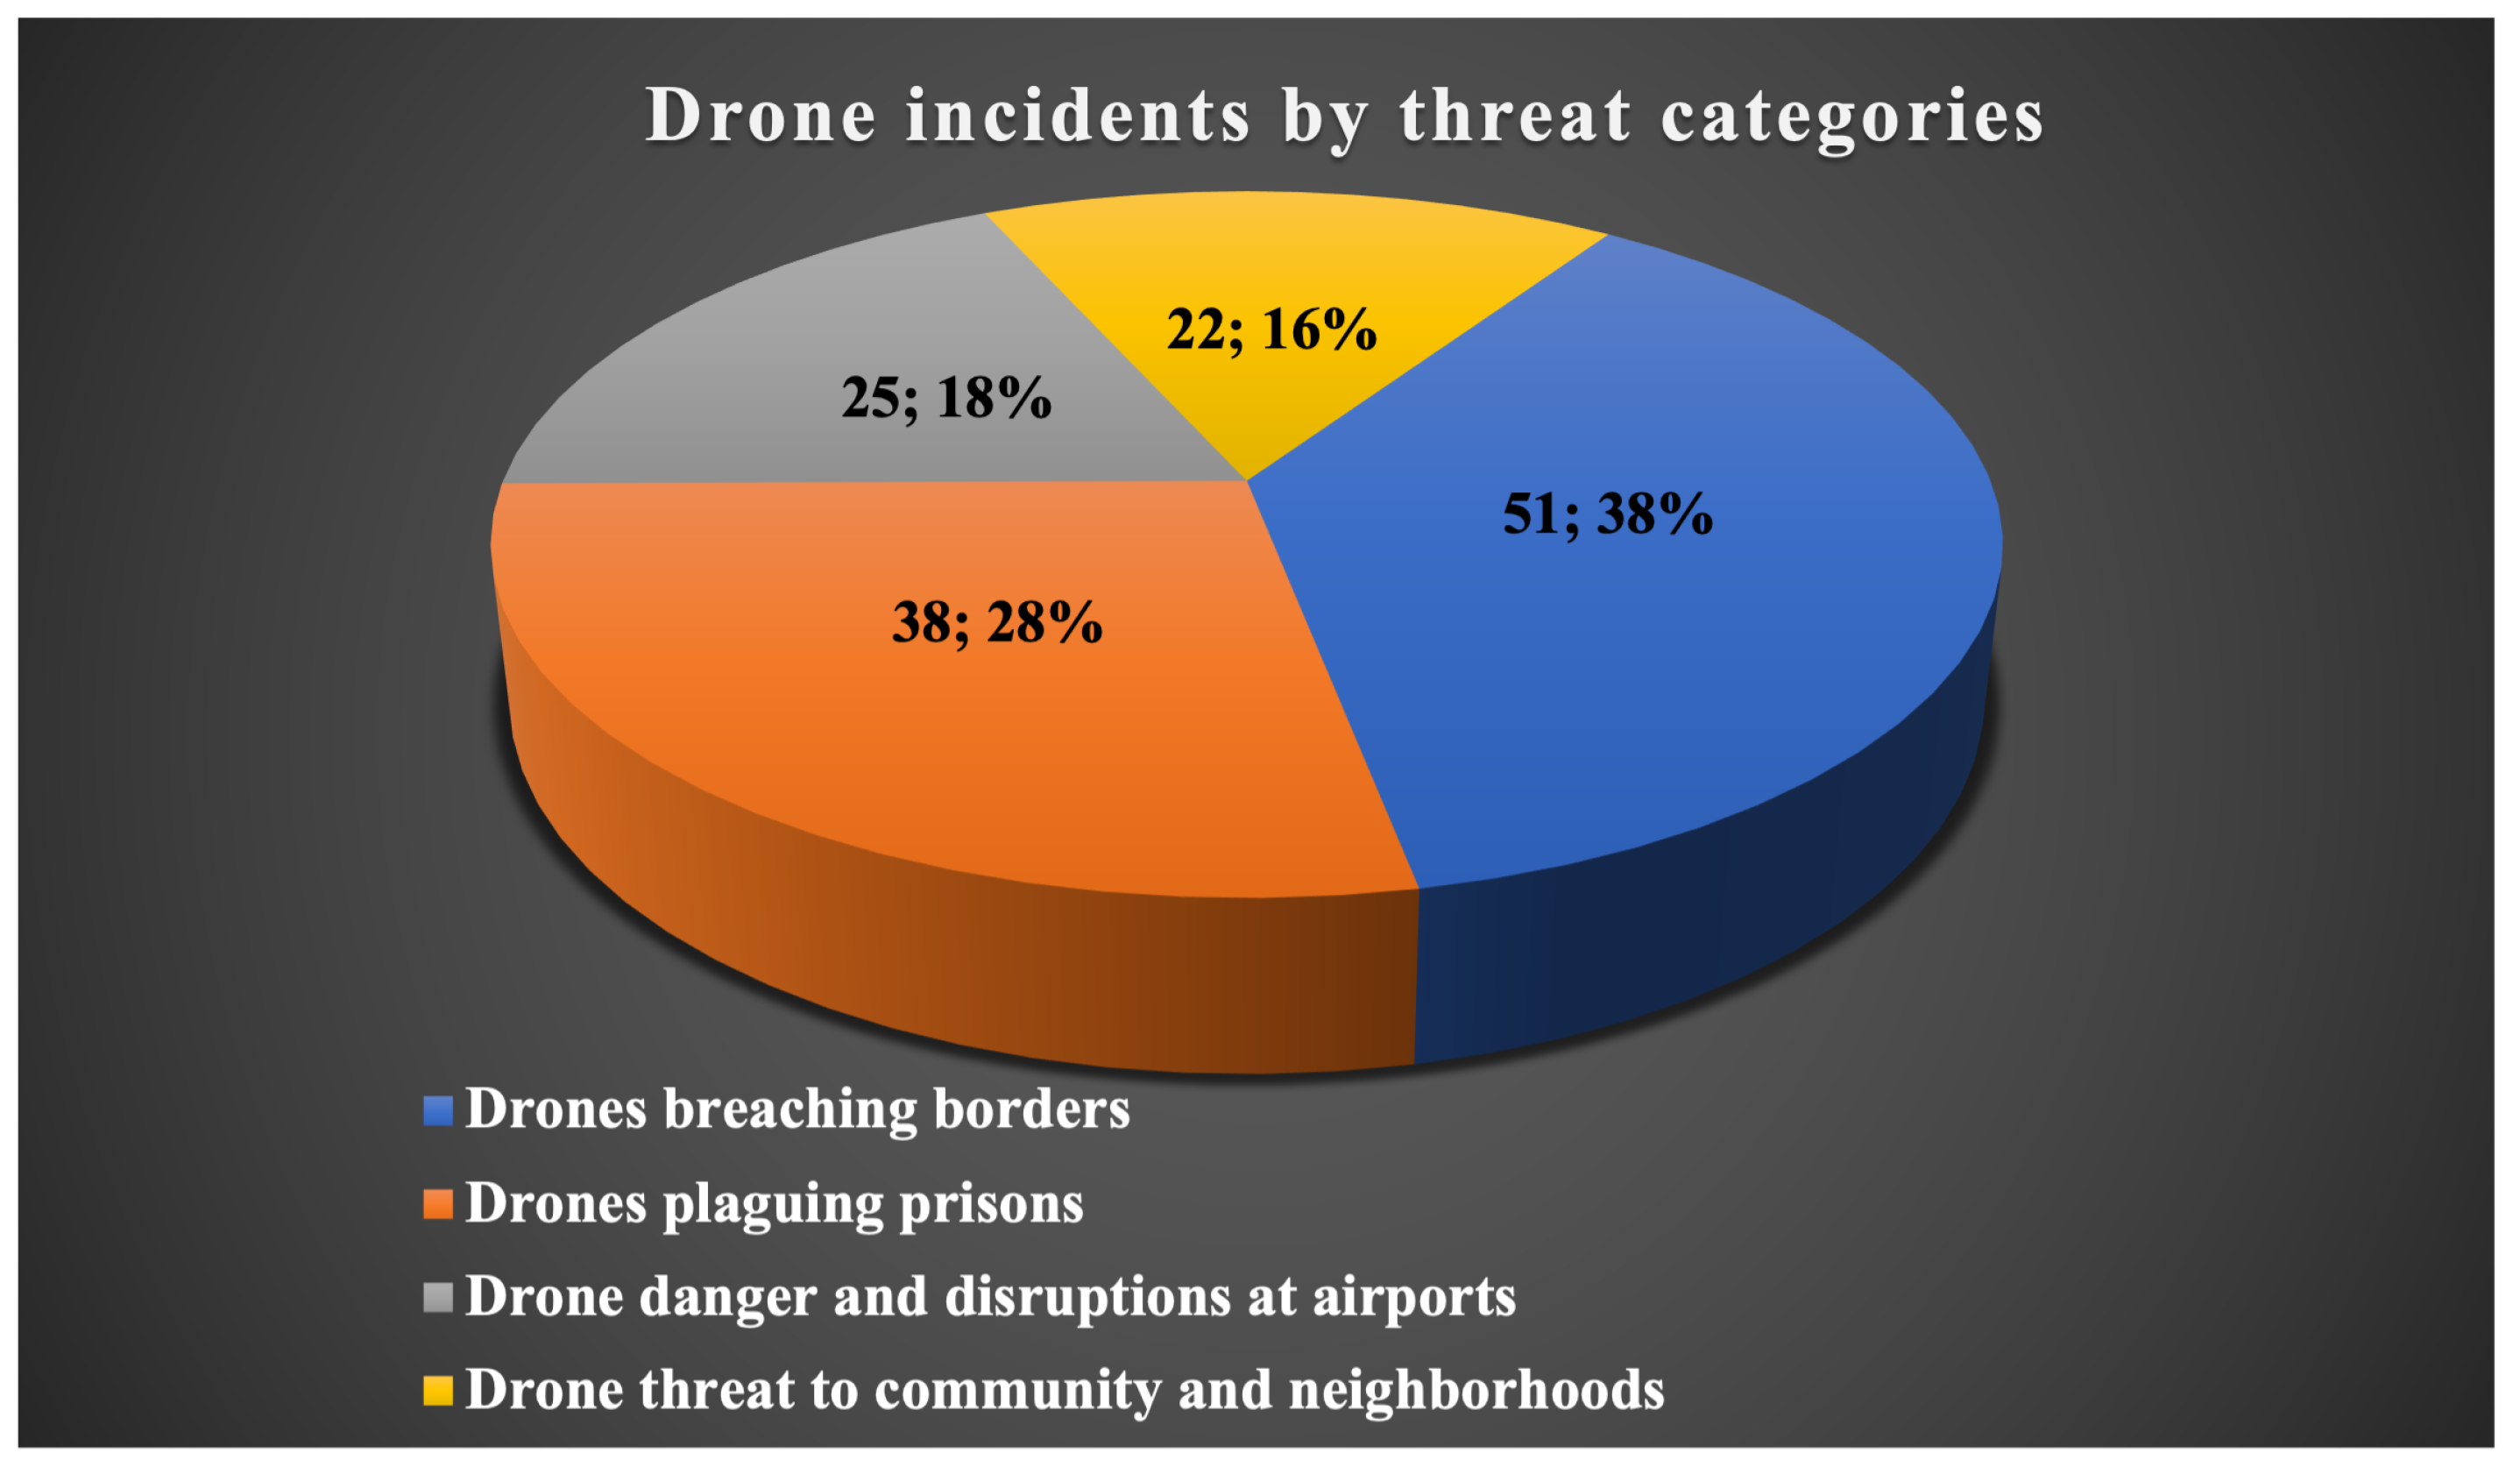
(Source: mdpi.com)
- Almost 38% of drone smuggling incidents have increased in 2023.
- In the India-Pakistan border, up to 84% of smuggling drone incidents took place several times in January, followed by the Jordan-Syria border (12%) and the Israel-Lebanon border (4%)
- 28% of drone incidents were involved in delivering illegal items and drugs into prisons.
- 18% of incidents are drone danger and disruptions at airports such as the USA, India, Israel, and the U.K.
By Month
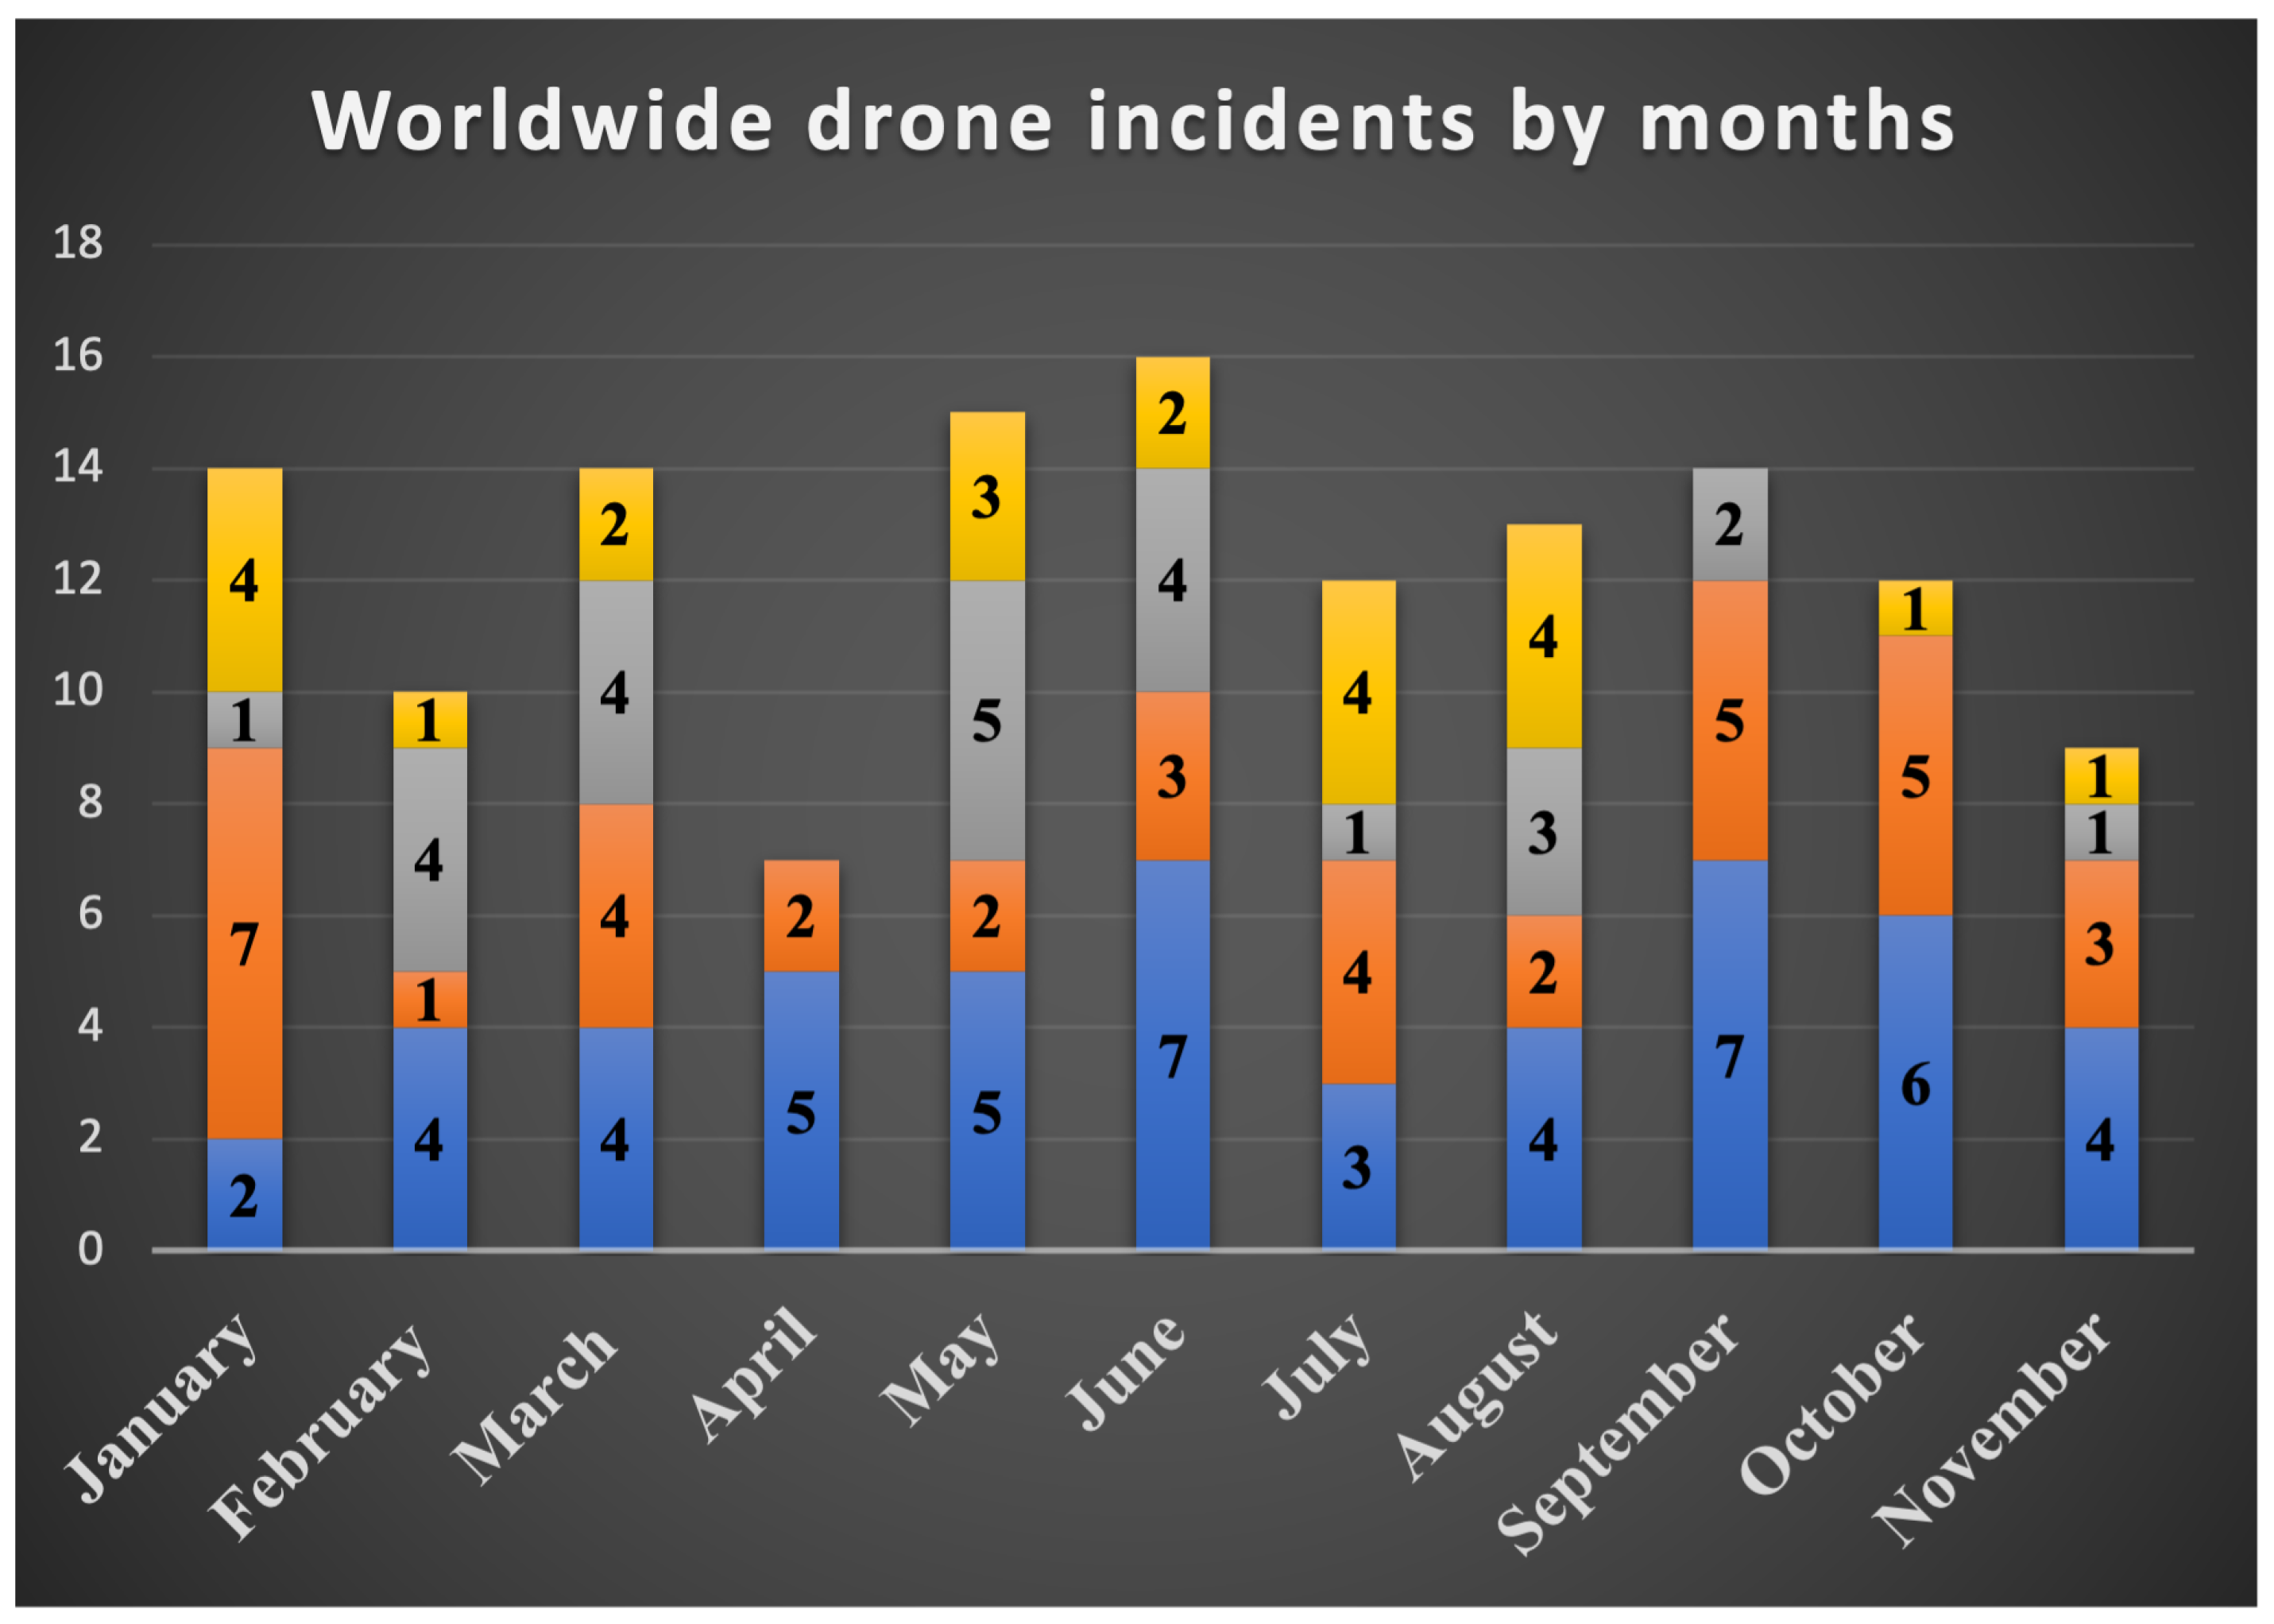
(Source: mdpi.com)
- Monthly drone incidents of 2023 are classified into four types of threats, as shown in the above graph. Such Blue color signifies (drones breaching borders), Orange (drones plaguing prisons), Gray (drone danger and disruptions at airports), and Yellow (drone threats to communities and neighborhoods).
- Based on above threat types worldwide drone incidents by number of times are represented respectively such as in January (2, 7, 1, and 4), February (4,1, 4, and 1), March (4, 4, 4, and 2), April (5 and 2), May (5, 2, 5, and 3), June (7, 3, 4, and 2), July (3,4, 1, and 4), August (4, 2, 3, and 4), September (7, 5, and 2), October (6, 5, and 1), and November (4, 3, 1, and 1).
Reasons for Adopting Drones
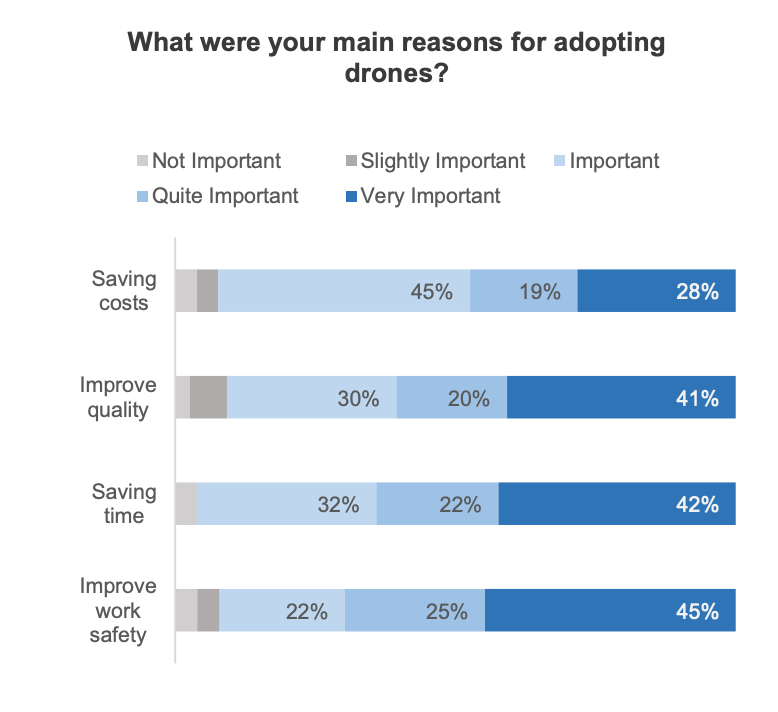
(Source: thedronegirl.com)
- The above graph estimates the specific reasons for adopting drones in 2023, along with respondents’ share on the scale of importance accordingly.
- Saving costs: 28% of respondents vote for (very important), 19% (quite important), and important (45%).
- Improve quality: very important (41%), quite important (20%), and important (30%).
- Saving time: very important (42%), quite important (22%), and important (32%).
- Improve work safety: very important (45%), quite important (25%), and important (22%).
You May Also Like To Read
- Smart Video Doorbell Statistics
- Wireless Gaming Mouse Statistics
- Electric Kettle Statistics
- Leaf Blower Statistics
- Zero Turn Mower Statistics
- Android TV Box Statistics
- Video Doorbells
- 360 Camera Statistics
- Portable Power Bank Statistics
- Bose Corporation Statistics
- Smartphone Sales Statistics
- Portable Printer Statistics
Drone Incidents Statistics
- Over 60% of drone-aircraft close encounters occurred within 200 feet of an airport, highlighting the significant risk posed by drones near these critical areas.
- More than 20% of these close encounters happened within just 50 feet of an aircraft, indicating the severity of some incidents.
- Multirotor drones are responsible for over 70% of all reported drone incidents, making them the most common type involved in close encounters.
- Single-engine propeller aircraft were the most frequently involved in drone incidents, with 125 reported cases, followed by multiengine jet aircraft with 116 incidents.
- Helicopters were involved in the fewest drone-related incidents, with 38 cases reported, showing they are less frequently impacted by drones.
- The majority of drone incidents, over two-thirds, occurred during daylight hours between 10 a.m. and 6 p.m., with the peak time being between 2 p.m. and 6 p.m.
- About 75% of all drone incidents were reported between 10 a.m. and 10 p.m., indicating higher activity during these hours, while the remaining 25% occurred during overnight hours.
- More than half of the manned aircraft involved in close encounters with drones were operated by private or chartered pilots, falling under general aviation.
- Commercial aircraft were involved in 28% of all close encounters with drones, signifying their significant risk exposure.
- Among commercial aircraft, multiengine jets were the most common type involved in these incidents, accounting for 27.5% of the total close encounters.
Commercial Drones Statistics
(Reference: statista.com)
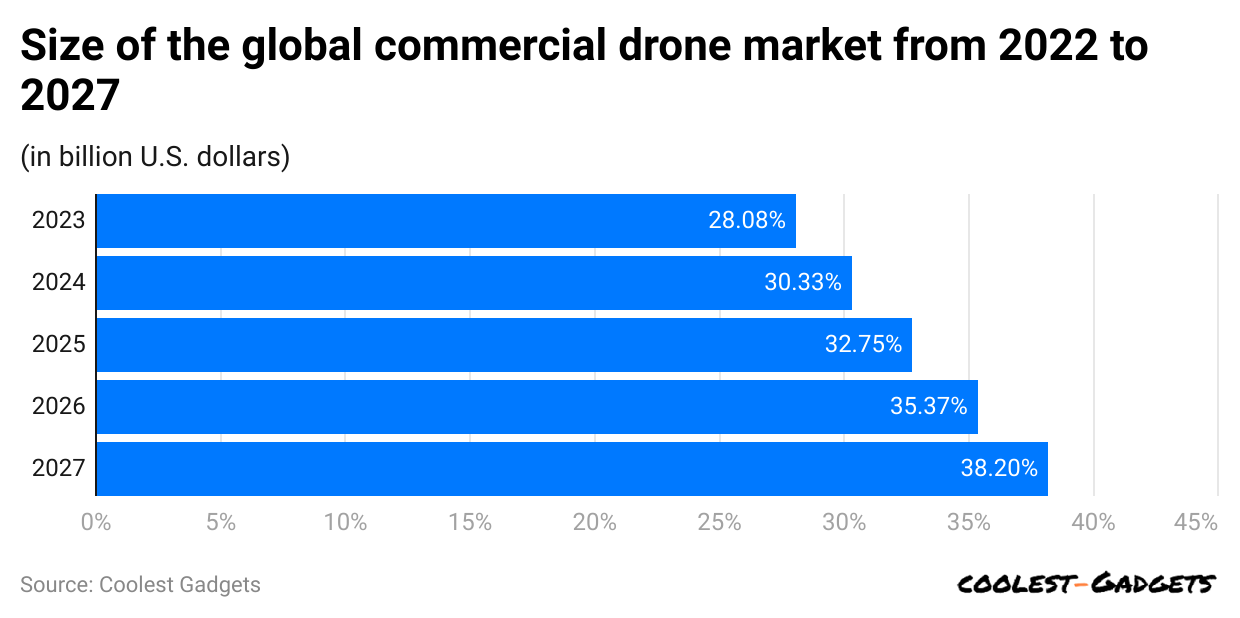
- The commercial drone market segment accounted for $28.08 billion in revenue in 2023.
- Apart from this, approximate revenue increases are expected in the coming years, such as 2024 ($30.33 billion), 2025 ($32.75 billion), 2026 ($35.37 billion), and 2027 ($38.2 billion).
By Earning
- Around 70.4% of American drone service providers’ annual earnings are below $50k.
- Furthermore, other U.S. drone service providers’ share by annual earnings are 12.8% ($50K to $100K), 11.8% ($100K to $150K), and 5% ($500K).
Drones Efficiency Statistics
- Nearly 90% of global companies are now using drones, which allow them to capture better and more efficient information quickly.
- In the agricultural segment, crop spraying by drones is more effective and 40% to 60% faster than manual spraying.
- Around 88% of companies that have just started investing in drones for more or less one year have received a positive return on business operations.
- A recent survey by Drone Statistics claimed that 79% of online buyers are now willing to receive a drone delivery.
Drone US Demographics Statistics
- In the United States, 96% of drone owners are men, while only 4% are women.
- Drone ownership is most prevalent among individuals aged 45-54 years old, who make up 22% of drone owners.
- The second largest age group of drone owners is those aged 35-44 years old, representing 20% of the total.
- Individuals aged 18-24 years old account for 19% of drone owners in the U.S.
- The 25-34 years old age group constitutes 17% of drone owners.
- Those aged 55-64 years old make up 13% of drone ownership.
- The smallest group of drone owners are individuals aged 65 and older, comprising just 6% of the total.
Drone Revenue and Cost Statistics
- In 2024, China generated the highest revenue in the global drone industry, reaching approximately USD 1,394 million.
- As of 2024, the Federal Aviation Administration (FAA) has registered a total of 855,860 drones in the United States.
- Out of these registrations, 63% (approximately 536,183 drones) were registered for recreational purposes.
- The remaining 37% (around 316,075 drones) were registered for commercial operations in the U.S.
(Source: skykam.co.uk)
Drones FAA Statistics
- Drones weighing more than 55 pounds must be registered with the Federal Aviation Administration (FAA) to ensure they are tracked and regulated appropriately.
- The FAA receives over 100 reports of unmanned aircraft sightings every month, highlighting the increasing presence of drones in U.S. airspace.
- Part 107 of the FAA regulations sets guidelines for recreational drone use, including rules about keeping the drone within the visual line of sight, not interfering with other aircraft, and adhering to specific flight hours and locations.
- Drone operators who wish to fly outside the standard Part 107 rules, such as flying at night or beyond visual line of sight, must obtain a Part 107 waiver from the FAA.
- Approximately 46% of Part 107 waiver requests are approved by the FAA, while 54% are denied.
- Of the Part 107 waivers granted by the FAA, 92% are for flying drones at night, reflecting a high demand for nighttime operations.
- About 5% of these waivers are granted for flying drones in restricted airspace, such as near airports and government buildings.
- Only 2% of the waivers are for more complex operations like flying beyond the visual line of sight, from a moving vehicle, or over populated areas.
(Source: skykam.co.uk)
US Drone Service Provider’s Income
- The majority, 70.4%, of US drone service providers earn less than USD 50,000 annually.
- Approximately 11.8% of US drone service providers earn between USD 100,000 to USD 150,000 each year.
- About 12.8% of US drone service providers have an annual income between USD 50,000 to USD 100,000.
- A smaller group, 5.0%, of US drone service providers earn more than USD 500,000 per year.
- The Oil & Gas industry offers the highest hourly pay for drone pilots, with an average rate of USD 195.
- Drone mapping specialists tend to earn 16% more than general drone service providers.
- Mining is the second highest-paying industry for drone pilots, offering an average hourly rate of USD 183.
- Construction drone pilots earn an average hourly rate of USD 167, positioning this industry as the fourth highest-paying sector.
- Surveying ranks third, with drone pilots earning an average hourly rate of USD 175.
- Emergency response drone pilots receive an average hourly rate of USD 170.
- Real estate drone pilots earn an average of USD 158 per hour.
- Solar energy drone pilots earn an average of USD 174 per hour, making it one of the higher-paying industries.
- Agriculture, though essential, offers a slightly lower average hourly rate for drone pilots at USD 160.
(Source: skykam.co.uk)
Drone Insurance Statistics
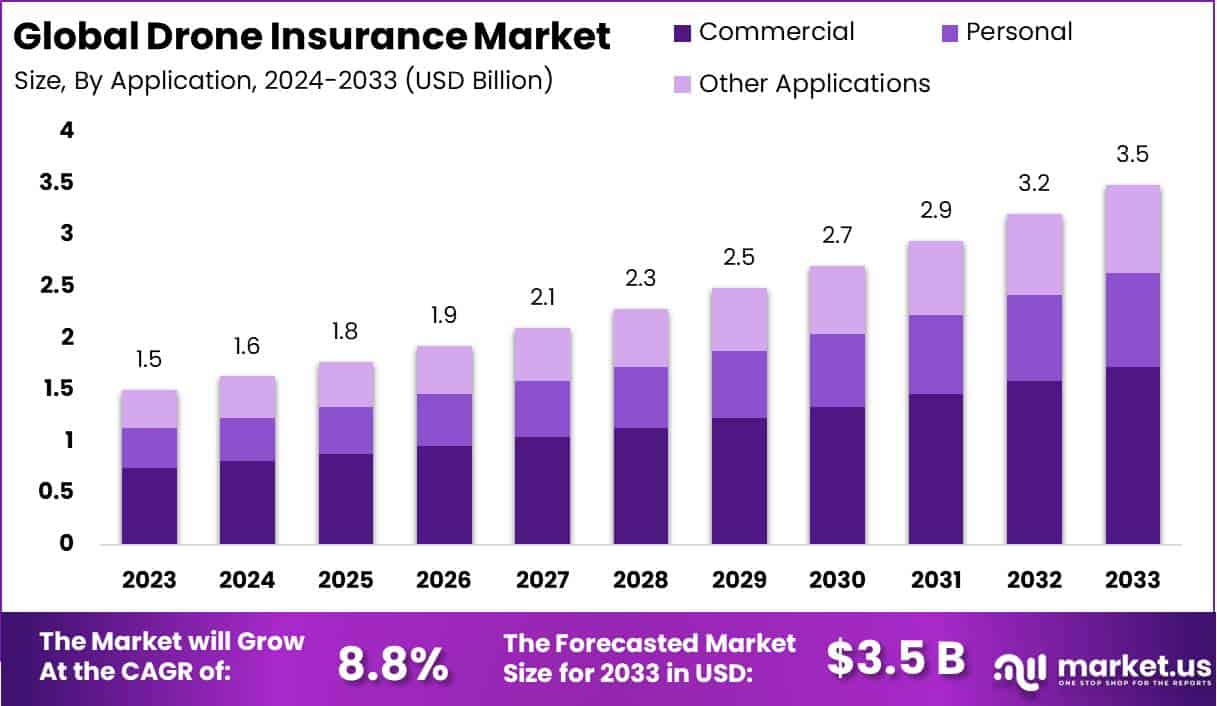
- The Global Drone Insurance Market size is expected to reach USD 3.5 billion by 2033, up from USD 1.5 billion in 2023.
- Growing at a CAGR of 8.8% during the forecast period from 2024 to 2033.
- In 2023, the Liability Coverage segment held a dominant position in the drone insurance market, capturing over a 26.4% market share.
- The Commercial segment also dominated in 2023, with a market share exceeding 49.5%.
- North America held the leading position in the drone insurance industry in 2023, capturing more than a 38.6% market share, with revenues totaling USD 0.57 billion.
- The number of drone-related incidents increased by 130% from January to November 2022, reaching 223 incidents in November 2022.
- The Federal Aviation Administration (FAA) reported 352,222 registered commercial drones in the United States as of the latest data.
- The drone industry contributed to creating 422,000 jobs related to drone operations by 2021.
- The market for drones across various sectors was valued at approximately USD 127.0 billion in November 2021.
Best Drones to Take Photos and Video in 2024
- DJI Mavic 3 Pro ($2199)
- DJI Mini 2 S.E. ($299)
- EXO Scout ($151)
- HoverAir X1 ($479)
- DJI Mini 3 Pro ($798)
- DJI Air 3 ($1099)
- DJI Mavic 3 Classic ($1599)
- DJI Avata Pro-View Combo ($999)
Drones Website Traffic Statistics
By Country
(Source: similarweb.com)
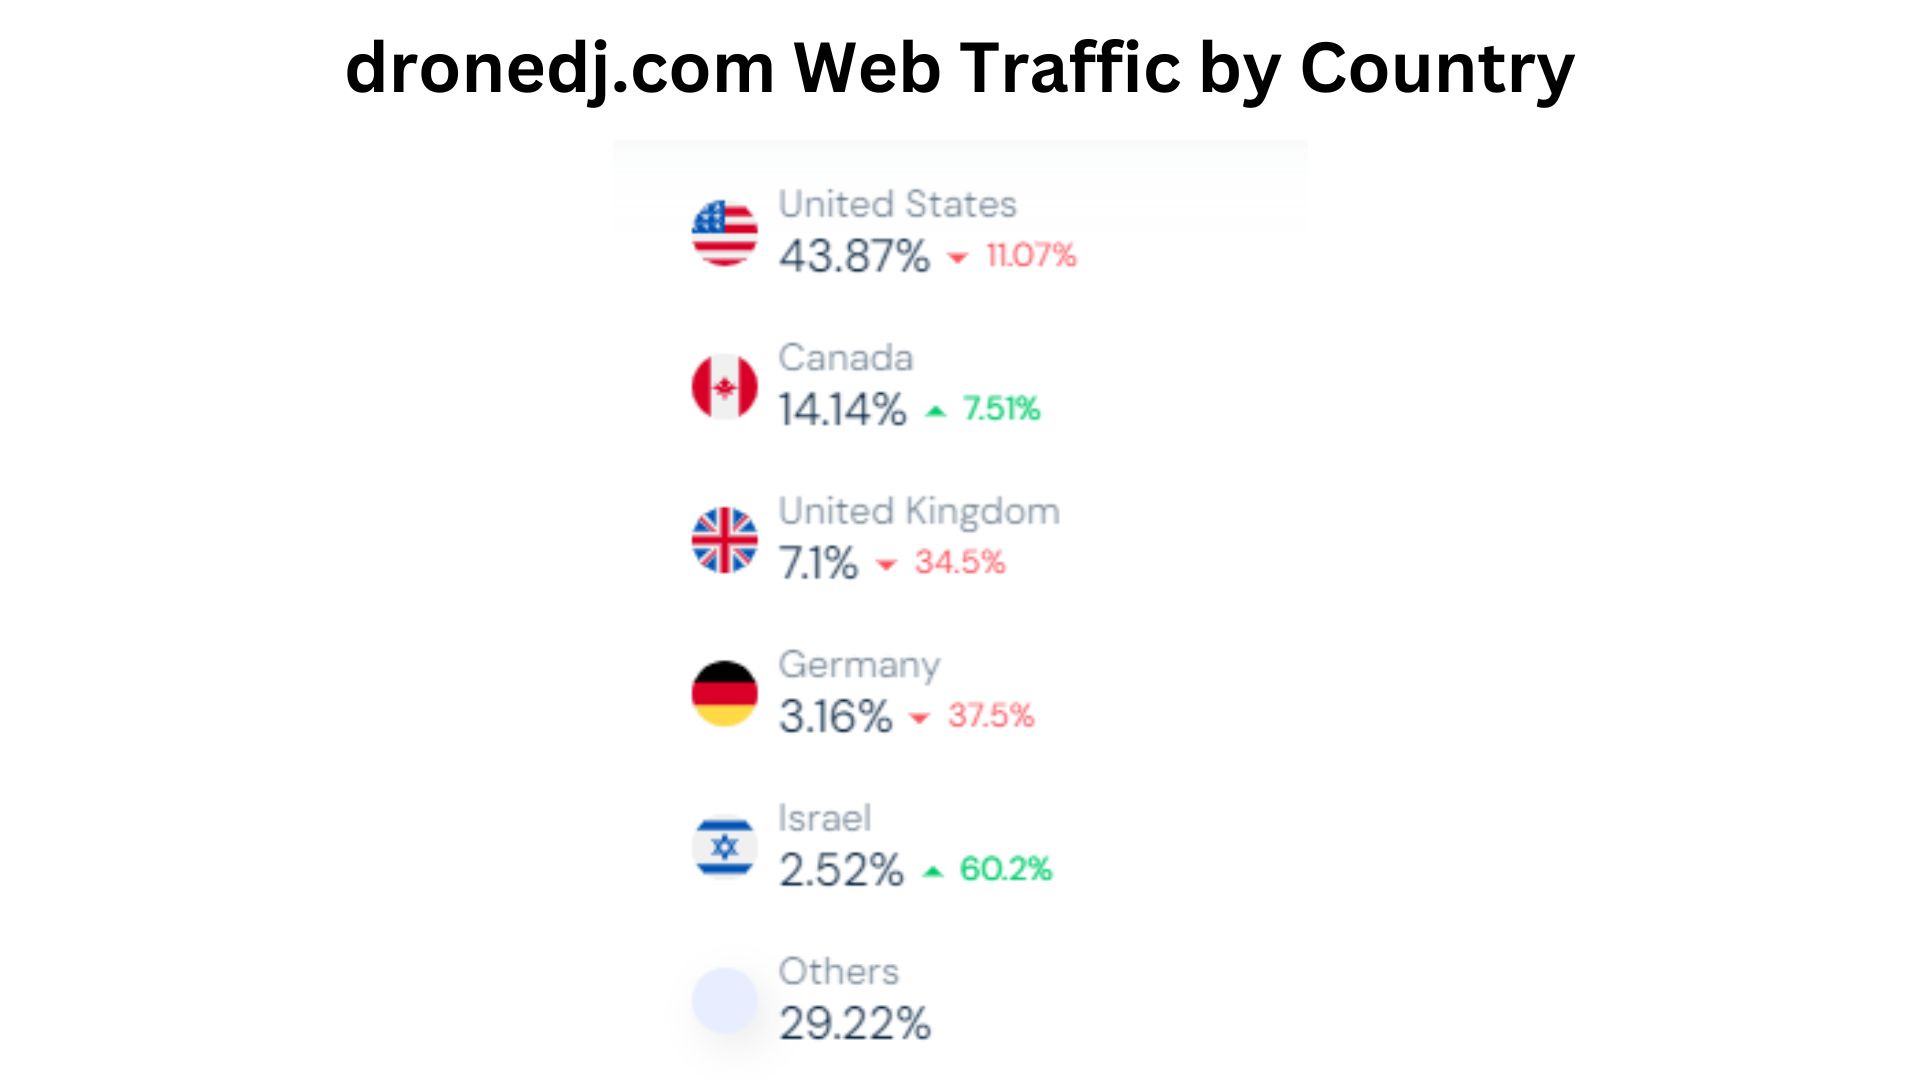
- In February 2024, as explained by Drones Statistics, the United States had 43.87% of total traffic on droned.com, but it was reduced by 11.07% in total website visitors.
- Other countries recorded the following contribution in total traffic: Canada = 14.14% (+7.51%), the United Kingdom = 7.1% (-34.5%), Germany = 3.16% (-37.5%), and Israel = 2.52% (+60.2%).
- Other countries collectively made a visitor share of 29.22% on droned.com.
By Demographics
(Reference: similarweb.com)
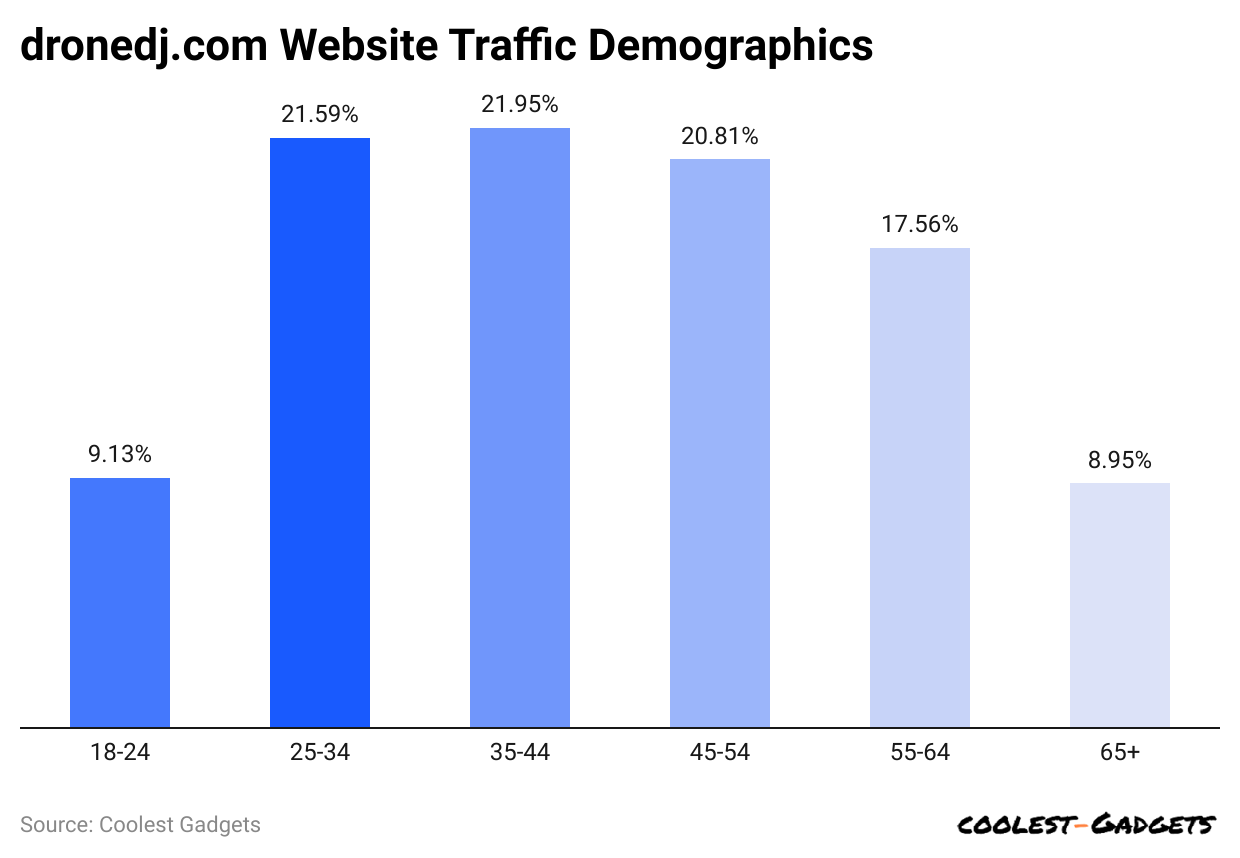
- The highest number of website users observed is between 35 and 44 years old, resulting in 21.95% share.
- Users are aged from 25 to 34 years, makes a website share of 21.59%
- 81% and 17.56% belong to 45 to 54 years and 55 to 64 years, respectively.
- 13% of website users are between 18 and 24 years old.
- 65 years and above age group users contributed a share of 8.95%
- Male and female users of droned.com share 80.47% and 19.53%, respectively.
By Traffic Source
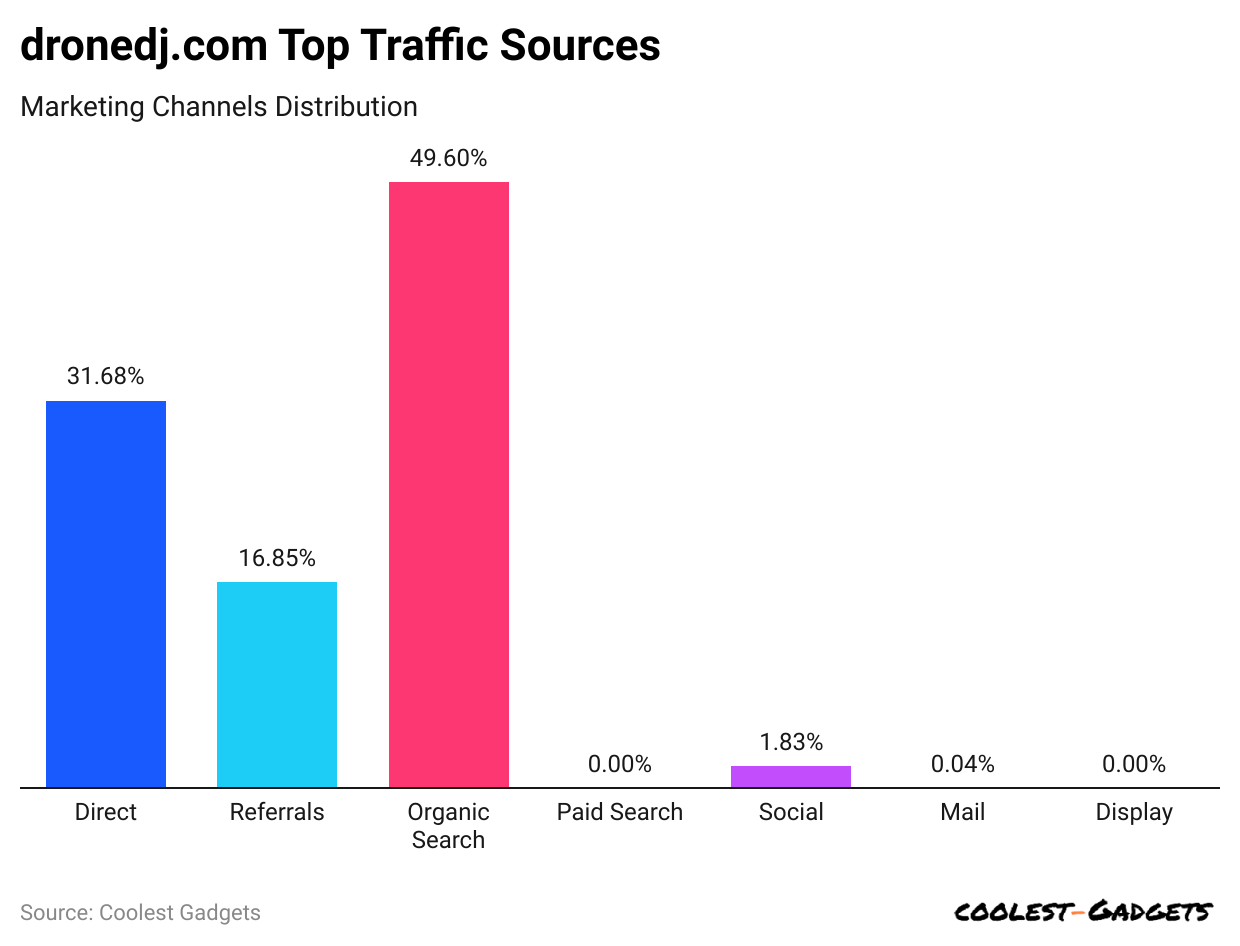
(Reference: similarweb.com)
- Organic search accounted for the highest traffic rate towards dronedj.com, resulting in a 49.6% share.
- 68% of the traffic share is accounted for by direct search, while 16.85% is from Referral.
- Other traffic sources are social (1.83%) and mail (0.04%).
By Social Networking Distribution
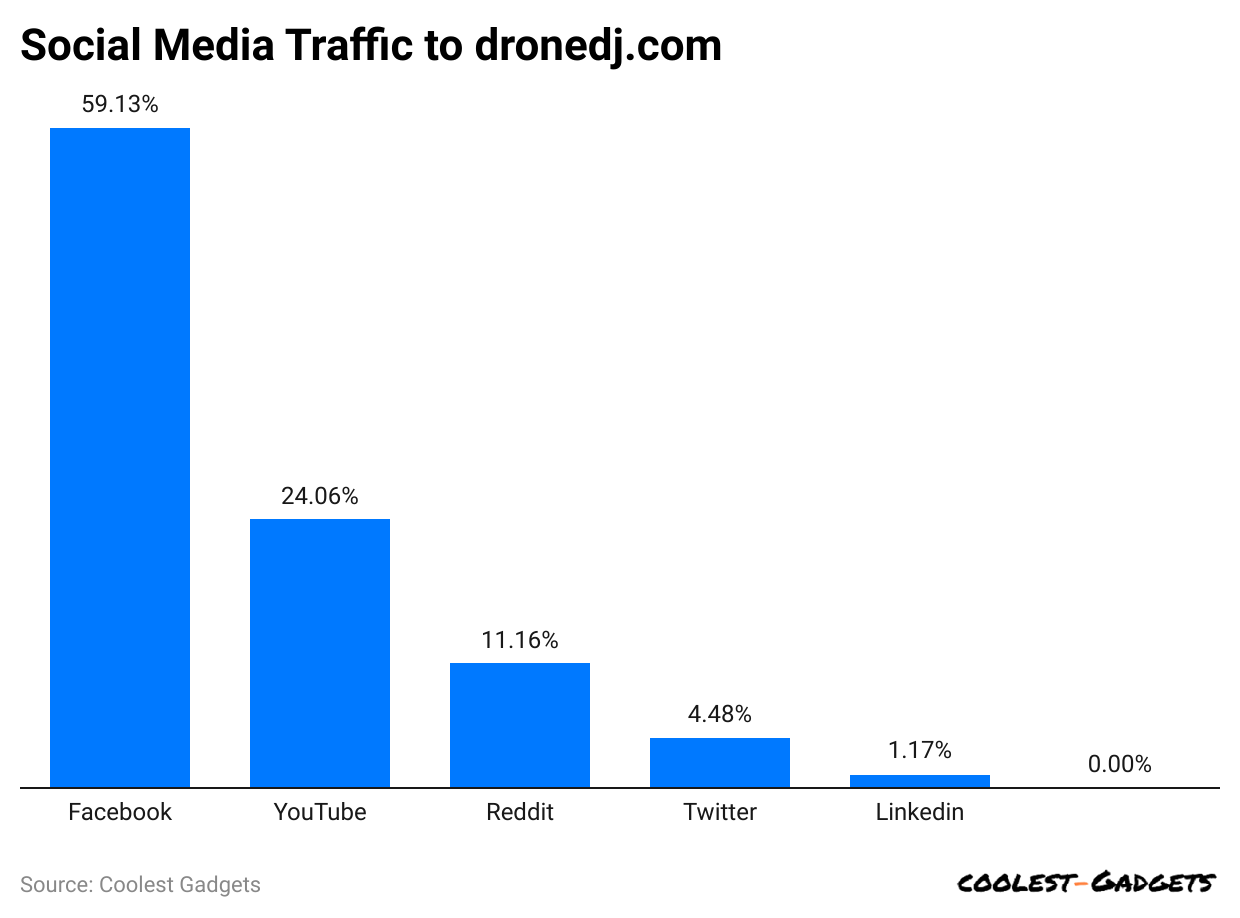
(Reference: similarweb.com)
- On the dronedj.com website, Facebook recorded the highest social networking share, 59.13%.
- YouTube and Reddit contribute 24.06% and 11.16% of social traffic share, respectively.
- Other traffic shares of social media are Twitter (4.48%) and LinkedIn (1.17%).
Conclusion
Drones are used in various fields such as industrial business, construction sites, healthcare, agriculture, and package delivery. The drone industry is expanding rapidly, and it’s difficult to predict how much it will grow in the future.
This article presents drone statistics including current trends, market share, types, usage, manufacturers, website traffic, and facts. Take a close look at each insight in the paper to gain a better understanding of the market.
Sources
Barry Elad is a tech enthusiast passionate about exploring various technology topics. He collects key statistics and facts to make tech easier to understand. Barry focuses on software and its benefits for everyday life. In his free time, he enjoys creating healthy recipes, practicing yoga, meditating, and walking in nature with his child. Barry's mission is to simplify complex tech information for everyone.