Mobile Payments Statistics By Most Demanded Mobile Banking Features, Most Used Mobile Payment Apps and Facts

Updated · Mar 17, 2025


TABLE OF CONTENTS
- Introduction
- Editor’s Choice
- General Mobile Payments Statistics
- By Most Demanded Mobile Banking Features
- By Most Used Mobile Payment Apps
- By Most Common Online Payments by Type
- By Region
- By QR Code Transactions
- Following are the Numbers for the QR Payment Market Size
- By Attitude
- By Reasons Not to Use Mobile Payments
- By Locations of Payments
- By Demographics
- The Impact of Digital Wallets on Generations
- By Reason to Use Mobile Payments
- By Country
- By Adoption Rate
- By App Market in the USA
- Conclusion
Introduction
Mobile Payments Statistics: Digitalization and mobile payments have been a boon to society. Mobile payments allow for cashless transactions at local shops and online stores, as well as an easy way to transfer money to family and friends. Trending apps such as Apple Pay, Google Pay, and PayPal are widely used in different parts of the world.
Mobile payments do not require an OTP and can be completed by scanning a QR code. The awareness of cashless payments has significantly increased after COVID-19. The following Mobile Payment Statistics provide an overview of the current position in the global market.
Editor’s Choice
- Research suggests that by the end of 2025, this payment method is projected to surpass traditional options like cards and cash
- As of 2023, 66% of restaurants in the United States of America accept mobile payments.
- 24% of consumers in hospitality businesses, Google Pay, and Apple Pay have frequent users.
- As of September 2023, Alert when SSN has been breached is the most demanding feature by Americans, resulting in 55%.
- Apple Pay, Cash App, and PayPal were the most used mobile payment apps in the United States of America, contributing 59%, 59%, and 58% of the share.
- The largest transaction volume is captured by Apple Pay in the United States of America, resulting in 55.8 million consumers in 2023.
- Considering the global comparison of mobile POS payments, the highest transaction value is expected to be generated from China resulting in USD 1,721 billion in 2024.
- The total number of users in the American market is expected to reach 219.9 million by 2027.
- The American Mobile POS Payments market is valued at USD 0.98 trillion in 2024 and is expected to grow at a CAGR of 17.01% reaching 1.57 trillion by 2027.
- The average transaction value per person in the United States of America is USD 5.40k in 2024.
You May Also Like To Read
- Amazon Pay Statistics
- QR Code Usage Statistics
- Alipay Statistics
- Digital Banking Statistics
- Stripe Statistics
- PhonePe Statistics
- Day Trading Statistics
- Money Laundering Statistics
- FinTech Statistics
General Mobile Payments Statistics
- As of 2022, worldwide mobile transactions were valued at USD 2 trillion.
- According to Mobile Payments Statistics, the global market is expected to grow at a CAGR of 36.2% between 2023 and 2030.
- As of 2023, 66% of restaurants in the United States of America accept mobile payments.
- As of today, there are 44% of men and 26% of women using mobile apps for payments.
- Currently, more than 53% of Americans are using digital wallets instead of traditional payment methods, such as physical cards or cash.
- The largest transaction volume is captured by Apple Pay in the United States of America resulting in 55.8 million consumers in 2023.
- 47% of cybersecurity professionals were doubtful about mobile payments security.
- 24% of consumers in hospitality businesses, Google Pay, and Apple Pay have frequent users.
- Mobile Payments Statistics 2024 states that by 2025, this method of payment is expected to overtake other payment methods such as cards and cash.
- The total number of mobile payment users in the United States is expected to reach 92.3 million by 2025.
- In 2023, the total mobile payments touched the value of USD 1 trillion.
- According to a survey by Dataprot.net, 79% of smartphone users have made payments through their smartphones in the last 6 months.
- According to the Mobile Payments Statistics, in 2026, the transaction value of mobile payments is expected to increase by 24% from 13% while for cash payments it will reduce to 22% from 31%.
- 53% of Americans use mobile payments more than traditional ones, while only 34% use traditional payment methods widely.
By Most Demanded Mobile Banking Features
 (Reference: insiderintelligence.com)
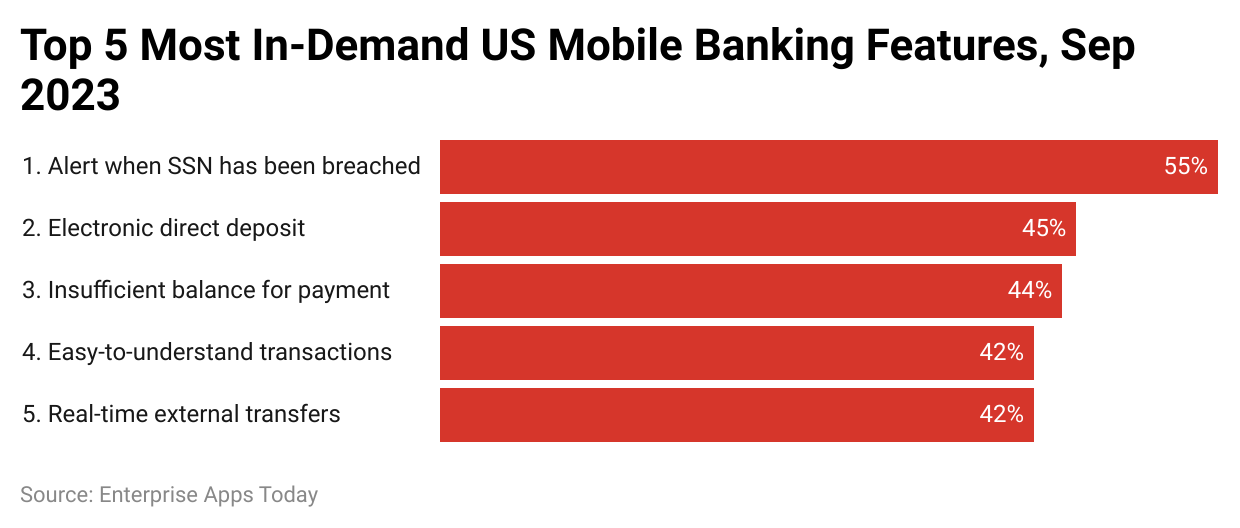
- As of September 2023, Alert, when SSN has been breached, is the most demanding feature by Americans resulting in 55%.
- Other extremely valuable features include electronic direct deposit (45%), insufficient balance for payment (44%), easy-to-understand transactions (42%) and real-time external transfers (42%).
By Most Used Mobile Payment Apps
 (Reference: statista.com)
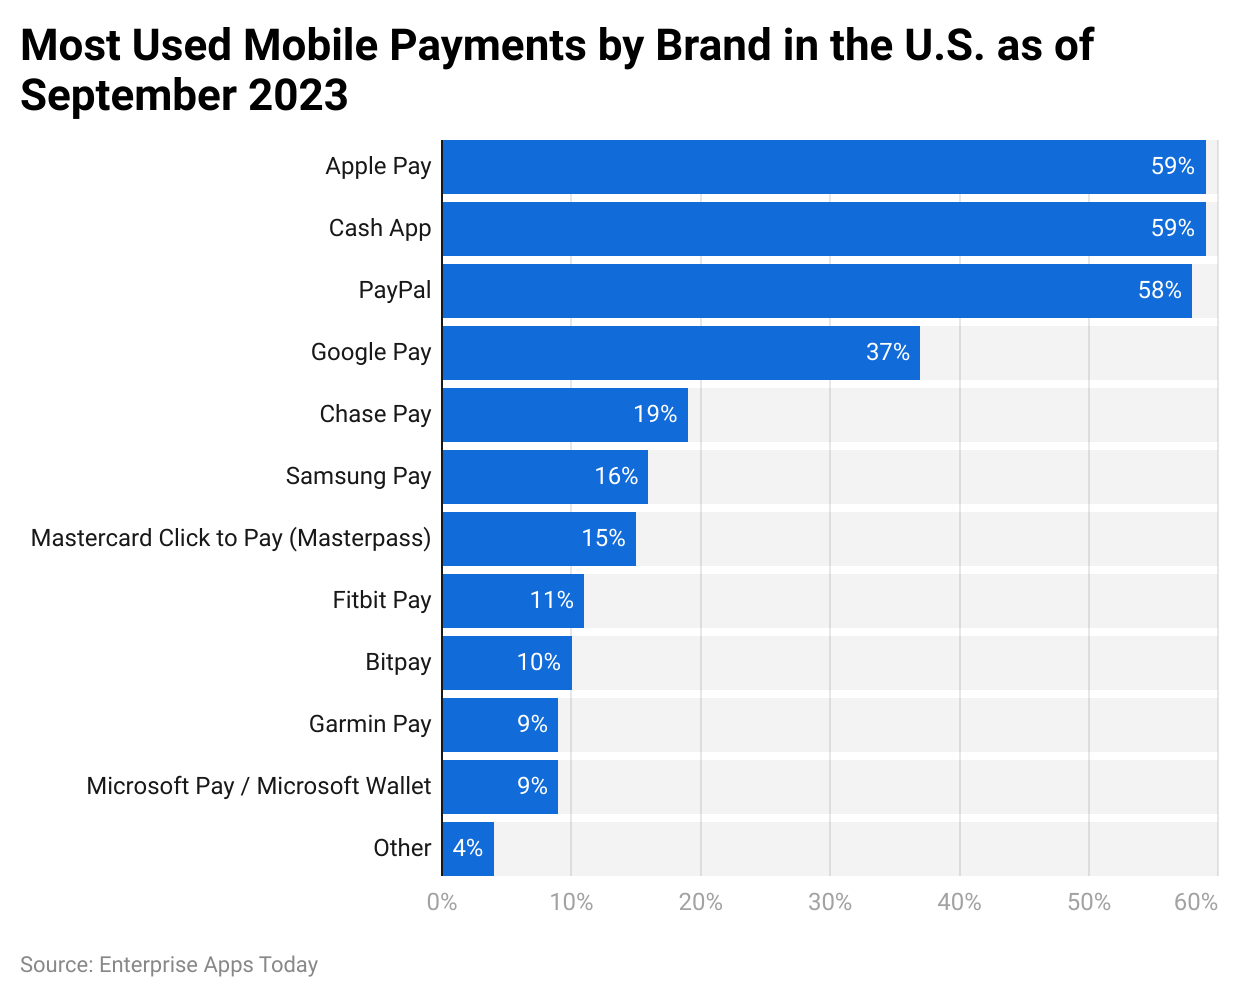
- According to Mobile Payments Statistics 2023, Apple Pay, Cash App, and PayPal were the most used mobile payments apps in the United States of America contributing 59%, 59%, and 58% of the share.
By Most Common Online Payments by Type
 (Reference: statista.com)
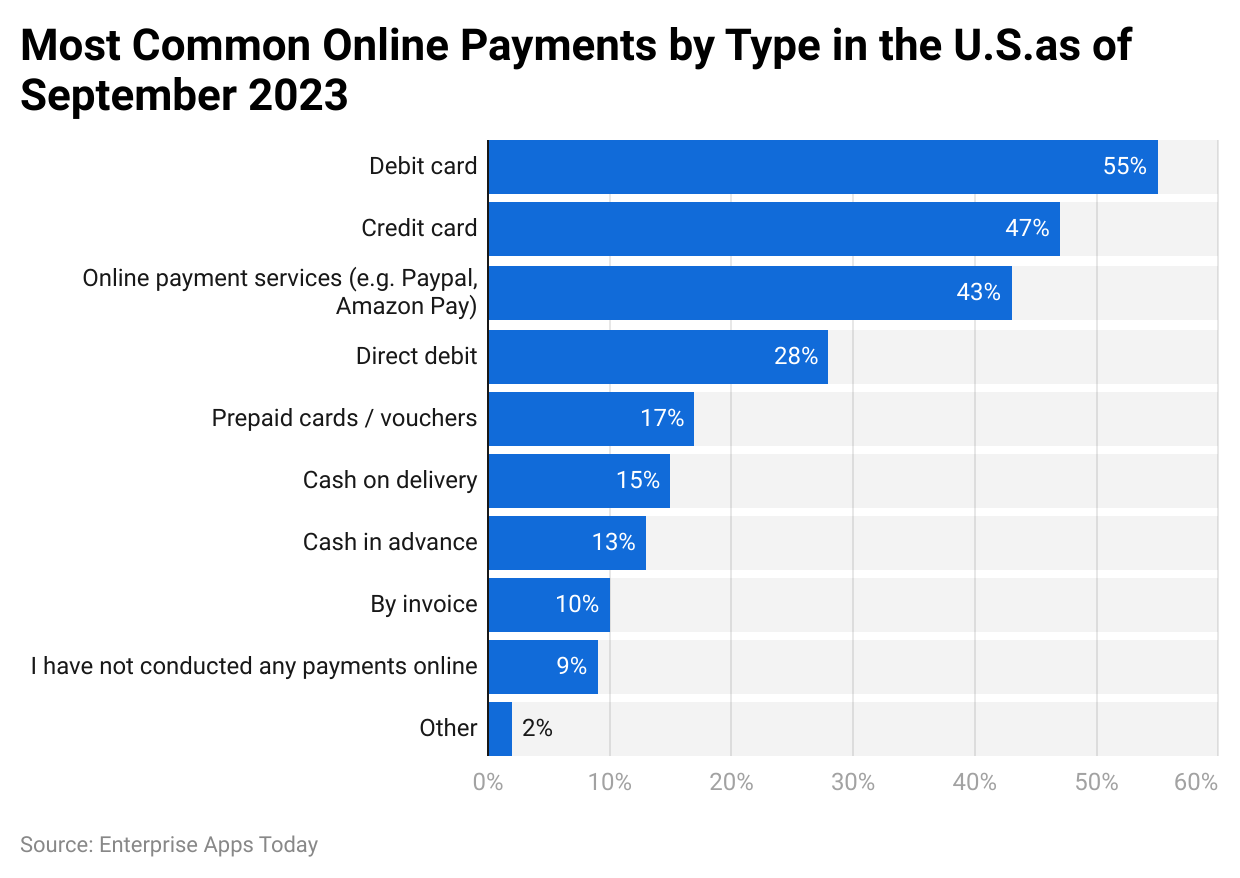
- As of 2023, in the USA, debit card payment was the most common payment method resulting in 55% of users, followed by Credit card (47%) and online payment services such as Amazon Pay and PayPal (43%).
- On the other hand, there are still 9% of Americans using traditional payment methods such as cash without using any online payment.
By Region
Worldwide
- Worldwide, mobile POS payments (Point of Sale) are expected to be valued at USD 3.78 trillion in 2024.
- The transaction value is projected to grow at a CAGR of 13.45%, reaching USD 5.52 trillion, between 2024 and 2027.
- Considering the global comparison of mobile POS payments, the highest transaction value is expected to be generated from China resulting in USD 1,721 billion in 2024.
- The average transaction value per person is projected to be USD 2.25k.
- By 2027, the total number of mobile POS Payment users is projected to reach 1.9
billion.
Asia
- The average transaction value per person in the Asian Mobile POS payments market is expected to be USD 1.64k in 2024.
- Furthermore, the Asian mobile POS Payments market is projected to reach USD 2.00 trillion growing at a CAGR of 10.25% and reaching USD 2.68 trillion by 2027.
- The total number of users in the market will reach 1.4 billion by 2027.
America
- The American Mobile POS Payments market is valued at USD 0.98 trillion in 2024 and is expected to grow at a CAGR of 17.01% reaching 1.57 trillion by 2027.
- The average transaction value per person is USD 5.40k in 2024.
- The total number of users in the same market is expected to reach 219.9 million by 2027.
Africa
- The African Mobile POS Payments market is expected to reach USD 158.60 billion by 2027 growing at a CAGR of 17.74%, which is currently valued at USD 97.18 billion.
- The average transaction per person value is projected to amount to USD 0.76k in 2024.
- Furthermore, the total number of users is expected to reach 169.2 million by 2027.
Europe
- As of today, the average transaction value per user in the European market is projected to be USD 4.35k.
- Furthermore, the total number of users is expected to reach 170.1 million by 2027.
- The European Mobile POS payments market is currently valued at USD 648.10 billion and is expected to reach 15.82% growing at a CAGR of 15.82%.
By QR Code Transactions
 (Reference: statista.com)
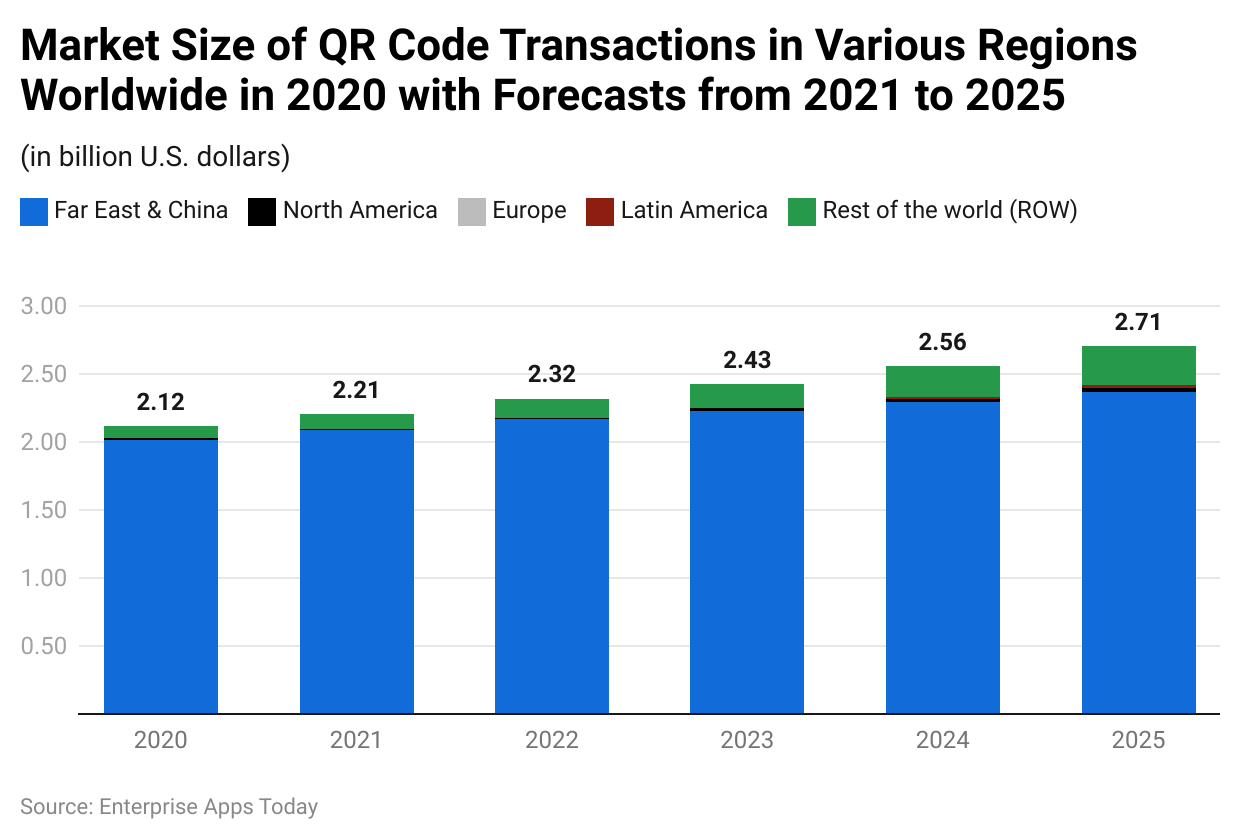
- Considering the Mobile Payments Statistics of QR code payments, by 2025, the QR transactions market size will be the highest in the Far East and Chinese region as compared to other regions.
- Even in the last 4 years of analysis, it has been constant for the Far East and Chinese region.
Following are the Numbers for the QR Payment Market Size
2023
- Far East and China (USD2.23 billion)
- North America (USD 0.02 billion)
- Europe (0)
- Latin America (0)
- Rest of the world (ROW) (USD 0.18)
2024
- Far East and China (USD 2.3 billion)
- North America (USD 0.02 billion)
- Europe (0)
- Latin America (USD 0.1 billion)
- Rest of the world (ROW) (USD 0.23 billion)
2025
- Far East and China (USD 2.37 billion)
- North America (USD 0.03 billion)
- Europe (0)
- Latin America (USD 0.02 billion)
- Rest of the world (ROW) (USD 0.29 billion)
By Attitude
 (Reference: forbes.com)
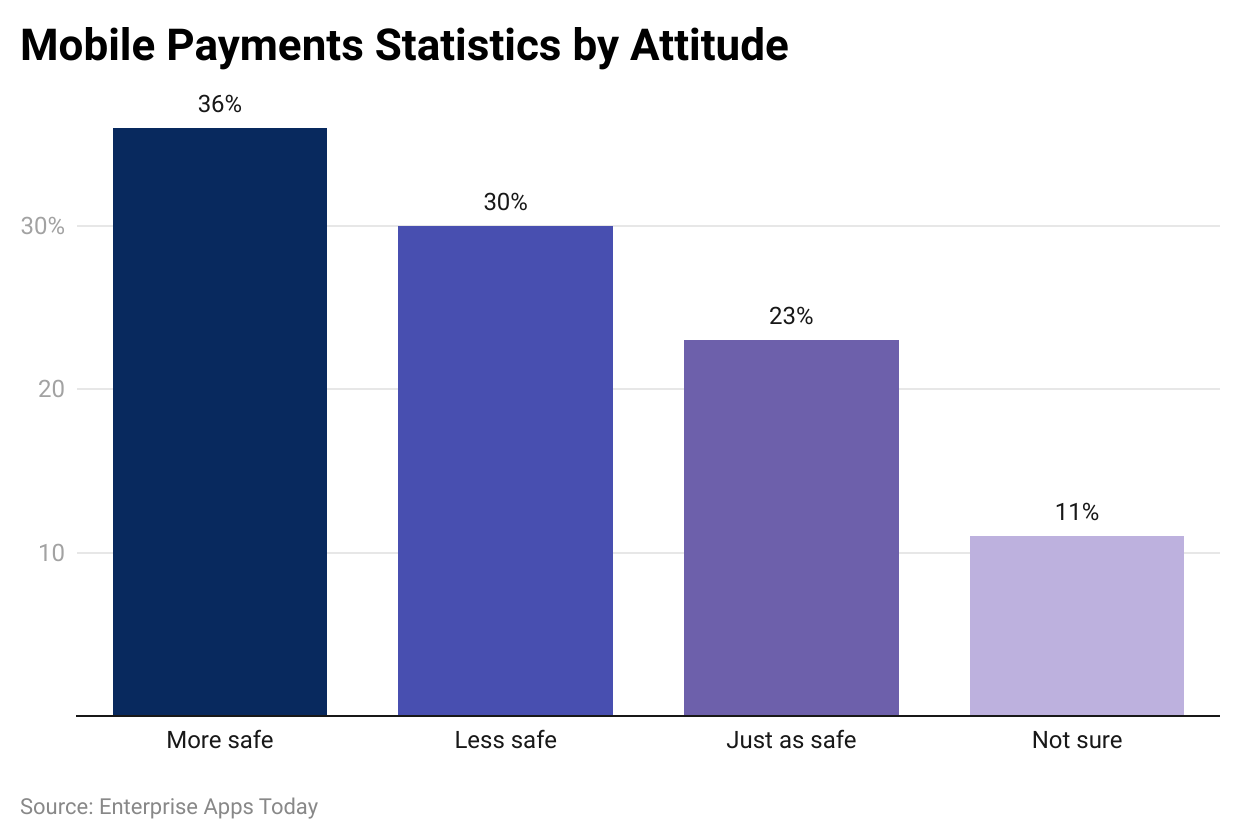
- According to a survey conducted by Forbes Advisor, 36% of respondents state that digital payments are safer than traditional payment methods, while 30% said they are less safe.
- 23% said the safety of both methods is equal. On the other hand, 11% of respondents had no opinions.
By Reasons Not to Use Mobile Payments
 (Reference: octalsoftware.com)
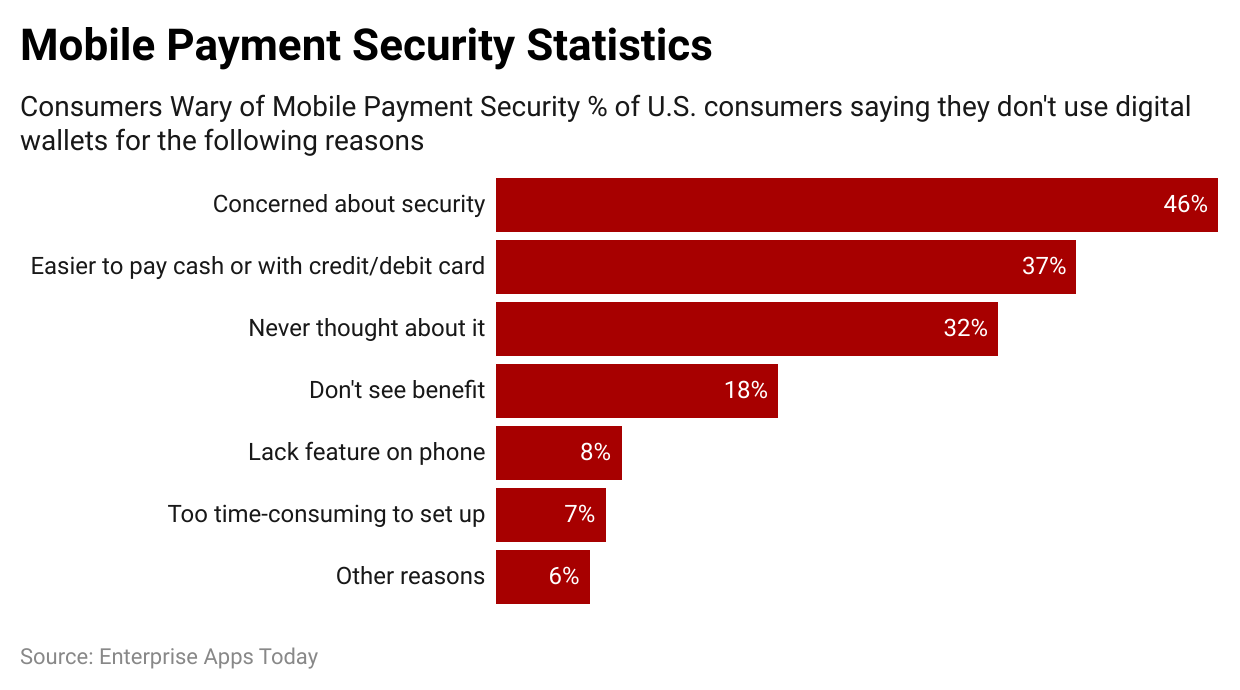
- As of 2023, the majority of mobile payment Americans were concerned about the security contributed by 46% therefore they did not prefer using it.
- Furthermore, 37% of Americans think it is easier to pay with cash or other means of payment such as credit or debit cards.
- However, 18% of them don’t think it is a beneficial factor and 32% just never thought about it.
- 8% of Americans don’t own compatible mobiles. On the other hand, 7% said the setup is too time-consuming.
By Locations of Payments
- Drugstores and pharmacies (53%)
- Department stores (50%)
- Online retailers (50%)
- Events (49%)
- Restaurants and bars (47%)
(Source: forbes.com)
- The majority of the consumers use mobile payments in drugstores or pharmacies resulting in 53%, while half of them use it at department stores or online retailers (50%).
- Around 49% use digital wallets at events while nearly 47% use them at restaurants and bars.
By Demographics
- 18-34 – 72%
- 35-44 – 75%
- 45-64 – 56%
- 65+ – 37%
(Source: aba.com)
- As of 2023, users aged between 35 to 44 years are more likely to use mobile payment apps as compared to other age groups.
- There are 37% of users aged 65 years and above, while 72% and 56% respectively belong to 18 to 34 years and 45 to 65 years.
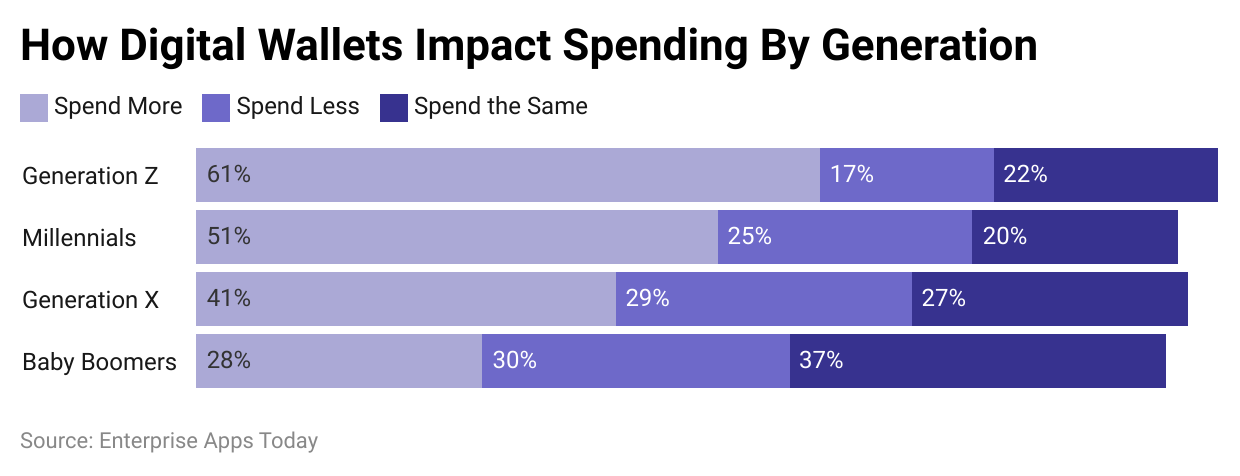
The Impact of Digital Wallets on Generations
 (Reference: forbes.com)
- The convenience of digital wallets or mobile payments has increased the spending habits of consumers in Gen Z at 61% as compared to baby boomers at 28%.
- On the other hand, 37% of users have not changed their habits spending from the Baby Boomers generation which is similar to 27% in Gen X.
You May Also Like To Read
- Small Business vs Large Corporations Statistics
- Car Loan Statistics
- Mergers and Acquisitions Statistics
- Application Revenue Statistics
- ATM Statistics
- Crowdfunding Statistics
- Paid Holiday Statistics
- GoFundMe Statistics
- Cryptocurrency Statistics
- InstaCart Statistics
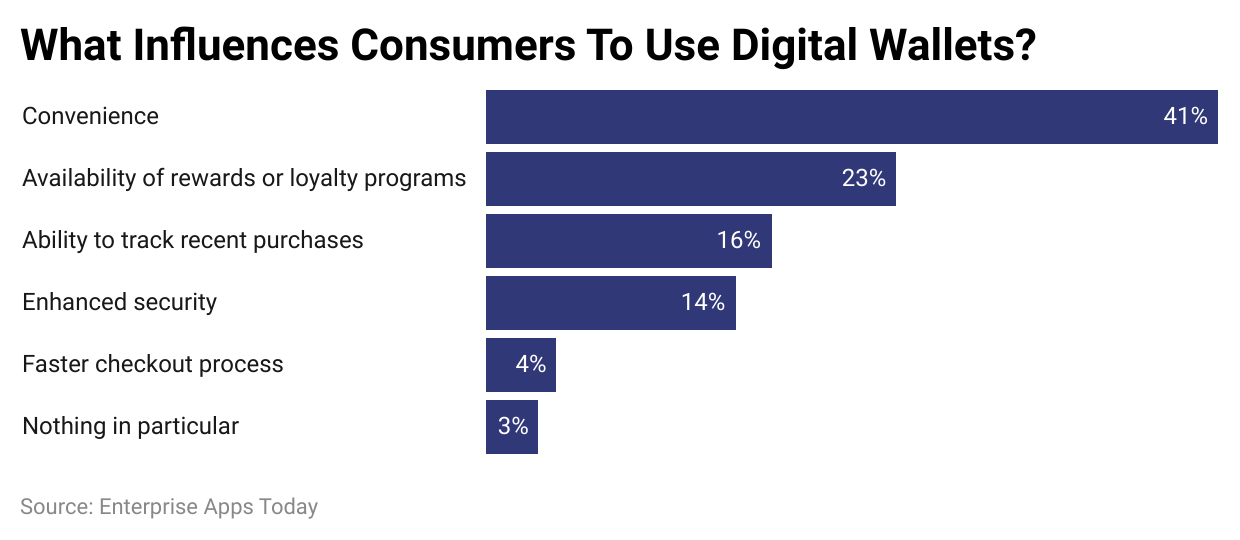
By Reason to Use Mobile Payments
 (Reference: forbes.com)
- As of 2023, the major reason to use a digital wallet is convenience (41%). 23% of consumers use it for getting rewards or loyalty programs, while 16% make use of it to track their recent spending.
- Only 3% of users stated nothing in particular reason for using mobile payment.
By Country
| Country | Mobile Payment Penetration (%) | Mobile Payment Transaction Volume (Billions USD) | Mobile Payment Growth Rate (%) | Popular Mobile Payment App |
|---|---|---|---|---|
| India | 80% | USD 75.5 | 22% | Paytm |
| China | 87% | USD 49,221.6 | 25% | Alipay |
| USA | 45% | USD 312.6 | 18% | Apple Pay |
| UK | 60% | USD 98.9 | 15% | PayPal |
(Reference: octalsoftware.com)
- According to Mobile Payments Statistics 2023, the majority of mobile payment penetration is seen in the Chinese region resulting in 87% with a transaction value of USD 49,221.6.
- Alipay is the most preferred mobile payment method with a growth rate of 25% in the market.
- Other top 2 countries with the largest penetration are India (80%) and the United Kingdom (60%), with Paytm and PayPal trending mobile payment apps.
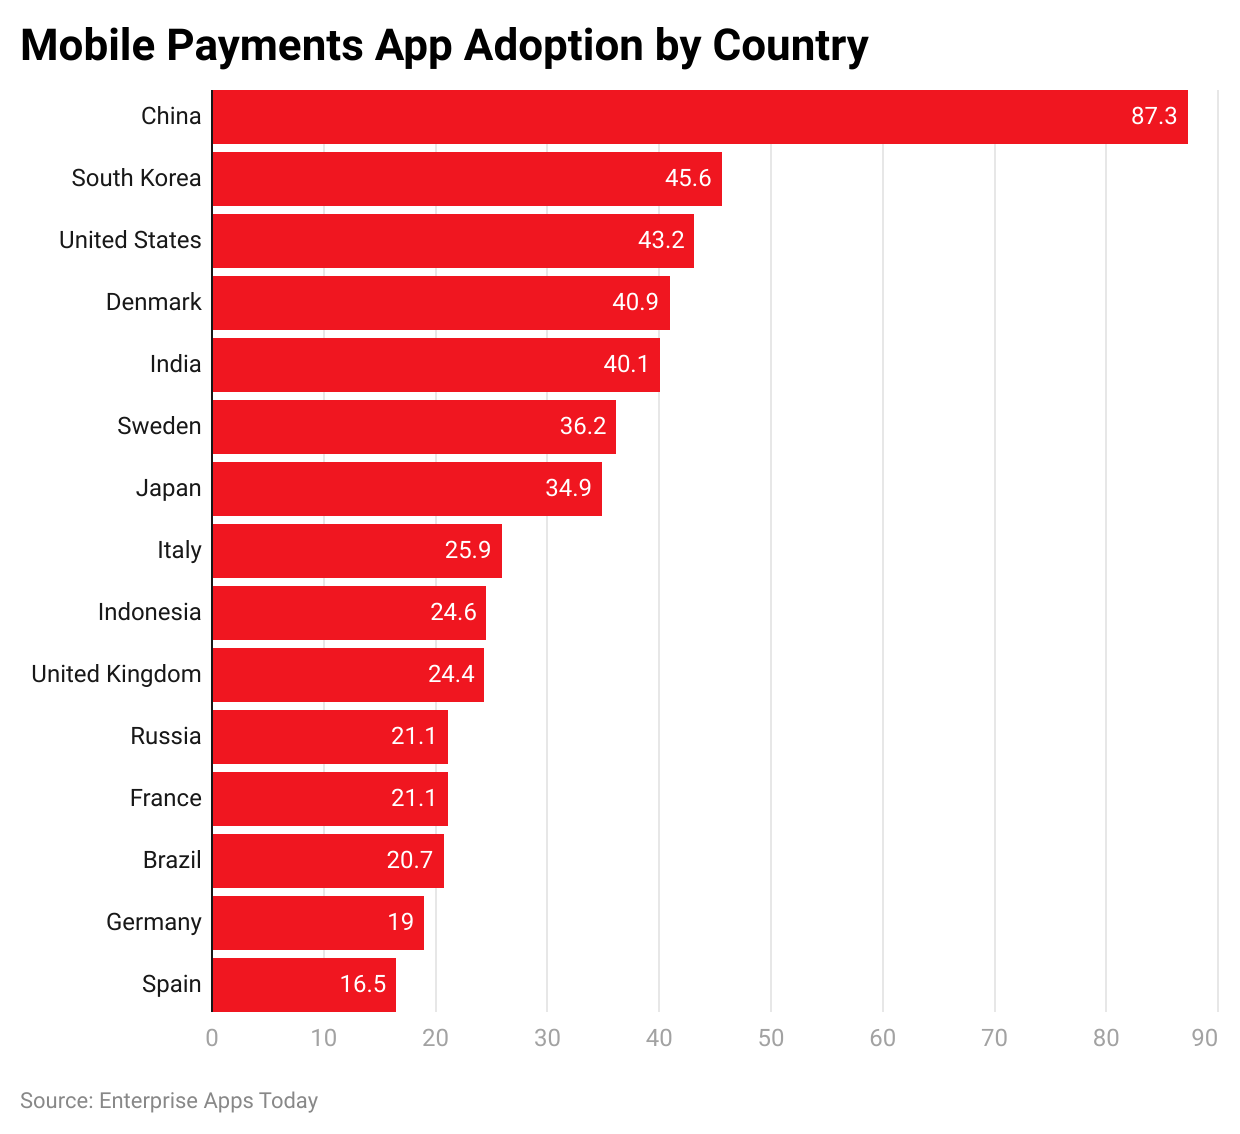
By Adoption Rate
 (Reference: businessofapps.com)
- As of 2024, China, South Korea, and the United States of America are the top 3 countries with the highest adoption rate for mobile payments resulting in 87.3%, 45.6%, and 43.2% respectively.
- Overall, the adoption rate for mobile payments in other countries is much lower than 50%.
- The lowest rate is observed in Spain contributing by 16.5%.
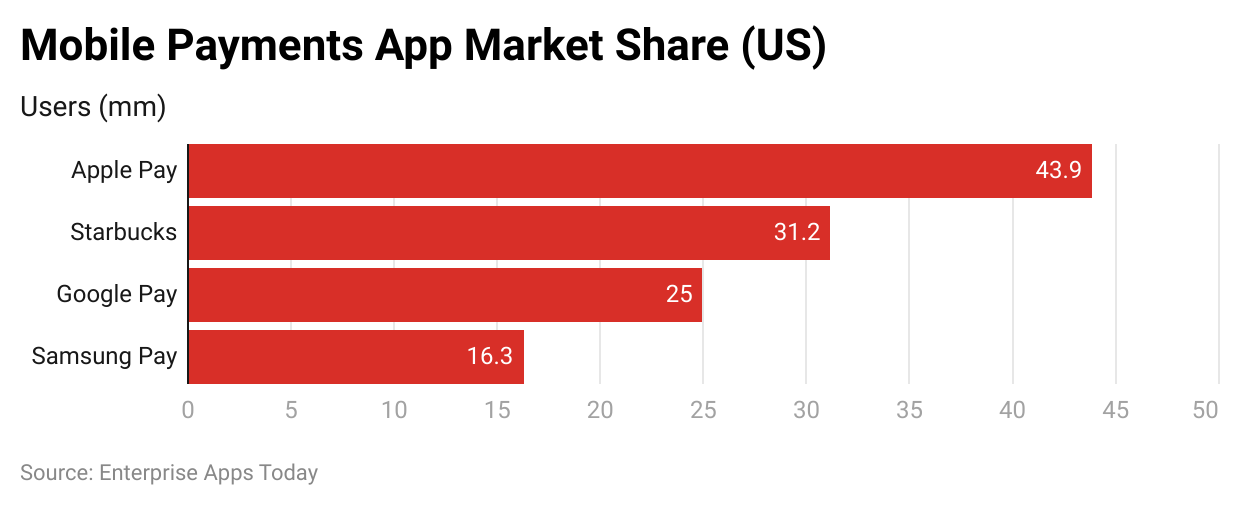
By App Market in the USA
 (Reference: businessofapps.com)
- As of 2023, Apple Pay was the leading mobile payment app with 43.9% of users in the USA.
- Other apps with a large number of Americans using them were Starbucks (31.2%), Google Pay (25%), and Samsung Pay (16.3%).
Conclusion
After COVID-19, there has been a surge in mobile payments throughout the world. And even four years after the pandemic, people are still using this payment method because it is the easiest way to make payments. Over the years, Mobile Payments Statistics state that there will be a heavier reduction in traditional payment methods such as debit cards or cash payments.
As of today, mobile payments are limited to local payments only and do not have any international payment options through QR code scanning. However, soon, countries with increasing digitization will be able to make international payments through mobile payments.
Sources
Pramod Pawar brings over a decade of SEO expertise to his role as the co-founder of 11Press and Prudour Market Research firm. A B.E. IT graduate from Shivaji University, Pramod has honed his skills in analyzing and writing about statistics pertinent to technology and science. His deep understanding of digital strategies enhances the impactful insights he provides through his work. Outside of his professional endeavors, Pramod enjoys playing cricket and delving into books across various genres, enriching his knowledge and staying inspired. His diverse experiences and interests fuel his innovative approach to statistical research and content creation.