QR Code Usage Statistics By Usage Rate, Reasons To Scan, Demographics and Frequency Of Usage

Updated · Feb 13, 2025


TABLE OF CONTENTS
- Introduction
- Editor’s Choice
- History of QR Code
- General QR Code Usage Statistics
- By Usage Rate
- By Creation
- By Industry
- By Region
- By Reasons To Scan
- By Location
- By Demographics
- Common Digital Habits When Shopping In-Store
- By Frequency Of Usage
- By Technical Solutions To Replace Passwords
- By Highest Number Of QR Code Payment Mobiles Devices
- Most Popular QR Code Solutions
- By Applications
- Worldwide Penetration Rate Of Mobile POS Systems
- Conclusion
Introduction
QR Code Usage Statistics: The integration of QR codes into daily transactions has transformed the way we interact with services, providing a seamless and contactless option that appeals to everyone, including introverts who prefer less direct social interactions. This technology, which enables users to scan QR codes for everything from ordering at restaurants to booking tickets for shows and events, has seen a significant surge in usage since the onset of COVID-19. According to the QR Code Usage Statistics 2023, this trend is not only enhancing the dining and entertainment experience but also bolstering the mobile payment market.
Globally, smartphone ownership has reached impressive levels, with 83.72% of the population owning a smartphone as of 2022, a figure that encompasses 6.64 billion devices. This number is expected to grow to 7.33 billion by 2025, indicating a potential increase in mobile engagements through QR codes. Furthermore, 84% of mobile users have interacted with a QR code at least once, with 72% scanning a QR code monthly and 32% weekly, underscoring the widespread adoption and regular use of this versatile technology.
Editor’s Choice
- An estimated 89.5 million Americans are expected to use their smartphones to scan QR codes by 2024.
- In 2022, QR code creation in the United States increased by 248% over the previous year, with more than 200,000 new QR codes generated.
- The QR code labels market is projected to reach USD 2.1 billion by 2027, growing at a CAGR of 8.9%.
- A significant increase in QR code scanning was noted in 2023, with a 43% rise in new QR codes created.
- Marketing and advertising sectors saw a tremendous 323% increase in QR code scanning in 2023, highlighting their growing role in these industries.
- China is expected to lead in QR code transaction value, with a projected USD 1,721 billion, underscoring the vast scale of QR code use in financial transactions.
- The worldwide redemption of QR code coupons is set to reach USD 5.3 billion by 2025, showing the potential of QR codes in marketing and sales.
- The global population’s smartphone ownership was 83.72% in 2022, expected to rise with 7.33 billion smartphones in use by 2025.
- QR codes remain popular for website access, with over 60% of corporations using them to direct customers to their sites.
- In the food and beverage industry, 75% of restaurants use QR codes for menu access, reducing menu printing costs by 30% and boosting customer engagement by 40%.
- QR codes are also widely used for downloading apps, with 65% of companies reporting a 45% increase in app downloads.
- Social media QR codes are employed by 70% of brands, enhancing social media engagement and increasing follower counts by 35%.
- Black is the most preferred color for QR codes, chosen by 85% of users.
- In American restaurants, 45% of customers use QR codes to access menus, showing a split preference with paper menus.
- By 2033, the marketing industry is expected to play a significant role in the QR code sector, indicating long-term growth and integration strategies.
You May Also Like To Read
- Mobile Payments Statistics
- Amazon Pay Statistics
- Alipay Statistics
- Digital Banking Statistics
- Stripe Statistics
- PhonePe Statistics
- Day Trading Statistics
- Money Laundering Statistics
- FinTech Statistics
History of QR Code
- In 1994, a Japanese team at Denso Wave invented QR codes to track auto parts more easily during manufacturing.
- QR codes can hold much more data than traditional barcodes and are quicker to scan.
- By 2000, the International Standards Organization (ISO) made QR codes a global standard.
- The first phone with a built-in QR code scanner, the SHARP J-SH09, launched in Japan in 2002.
- Third-party QR code reader apps soon followed, making it easy for anyone to scan QR codes.
- In 2010, QR codes began to gain traction in the U.S. when Best Buy used them to provide product details to customers.
- A year later, in 2011, Android’s QR Droid app allowed phones to read QR codes using their cameras.
- This led to other scanning apps like QR BARCODE SCANNER and QR Reader for iOS.
- In 2014, Denso Wave introduced Frame QR codes, blending design elements with functionality.
- These new QR codes could include brand logos and were used in marketing to attract customers.
- From 2015 to 2019, mobile boarding pass usage in the airline industry jumped from 0.75 billion to 1.5 billion.
- The COVID-19 pandemic in 2020 spurred a major increase in QR code use for contactless payments, rising nearly 50%.
- Today, QR codes are widely used in marketing for exclusive offers, website access, contactless menus, and event ticketing.
- Predictions show QR code usage will continue to grow significantly until at least 2025, helping bridge online and in-person interactions.
General QR Code Usage Statistics
- According to QR Code Usage statistics, the global spending using the same in 2022 contributed $2.4 trillion.
- By 2025, the global spend with QR Code payment is estimated to be $3 trillion.
- In France, 2 out of 3 users have scanned QR codes at least once in their lifetime.
- The QR Code coupon redemption market is estimated to reach $5.3 billion worldwide by 2025.
- Around the industry, 40% of worldwide QR Code scans are contributed to marketing campaigns.
- Over the past few years, QR code scans increased by more than 50% in 50 countries.
- As of today, 58% of people around the world are still not aware of the QR code’s functionality.
- As per QR Code Usage Statistics, 84.62% of people have scanned at least once in their life.
- By 2025, estimates of QR code usage state that, the number of smartphone users scanning the codes will reach 99.5 million in the USA.
- 45% of American shoppers have used the QR Code for marketing-related purposes.
- QR codes are a major decision-making factor for buyers of FMCG products.
- Furthermore, QR codes on FMCG products are more likely to improve customer engagement.
- Investment in QR code technology is estimated for a 23.7% Return on investment.
- The marketing industry is estimated to be significant in the QR code industry by 2033.
- The median household income per annum of a QR code user in the USA is $67,000.
- United States, Canada, Australia, United Kingdom, United Arab Emirates, Mexico, India, Singapore, Netherlands, and Philippines were the top 10 countries with the most QR code creations in 2023.
- Honduras (625%), El Salvador (496%), The Bahamas (475%), French Guliana (200%), and Curaçao (100%) were the top 5 CAM and LATAM countries with the highest QR code adoption rates.
- 87.% of users around the world feel QR codes are easy to use.
- On average, online shoppers who redeem the QR code offer to spend $16.74 per user.
- 42% of brands that use mobile marketing have QR codes as a marketing strategy.
- Around 65% of Americans have seen at least 1 QR code in the past year.
- As of today, 27% of banks that have already incorporated the technology have increased their usage significantly.
- More than 70% of hotels have started using QR code-based bookings to simplify the reservation process.
- In 2023, around 46.5% of Americans scanned a QR code that appeared on TV, while 48.8% did the opposite.
- eCommerce websites without any QR payment are more likely to lose 80% of potential customers.
- Around the world in 2023, 44.6% of internet users used QR Code scans.
By Usage Rate
- QR code scanning in marketing and advertising increased by 323% worldwide in 2023.
- The consumer goods industry saw a 247% rise in QR code use during the same period.
- Over 50 countries recorded 26.95 million QR code scans last year.
- Smartphone use is mainly driving the surge in QR code popularity.
- The United States leads in QR code scans, jumping from 42.2% of the global total in 2022 to 43.9% in 2023.
- Industries like retail, restaurants, logistics, travel, and tourism are adopting QR codes rapidly.
- Retail and restaurant sectors are using QR codes to give customers fast access to product details, prices, and special offers.
- In logistics, QR codes streamline processes like inventory management and delivery.
- The travel and tourism industry uses QR codes for hotel check-ins, boarding passes, and tour information.
- Marketing and advertising are utilizing QR codes for promotions and augmented reality experiences.
- China, India, and Nigeria are the top three countries with the highest QR code usage.
- In China, QR codes are used for a variety of services, including portable charger rentals and grocery payments.
- India has integrated QR codes into daily activities like restaurant ordering and public transportation.
- In Nigeria, QR codes facilitate mobile payments and provide tourist information.
- Globally, 84% of mobile users have scanned a QR code at least once.
- Regular QR code scanning is common, with 72% of people scanning at least monthly and 32% scanning weekly.
By Creation
- In 2023, the Website was the most trending platform to create a QR code, resulting in PDF, Vcard, Feedback forms, and link pages.
By Business Size
 (Reference: uniqode.com)
- According to QR Code Usage Statistics 2023, mid-sized businesses experienced the highest YoY QR code creation growth contributing 278%. Individual businesses and large enterprises contributed 227% and 256%, respectively. On the other hand, small-scale businesses observed the lowest growth rate resulting in 151%.
By Industry
- The use of QR codes in marketing has skyrocketed by 323% from 2021 to 2023. This growth highlights their role in linking the digital and physical shopping experiences.
- In the consumer goods industry, QR code usage has jumped 247% since 2021. Brands are using QR codes to provide detailed information without overwhelming product packaging or advertisements.

- Lionsgate, a major film and TV company, successfully used QR codes to enhance its movie promotions. They collaborated with Uniqode, which provided detailed interaction data through QR codes, allowing Lionsgate to measure the success of their campaigns in 65 cities.
- Despite a 65% decrease in QR code use in the hospitality sector in 2023 due to automation like kiosks, QR codes are still prevalent in restaurants for contactless menus and customer feedback.
- The real estate industry has seen an 8% increase in QR code use since 2021. Realtors use QR codes to simplify access to property listings, making the buying process easier for clients.
- The finance sector has experienced an 18% rise in QR code adoption, enhancing services like loan applications and approvals through streamlined processes and improved security.
By Region
Worldwide
- The worldwide mobile POS Payments market in 2024 is valued at $3.78 trillion and is expected to grow at a CAGR of 12.76% reaching $6.11 trillion by 2028.
- The average transaction value per user worldwide is projected to be valued at $2.25k in 2024.
- Global comparison states that in the current year, China is estimated to generate the highest transaction value resulting in $1,721 billion.
- Furthermore, the total number of users in the market is projected to reach 2.01 billion by 2028.
Asia
- The average transaction value in the Asian mobile POS market is projected to amount to $1.64k in 2024.
- Furthermore, currently, it is estimated to reach $2.00 trillion growing at a CAGR of 9.83% reaching $2.91 trillion by 2028.
- By 2028, the total number of users in the market is expected to reach 1.42 billion.
Africa
- The average transaction value per user in the African market is projected to amount to $0.76k in 2024.
- Furthermore, the number of users is estimated to reach 179.30 million by 2028.
- In 2024, the market is valued at $97.18 billion.
- Moreover, between 2024 to 2028, the African mobile POS market is estimated to grow at a CAGR of 16.55% reaching $179.30 billion.
Americas
- In 2024, the American market is estimated to be valued at 0.98 trillion.
- Furthermore, it is estimated to grow at a CAGR of 16.09% reaching $1.79 trillion by 2028.
- The total number of users is projected to reach 231.10 million by 2028.
- Moreover, the average transaction value per user is estimated to be $5.40k in 2024.
Australia And Oceania
- The transaction value of Mobile POS Payments in the Australia and Oceania market in 2024 is estimated at $54.36 billion.
- Furthermore, between 2024 and 2038, it is predicted to grow at a CAGR of 18.34% reaching $106.60 billion.
- By 2028, the number of users is projected to reach 7.69 million and the average transaction value per use is projected to be $9.87k in 2024.
Europe
- Similarly, in 2024 the European market is projected to reach $648.10 billion, growing at a CAGR of 14.88% by 2028 reaching $1,129 billion.
- The number of users is projected to amount to 187.70 million by 2028, while in 2024 the average transaction value per user is $4.35k.
By Reasons To Scan
- 34% of users scan QR codes to verify the authenticity of the product and receive company information.
- Furthermore, 60% of customers scan for discounts and coupons.
- 57% of consumers scan food packaging to get information about the product.
- 75% of users usually scan QR codes on FMCG products.
By Location
To View Menus At A Restaurant
 (Reference: statista.com)
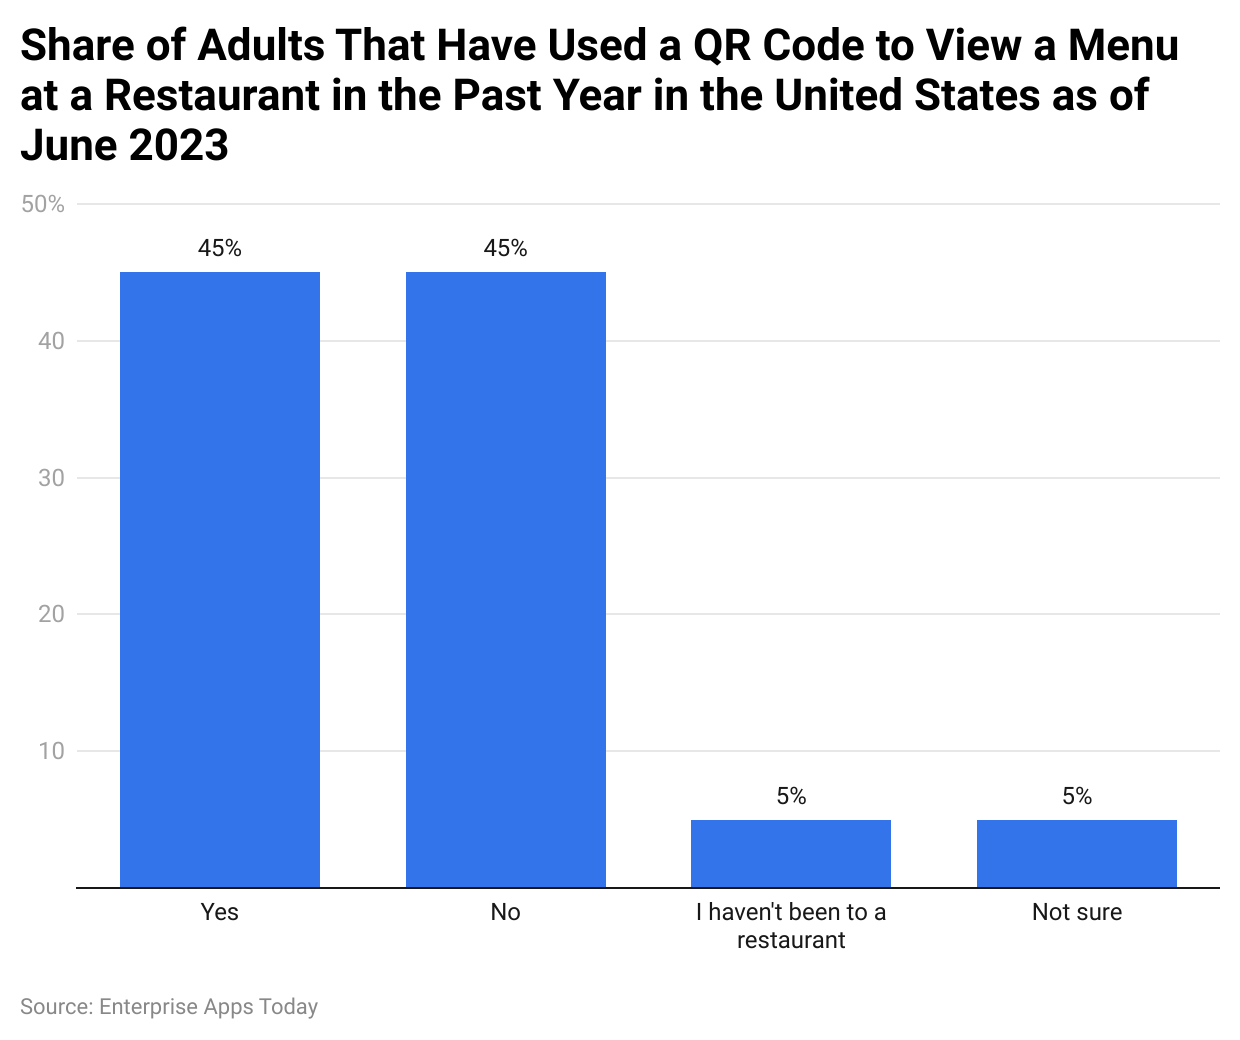
- QR Code Usage Statistics 2023 states that, according to a survey conducted by Statista, Americans equally voted for using it at restaurants and not using it as well contributing 45% each.
- Furthermore, with a similar number of respondents, 5% haven’t been to a restaurant that provides QR code-related services and equally are not sure.
By Preferred Menu Access Method
 (Reference: statista.com)
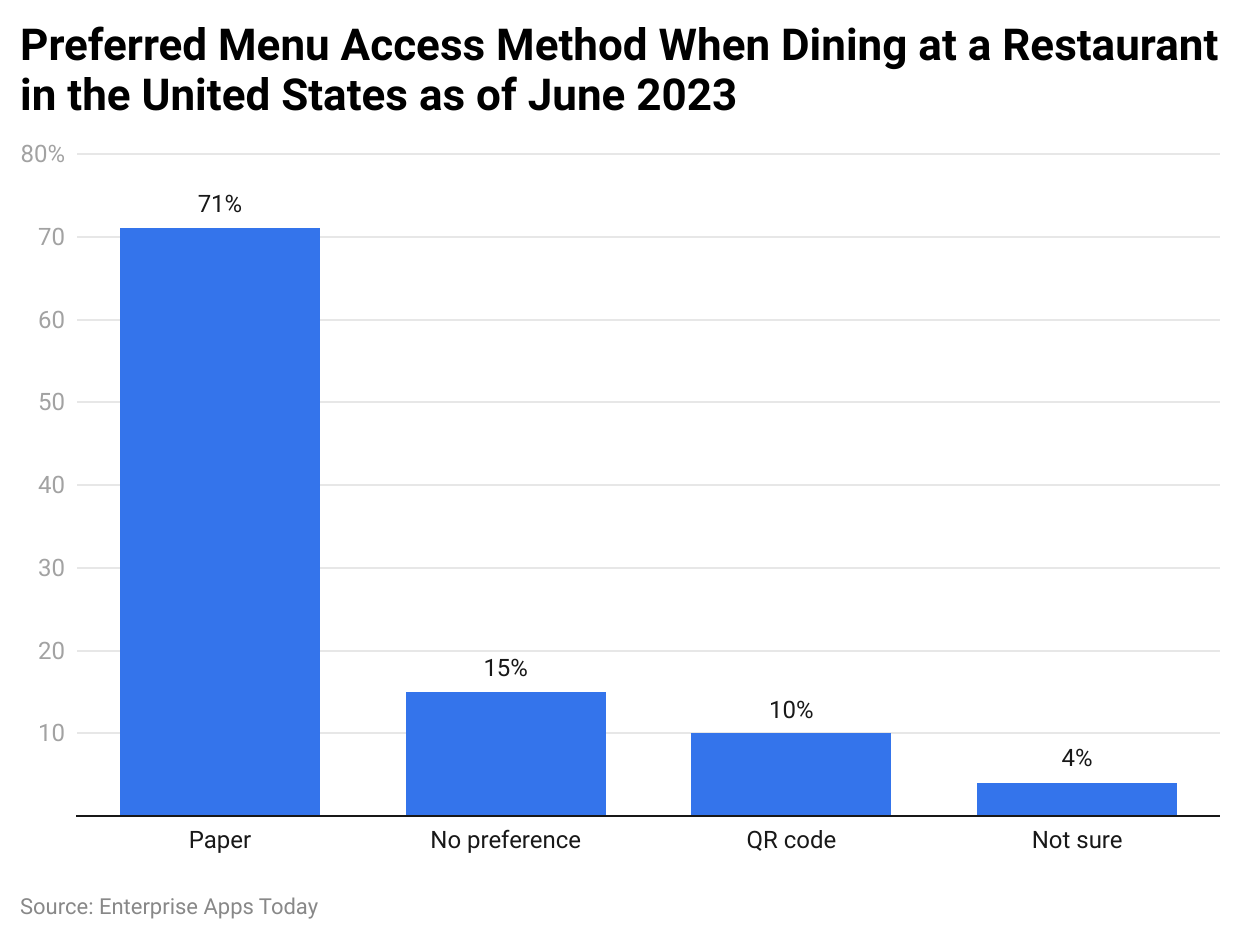
- As of June 2023, the most preferred method to access menus at restaurants by Americans was by paper. However, 10% of respondents to a survey by Statista stated to prefer QR codes. 15% have no preference while 4% were not sure.
By Demographics
By Gender
 (Reference: scantrust.com)
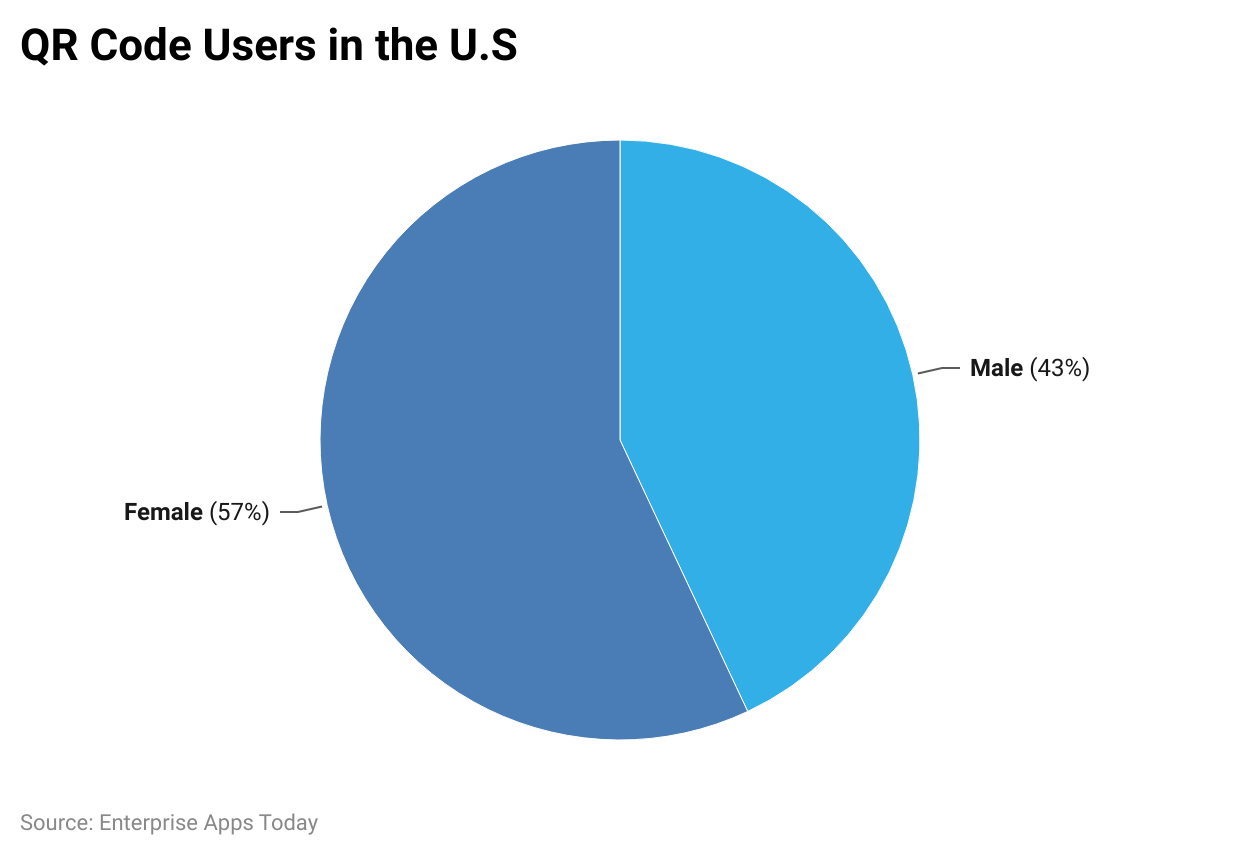
- QR Code Usage by Demographics 2023 states that, the share of female users scanning the QR codes is more compared to male users resulting in 57% to 43% respectively.
By Age
(Source: scantrust.com)
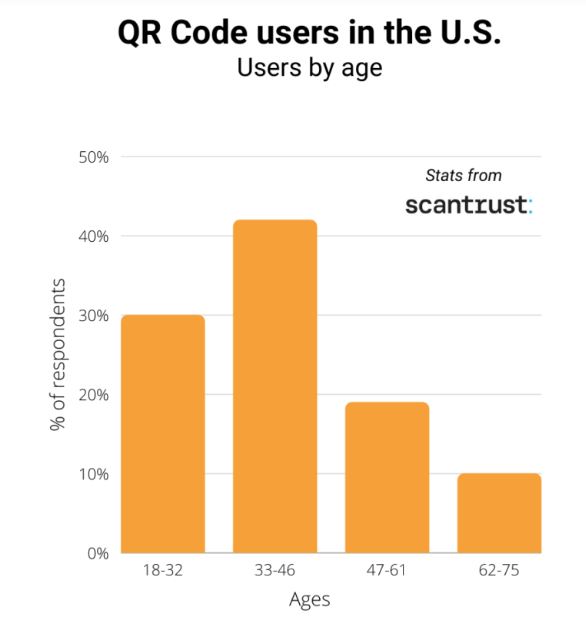
- As of today, the majority of the QR code users belong to the age group of 33 to 46 years resulting in 41%, followed by 18 to 32 years, 30%.
- Above 47 to 75 years, the percentage of users is less than 20%.
Common Digital Habits When Shopping In-Store
 (Reference: statista.com)
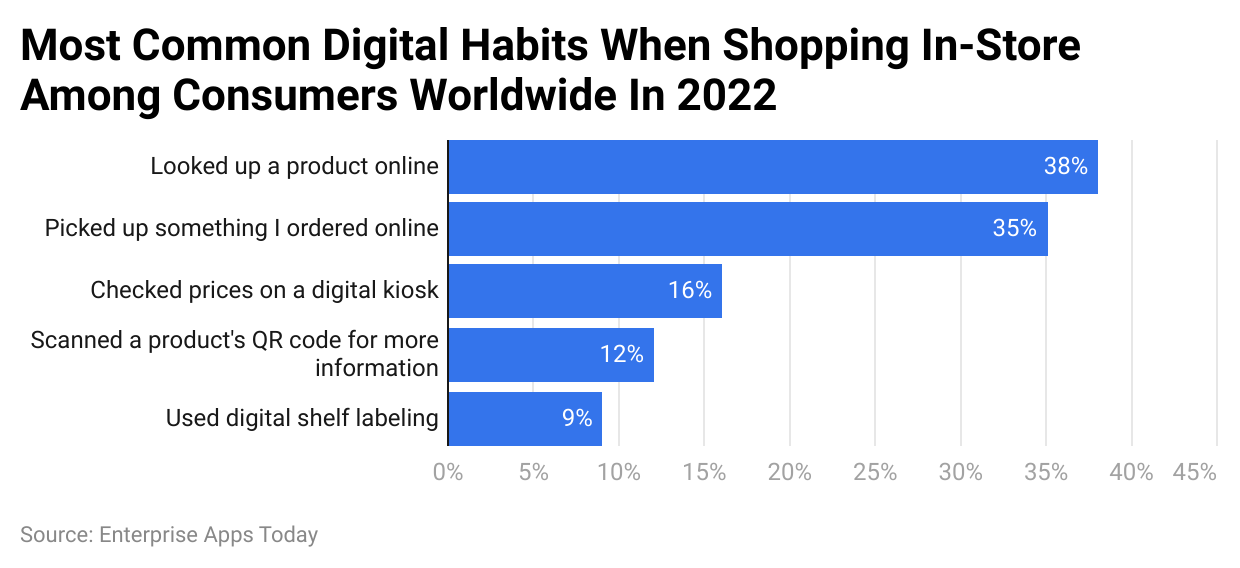
- In 2022, 12% of shoppers in corners of the world scanned product’s QR code for information. On the other hand, 38% looked up a product online while shopping in-store. 35% picked up something they ordered online, 16% went to the digital kiosk to check prices and 9% used digital self-labeling.
By Frequency Of Usage
 (Reference: scantrust.com)
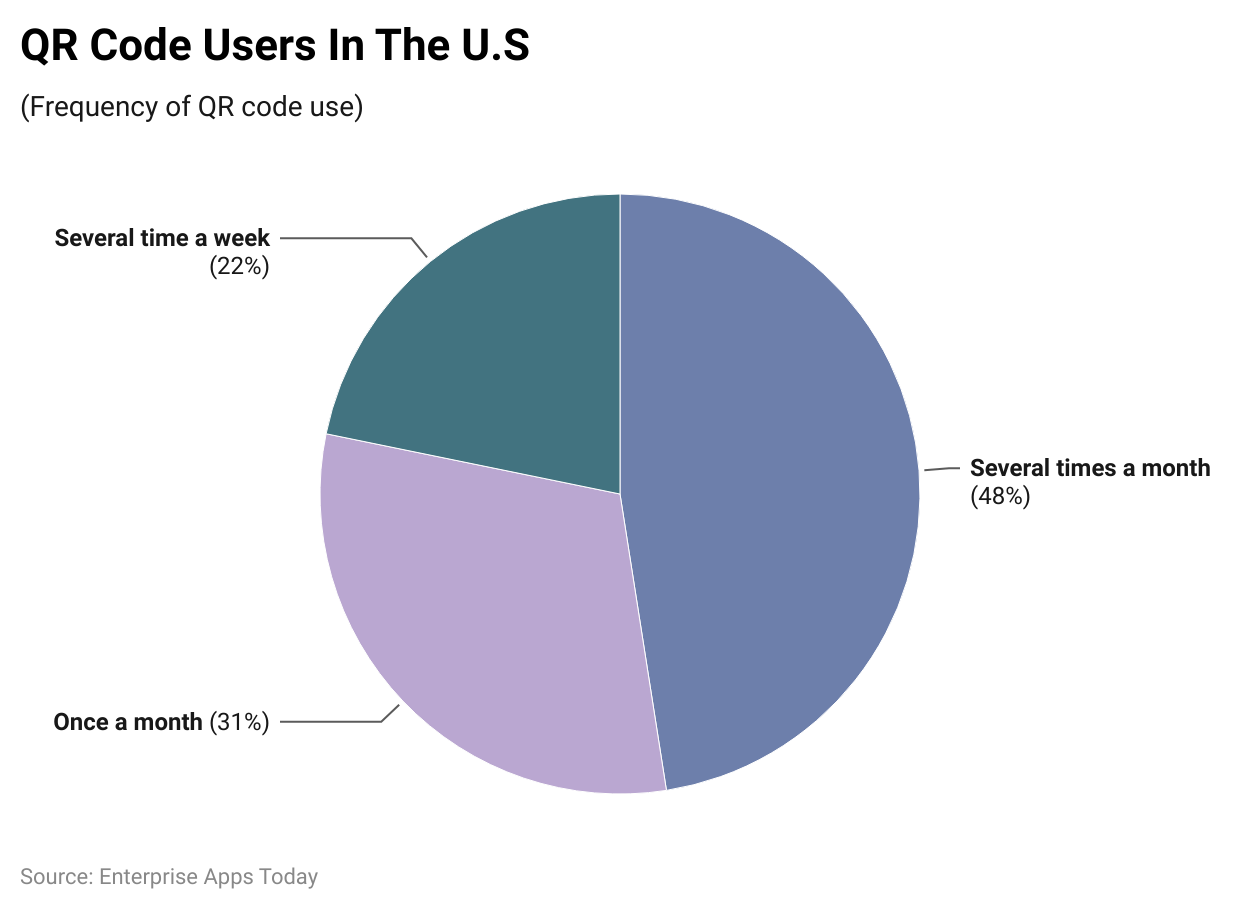
- The majority of the QR code users use it several times a month resulting in 48%. Furthermore, 22% use it several times a week, while 31% use it once a month.
By Technical Solutions To Replace Passwords
 (Reference: statista.com)
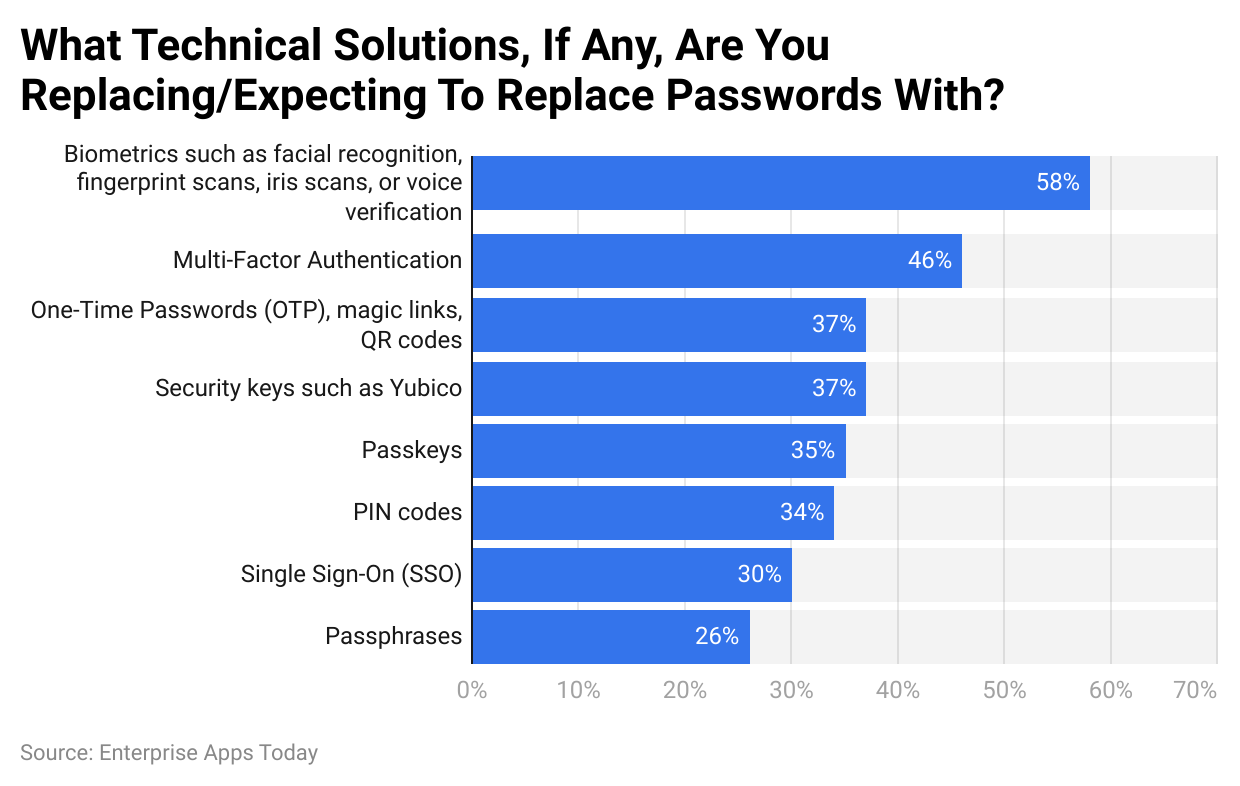
- According to QR Code Usage statistics, One-time passwords, QR Codes, or magic links are one of the top solutions to exchange password systems in the USA resulting in 37%.
- Other leading methods include biometrics, multi-factor authentication, passkeys, security keys, PIN codes, passphrases, single sign-on, etc.
By Highest Number Of QR Code Payment Mobiles Devices
 (Reference: statista.com)
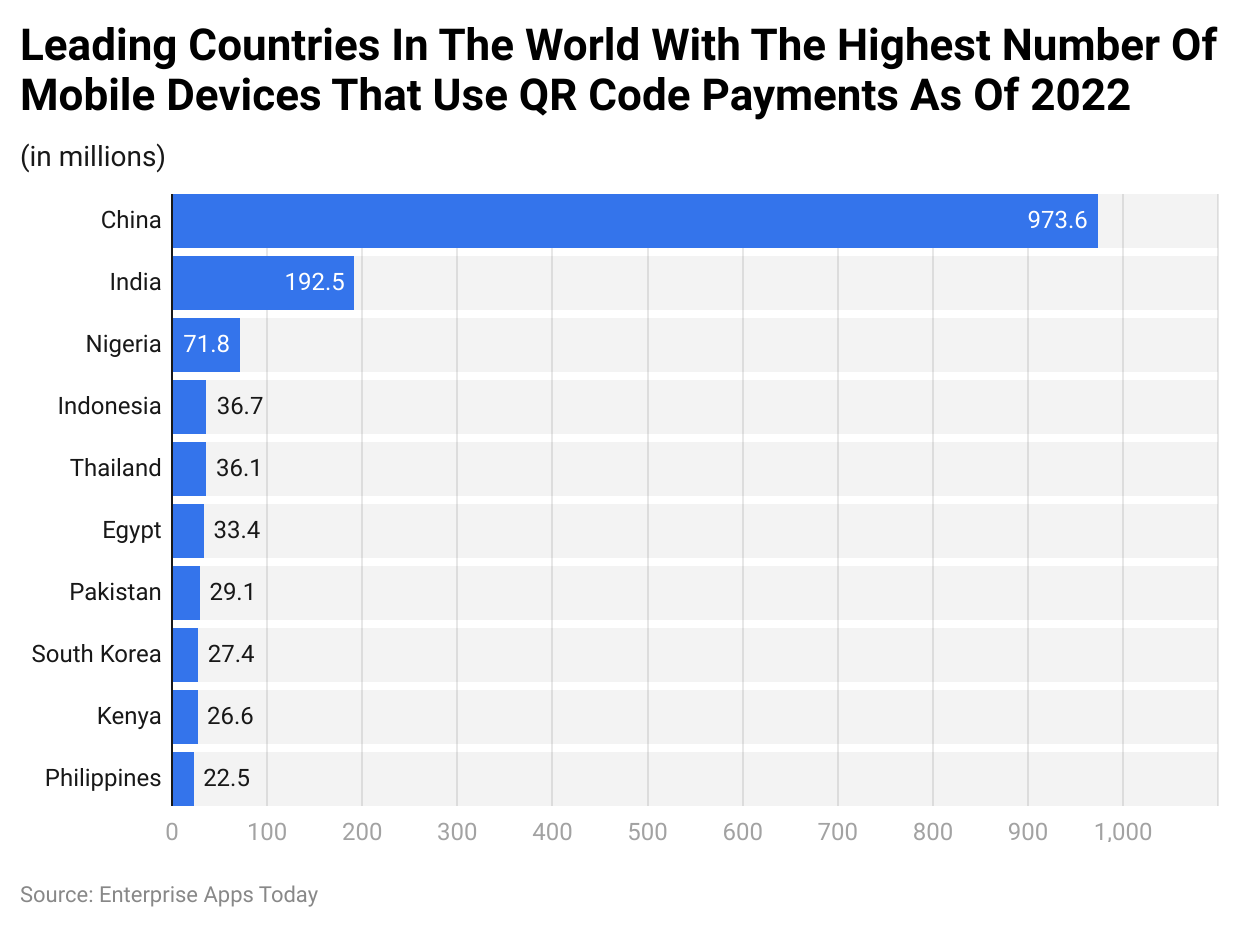
- In 2022, China became the leading country in the world with the highest number of mobile devices that used QR codes for payments resulting in 973.6 million.
- India and Nigeria were the other two leading countries contributing 192.5 million and 71.8 million respectively.
- Indonesia, Thailand, Egypt, Pakistan, South Korea, Kenya, and the Philippines contributed accordingly.
Most Popular QR Code Solutions
- URL QR codes lead the usage, comprising 47.68% of all dynamic QR codes. They mainly redirect users to websites.
- File QR codes are the second most common, making up 23.71% of uses, allowing for the download of files.
- vCard QR codes, which store digital business card information, are third at 13.08%.
- Social media ‘Link in Bio’ QR codes account for 3.40%.
- MP3 QR codes, used for audio file access, slightly trail at 3.39%.
- Landing page QR codes that direct to HTML pages make up 2.98%.
- App Store QR codes, used for downloading apps, account for 1.17%.
- Google Form QR codes are used 1.02% of the time for form access.
- Menu QR codes, often used in restaurants, comprise 0.99%.
- Text QR codes, which display plain text, are the least used at 0.71%.
By Applications
Marketing
- QR codes are a key marketing tool that connects offline consumers to online resources. They are especially useful for brands looking to integrate online and offline marketing strategies.
- From 2017 to 2019, the use of QR codes to redeem discount coupons soared, increasing from 1.3 billion to 5.3 billion.
- Consumers are becoming more aware of QR codes’ capabilities: 37% know they can download apps and 22% use them to find locations on maps.
- The concept of “phygital” — blending physical and digital experiences — is becoming essential in today’s marketing. This approach helps brands engage customers through multiple channels.
- Brands that adopt an omnichannel strategy, which combines physical and digital marketing channels, retain about 90% of their customers. In contrast, those relying on a single channel retain only 33%.
- Most digital shoppers, about 72%, say that a good in-store experience is crucial for deciding to make a purchase.
- For 71% of shoppers, smartphones are a vital part of the shopping experience when they are in a store.
Payments
- Digital payments using QR codes are quick, secure, and simple. This technology allows users to complete transactions online in just a few seconds.
- The global market for QR code payments was valued at USD 8.07 billion in 2020. It is expected to grow significantly, reaching USD
- 35.07 billion by 2030, with an annual growth rate of 16.11%.
- Each year, India processes QR transactions worth over INR 12 crore.
- In China, the average value of transactions made using QR codes is about RMB 40.6 trillion every quarter.
- Worldwide, QR code transactions are forecasted to increase from USD 2.4 trillion in 2022 to USD 3 trillion by 2025.
Restaurants and Hotels
- QR codes have become a key feature in the hospitality industry, especially in hotels and restaurants, with their use skyrocketing after the pandemic.
- In the United States, 52% of restaurants now use QR code menus to streamline operations and enhance customer experience.
- These codes have proven beneficial, with 33% of restaurant owners reporting improved business outcomes after adopting QR codes.
- Some governments are also endorsing this technology. For instance, the government of Uruguay now requires high-street restaurants to display QR codes on their premises.
Food and Product Packaging
- Smart packaging incorporates digital technology like codes and sensors to enhance the functionality of traditional packaging. This technology is used for tracking products and providing detailed information about them.
- In 2020, the global market for smart packaging was valued at USD 22 billion and is expected to grow to USD 38 billion by 2030, with a yearly growth rate of 5.5%.
- QR codes are a key feature of smart packaging, with their market value reaching USD 5.3 billion in 2019 and projected to increase at a growth rate of 8% annually.
- Major brands including L’Oréal, Nestlé, Coca-Cola, Jameson Irish Whiskey, and Frisky are using QR codes on their packaging to engage customers.
- A significant 57% of consumers have used QR codes on food packaging to access more information about the product.
- Another 43% of consumers have scanned QR codes to visit a brand’s website, while 34% used them to learn more about the company or to participate in contests. Additionally, 25% scanned QR codes to get recipes, and 9% to play games associated with the brand.
- In China, 65% of consumers believe that QR codes on packaging are crucial for establishing trust with the brand.
- From 2014 to 2018, the use of QR codes in packaging in the Asia Pacific region increased by 83%.
Miscellaneous
- QR codes enhance augmented reality (AR) experiences, making them easily accessible to users.
- The global market for AR and virtual reality (VR) is expected to increase by USD 162.71 billion by 2025, as reported by PR Newswire.
- These codes also simplify the sharing of digital business cards.
- The market for digital business cards is anticipated to reach USD 242.3 million by 2027, according to Market Research Future.
Worldwide Penetration Rate Of Mobile POS Systems
 (Reference: statista.com)
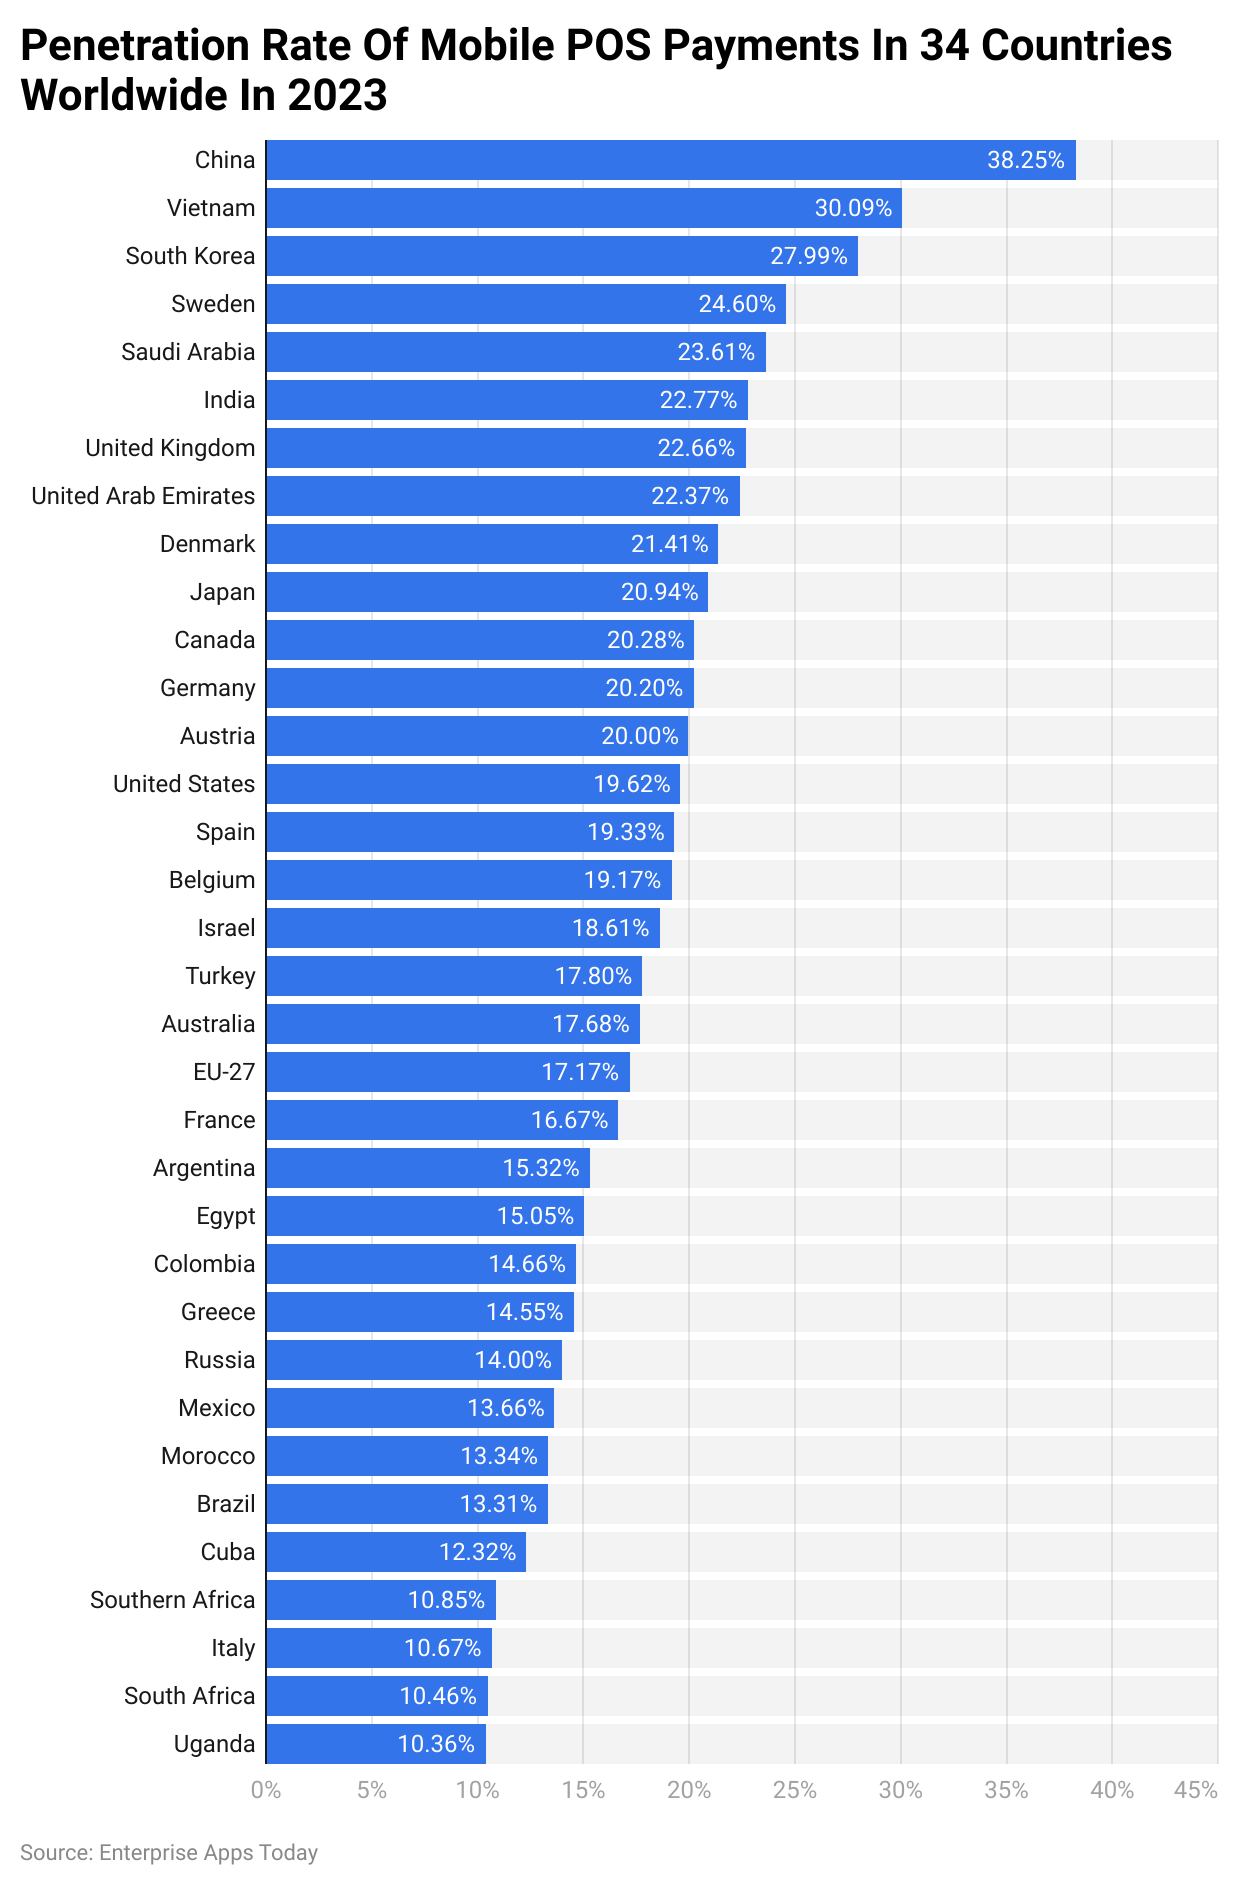
- As of 2023, the mobile POS Payments penetration rate is highest in China, Vietnam, and South Korea resulting in 38.25%, 30.09%, and 27.99% respectively.
- Overall, this technology has less than a 50% penetration rate in all of the above-mentioned countries.
Conclusion
Since COVID-19, the demand for contactless payment has significantly increased around the world. Not only payments but food can be ordered by scanning QR codes at restaurants. QR codes have multi-functional features that also allow you to book tickets, share social media profiles, and much more. These QR Code Usage Statistics show that today the adoption rate for such technology has increased tremendously in almost every country.
More to mention, in some countries, scanning by the palm where the details of the card are stored has been incorporated. For sure, technology holds unbelievable surprises for us in the future.
Sources
Pramod Pawar brings over a decade of SEO expertise to his role as the co-founder of 11Press and Prudour Market Research firm. A B.E. IT graduate from Shivaji University, Pramod has honed his skills in analyzing and writing about statistics pertinent to technology and science. His deep understanding of digital strategies enhances the impactful insights he provides through his work. Outside of his professional endeavors, Pramod enjoys playing cricket and delving into books across various genres, enriching his knowledge and staying inspired. His diverse experiences and interests fuel his innovative approach to statistical research and content creation.


