Lyft Statistics By Revenue, Active Riders, Drivers, Country, Demographics, Device And Social Media

Updated · Feb 20, 2025


TABLE OF CONTENTS
- Introduction
- Editor’s Choice
- General Lyft Statistics
- Lyft Revenue Statistics
- Lyft’s Quarterly Revenue Statistics by Segment
- Lyft’s Net Income Or Loss Statistics
- Lyft’s Research And Development Expenditure Statistics
- Active Riders of Lyft Statistics
- Share of Lyft Driver’s Working Statistics by Platforms
- Lyft Driver Statistics
- Lyft Driver Statistics by Demographics
- Lyft Website Traffic Statistics
- By Country
- By Demographics
- By Device
- By Traffic Source
- By Social Media Referral Statistics
- Sales Share Comparison between Uber and Lyft
- Lyft App Downloads Statistics
- Sustainable Initiatives of Lyft Statistics
- Conclusion
Introduction
Lyft Statistics: Lyft is a well-known ridesharing company in the United States of America, founded in 2012. This platform helps connect passengers with drivers through its mobile app, offering a convenient way to travel within cities. Lyft also provides different ride options, like shared rides, luxury rides, and eco-friendly choices, to meet various customer needs.
This ridesharing company is best for its user-friendly app, transparent pricing, and commitment to safety. They are now available in many cities in the U.S. and Canada, making it one of the largest players in the ridesharing industry. In addition to rides, Lyft has expanded into bike and scooter rentals, helping people with short-distance travel. The company is also focused on sustainability, working towards reducing carbon emissions through green initiatives.
Editor’s Choice
- Lyft Statistics show that Lyft’s Q3 2024 revenue rose 32% year-over-year to USD 1.52 billion, beating analysts’ forecast of USD 1.44 billion.
- In the same period, the company reached 24.4 million active riders, a 9% increase from last year, marking its highest record ever.
- Meanwhile, Lyft provided 217 million rides, showing a 16% increase from the same time last year.
- By Q3 2024, the company’s gross bookings reached USD 4.1 billion, a 16% increase from Q3 2023.
- Moreover, Lyft reported a USD 5 million net income in Q2 2024, its first GAAP profitable quarter.
- As of August 2022, the company reported a record-high of five million global drivers, marking a 31% increase from the previous year.
- Lyft Statistics further report that in the second quarter of 2024, Lyft’s free cash flow improved to USD 256.4 million, up from a negative USD 112.2 million in 2023.
- Lyft controls around 25% of the ridesharing market in the United States.
- The company serves 658 cities in the U.S. and Canada, with 2 million drivers.
- In Q3 2024, Lyft partnered with autonomous vehicle companies like Mobileye to add self-driving technology to its platform.
You May Also Like To Read
- Bosch Statistics
- Kawasaki Statistics
- Navistar Statistics
- BYD Statistics
- Stellantis Statistics
- Great Wall Motors Statistics
- Maybach Statistics
- Bandai Statistics
- Buick Statistics
General Lyft Statistics
- Lyft’s revenue for the twelve months ending September 30, 2024, reached USD 5.46 billion, a 25.41% increase year over year.
- Moreover, the company reached a record high in Q3 2024, with 24.4 million active riders.
- Gross bookings in the same duration reached USD 4.1 billion, showing a 16% increase compared to the same period last year.
- Lyft Statistics reports that the company earned USD 5.0 million in net income in Q2 2024, its first GAAP profitable quarter in company history.
- The Adjusted EBITDA in Q3 2024 was USD 107.3 million, which increased from USD 92.0 million in Q3 2023.
- Moreover, the free cash flow in Q2 2024 was USD 256.4 million, much better than the negative USD 112.2 million in Q2 2023.
- Gross bookings for Q4 2024 are expected to grow, ranging between USD 4.28 billion and USD 4.35 billion.
- As of December 31, 2023, Lyft reported having 2,945 employees.
- However, in September 2024, Lyft announced job cuts affecting about 1% of its workforce, bringing the total to 2,915.
Lyft Revenue Statistics
- As of November 15, 2024, Lyft has demonstrated its revenue with USD 1.52 billion, marking a 32% year-over-year growth.
- Moreover, the first and second-quarter revenue earnings of 2024 were USD 1.3 billion (+28%) and USD 1.4 billion (+32%), respectively.
 (Reference: statista.com)
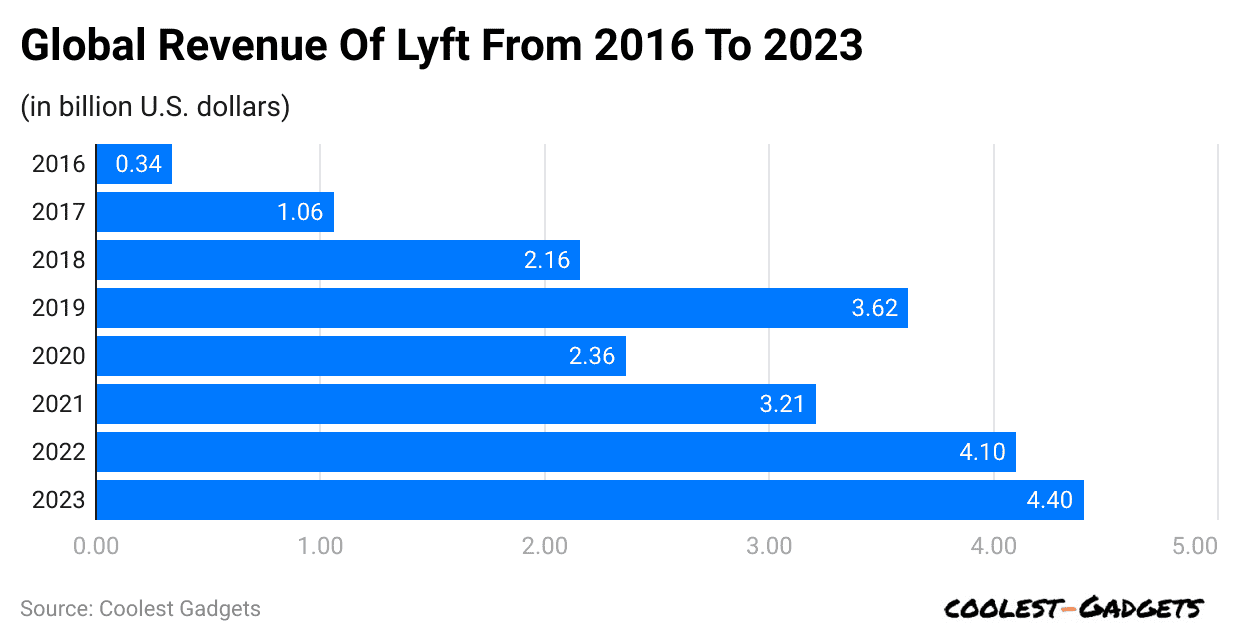
- In 2023, Lyft earned 4.4 billion U.S. dollars in global revenue as a popular ride-hailing network provider, which increased from 2022, resulting in USD 4.1 billion.
- In previous years, Lyft’s revenue depicted in the graph above was 2021 (USD 3.21 billion), 2020 (USD 2.36 billion), 2019 (USD 3.62 billion), 2018 (USD 2.16 billion), 2017 (USD 1.06 billion), and 2016 (USD 0.34 billion).
Lyft’s Quarterly Revenue Statistics by Segment
 (Reference: statista.com)
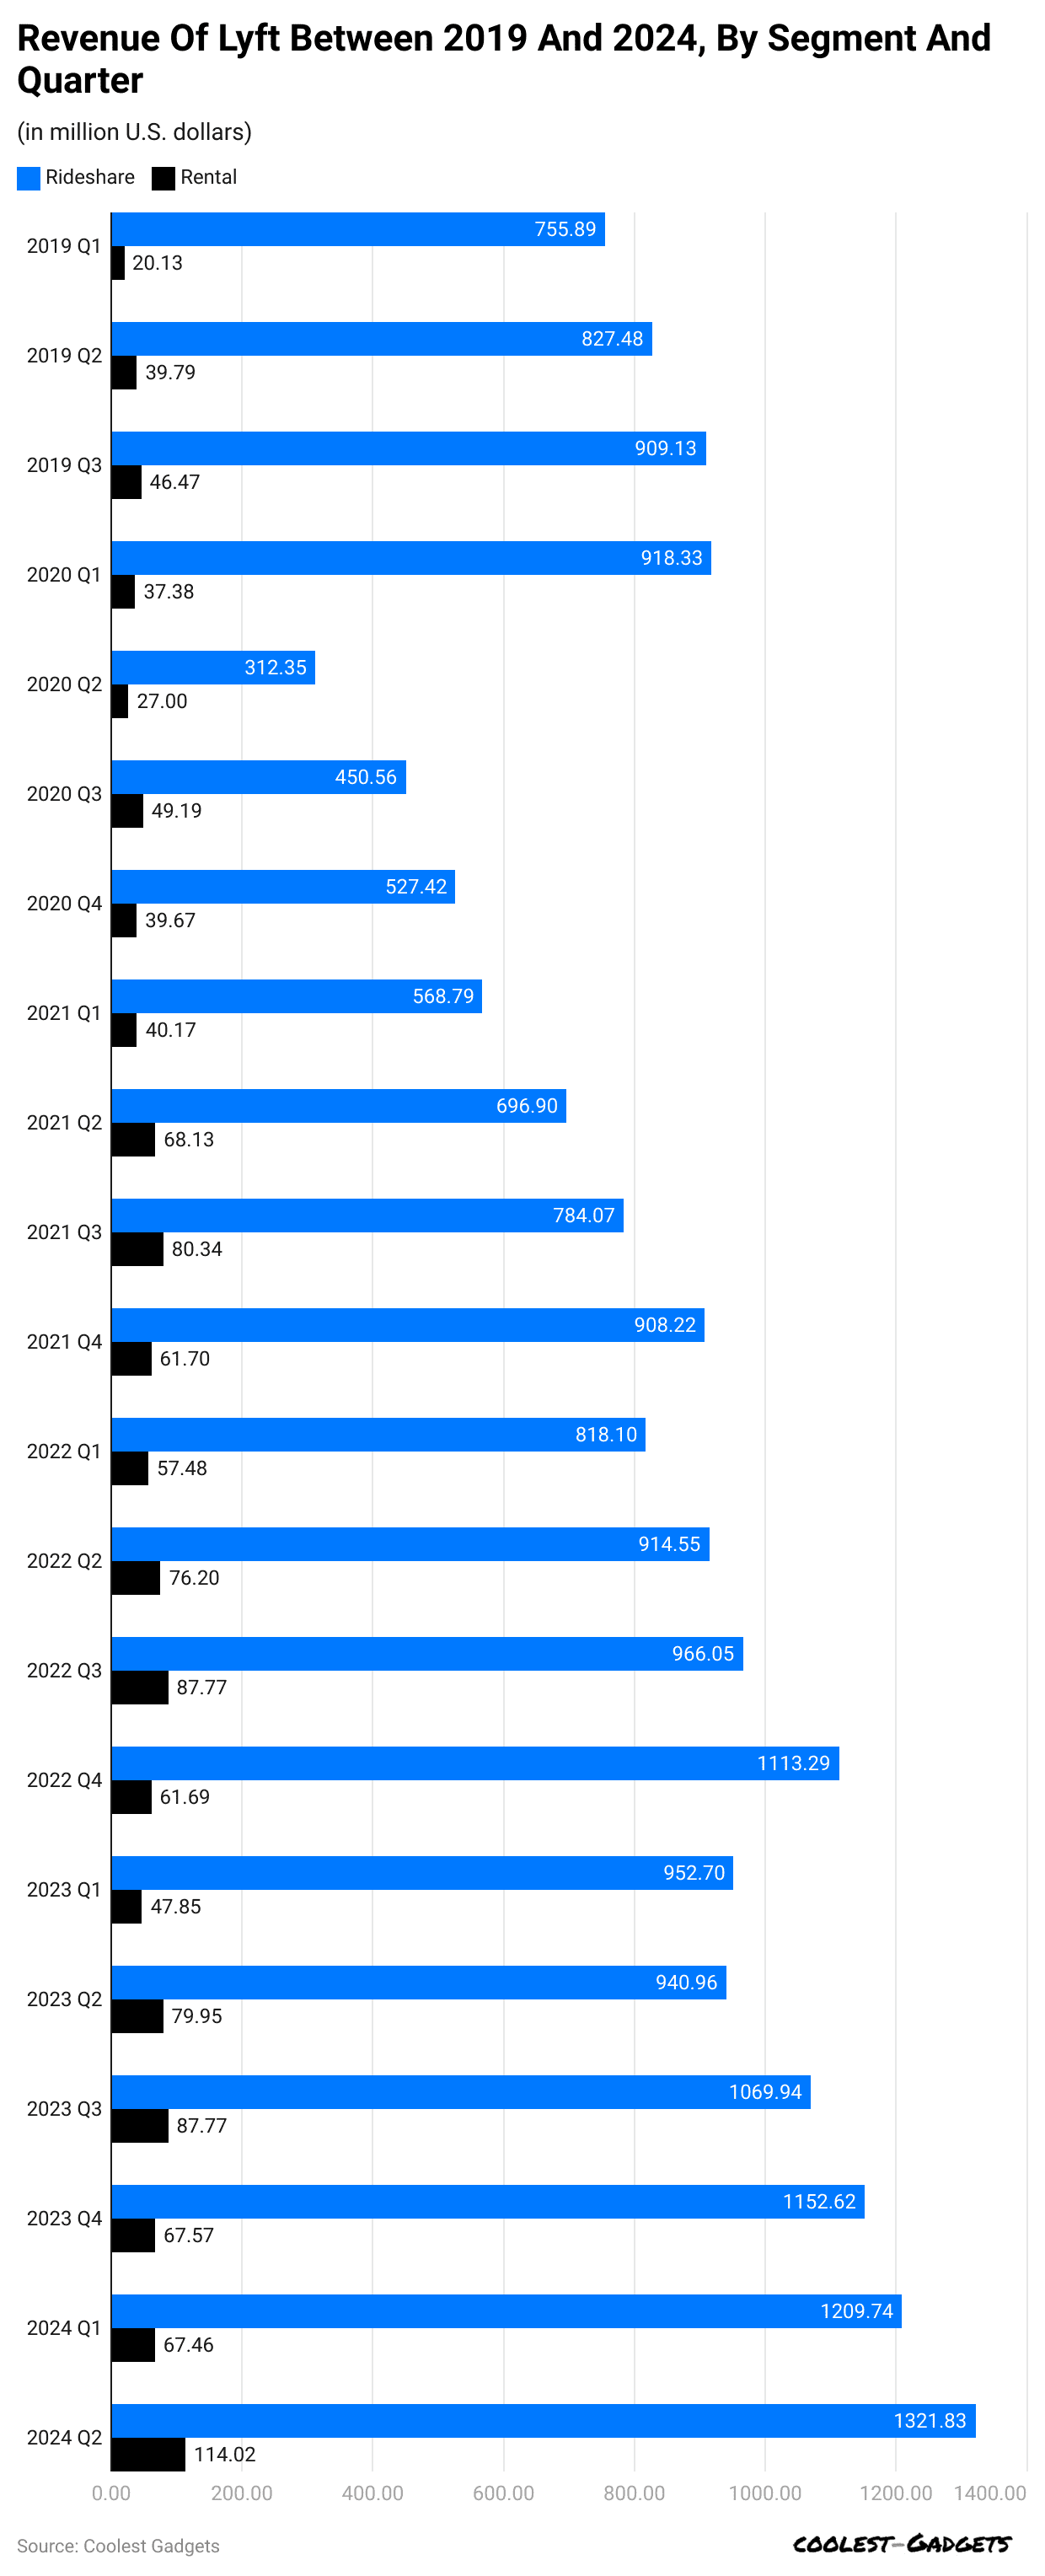
- As per Lyft Statistics, in the second quarter of 2024, Lyft earned USD 1,321.83 million from ridesharing, while rental services brought in USD 114.02 million.
- Similarly, in Q1 of this year, Lyft’s segmental revenue was around ridesharing (USD 1,209.74 million) and rental (USD 67.46 million).
Lyft’s Net Income Or Loss Statistics
- In the third quarter of 2024, Lyft reported a net loss of USD 12.4 million, which includes a restructuring charge of USD 36.4 million.
- This loss is a slight increase from the USD 12.1 million net loss in the same quarter last year.
 (Reference: statista.com)
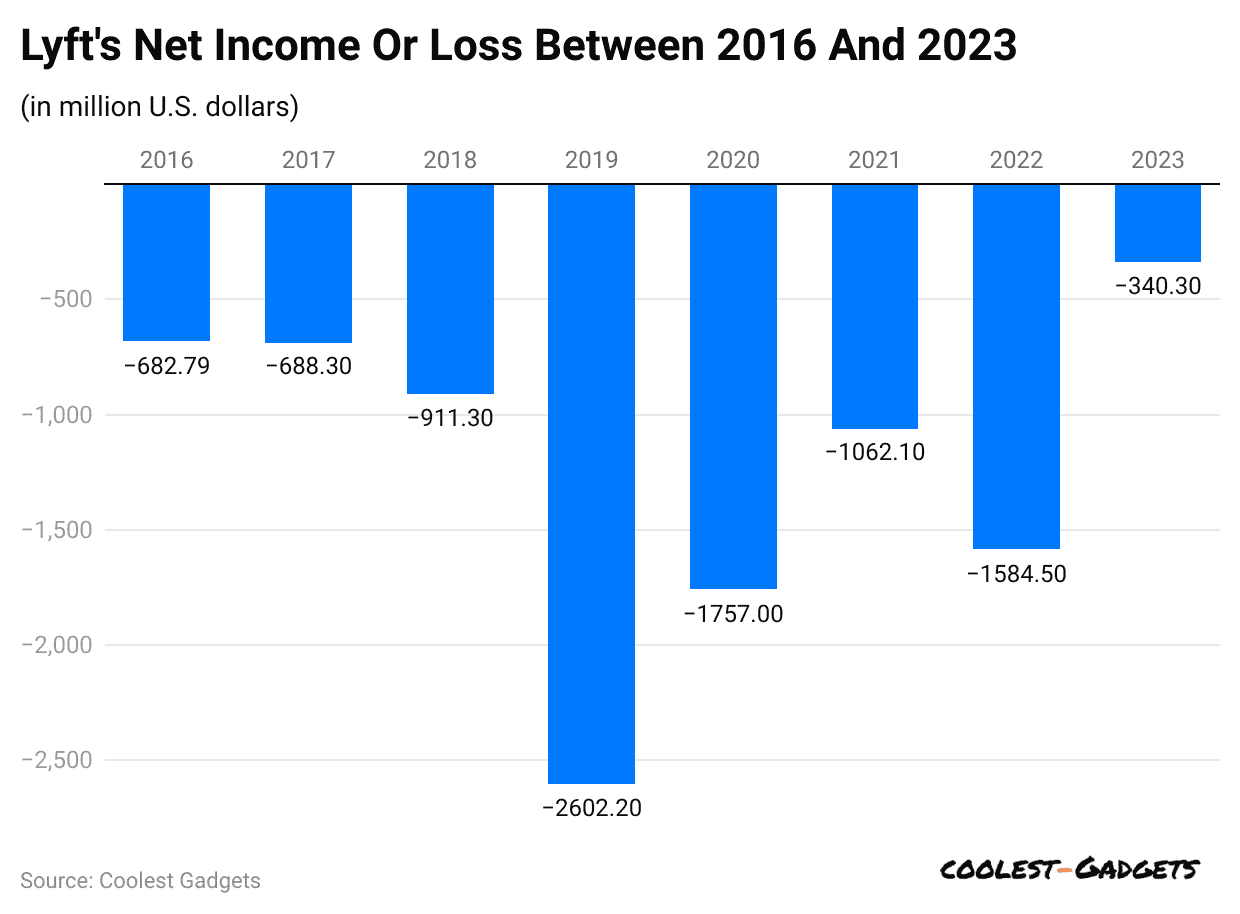
- As mentioned in Lyft Statistics in 2023, Lyft’s net loss was about USD 340.3 million, the smallest in eight years, compared to USD 1.584.5 million in 2022.
- In addition, past years’ net losses are represented by 2021 (USD 1,062.1 million), 2020 (USD 1,752 million), 2019 (USD 2,602.2 million), 2018 (USD 911.3 million), 2017 (USD 688.3 million), and 2016 (USD 682.79 million).
Lyft’s Research And Development Expenditure Statistics
 (Reference: statista.com)
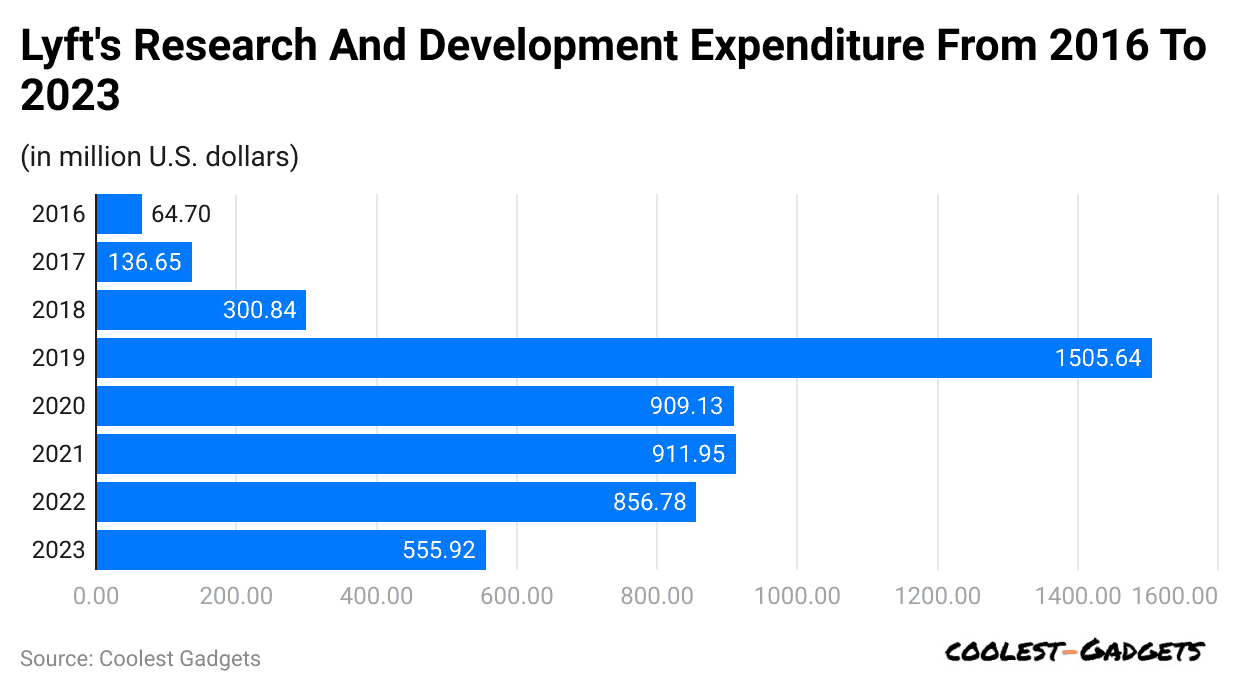
- A Statista report analysis represented that in 2023, Lyft spent about USD 555.92 million on research and development.
- Meanwhile, in 2022, the R&D expenditure on the platform was around USD 856.78 million.
You May Also Like To Read
- Ferrari Statistics
- Fiat Statistics
- Ford Statistics
- General Motors Statistics
- Honda Statistics
- Hyundai Statistics
- Infiniti Statistics
- Isuzu Statistics
- Jaguar Statistics
- Jeep Statistics
- Kia Statistics
Active Riders of Lyft Statistics
- In the third quarter of 2024, the total number of active Lyft riders was almost 24.4 million, a 9% increase from the last year.
- Moreover, in Q1 and Q2 of the years, the number was 21.9 million (+12%) and 23.7 million (+10%), respectively.
 (Reference: statista.com)
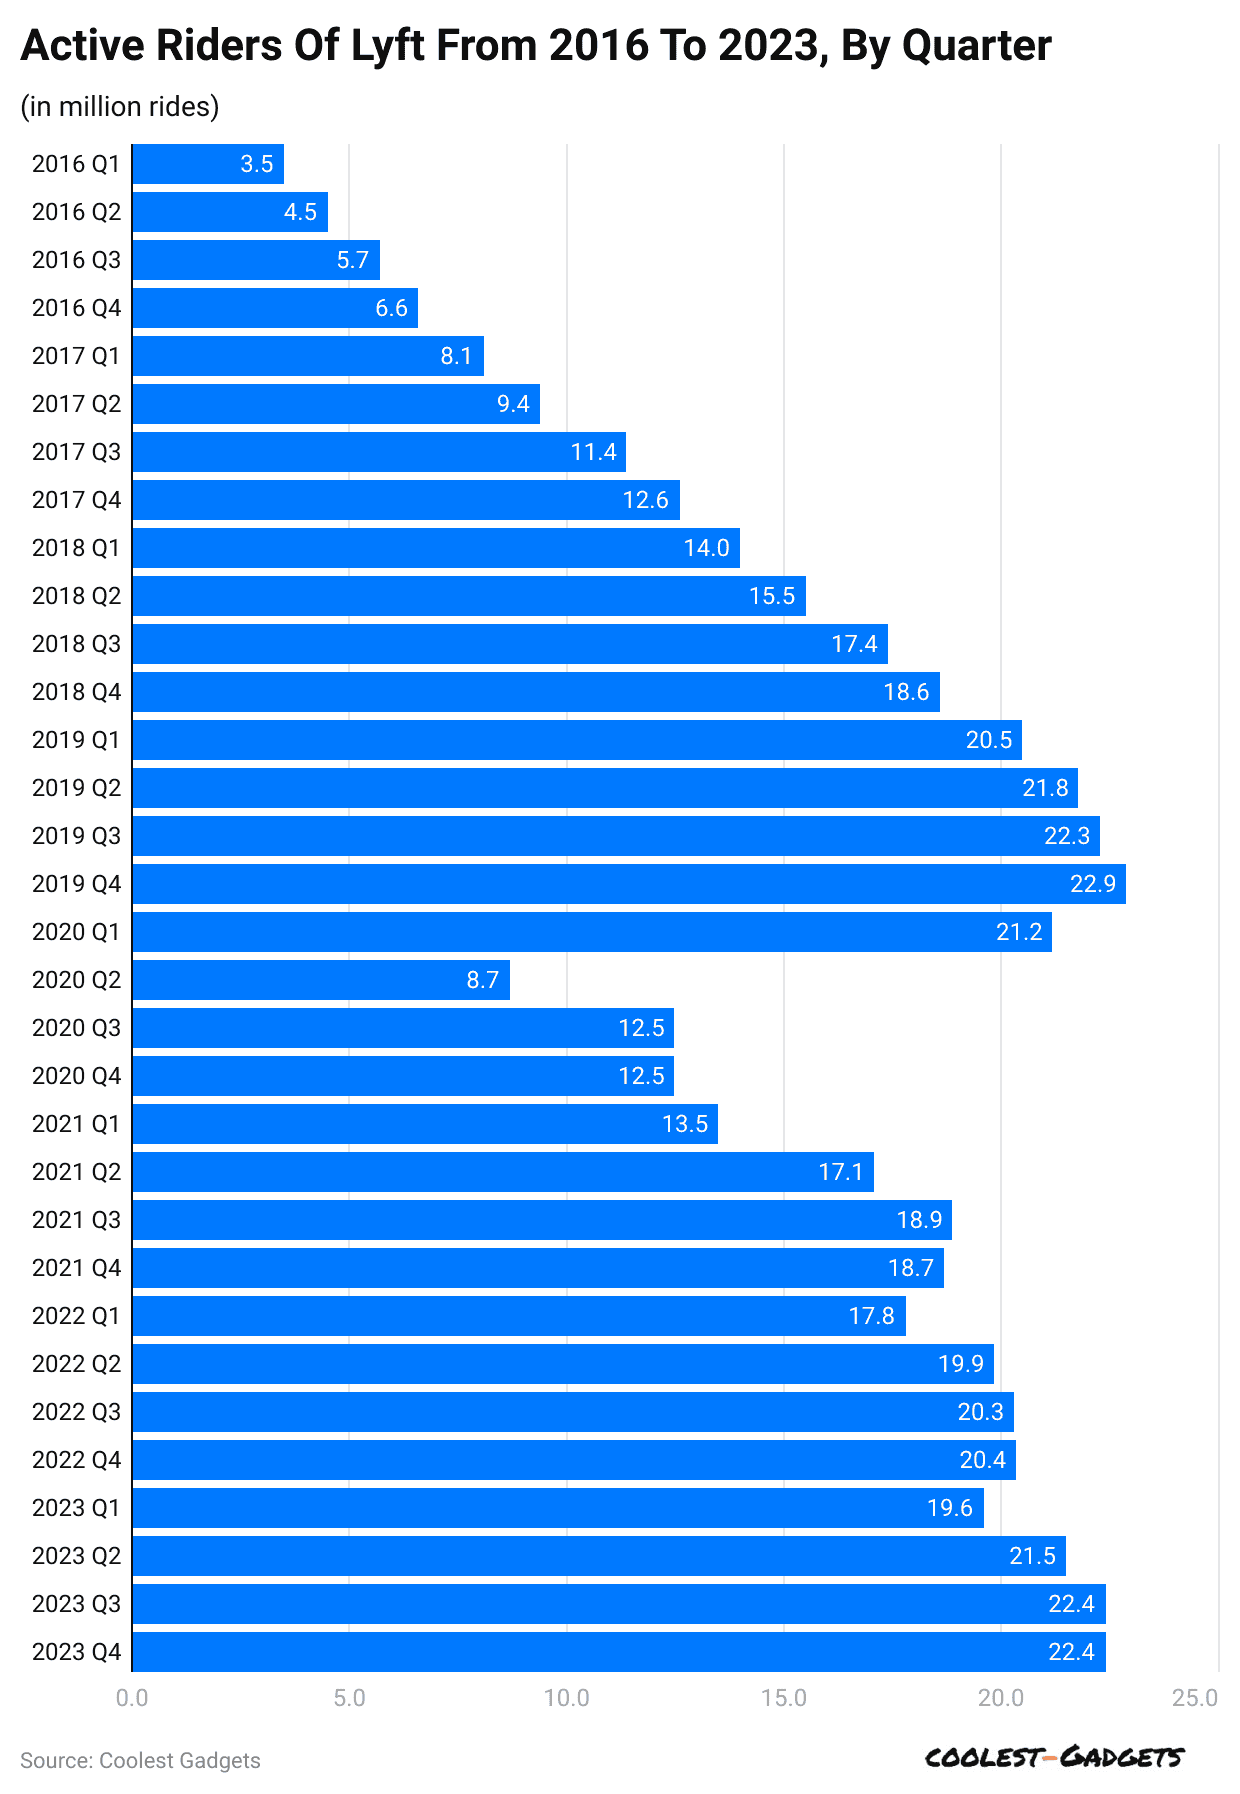
- Lyft Statistics further report that in the fourth quarter of 2023, Lyft, based in San Francisco, reported having 22.4 million active riders.
- Other quarterly analyses in the same year were Q1 (19.6 million), Q2 (21.5 million), and Q3 (22.4 million).
 (Reference: statista.com)
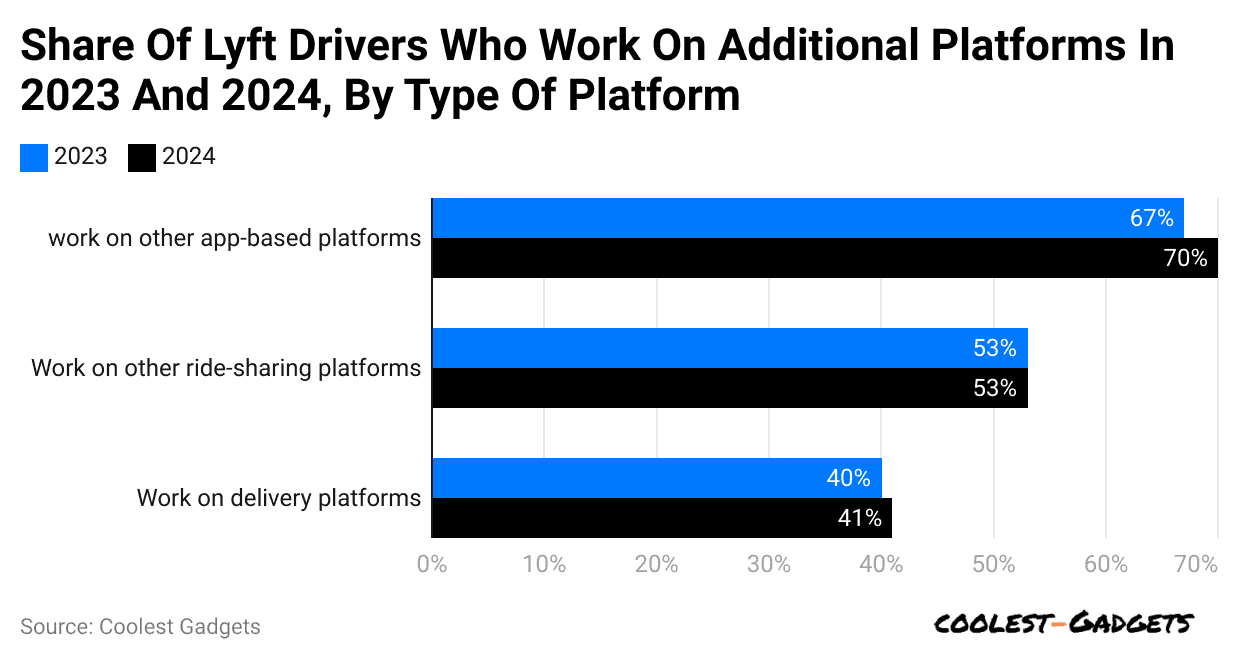
- Lyft Statistics also states that more than two-thirds of Lyft drivers use other app-based platforms, too, and this share has slightly increased from 2023 to 2024.
- In 2024, around 70% of Lyft drivers were working on other app-based platforms.
- 53% (on other ridesharing) and 41% (on delivery) follow the shares of other platforms.
- Moreover, in 2023, Lyft’s drivers share by platforms were app-based (67%), ridesharing (53%) and delivery (40%).
You May Also Like To Read
- Aprilia Statistics
- Bajaj Statistics
- BMW Statistics
- Ducati Statistics
- KTM Statistics
- Moto Guzzi Statistics
Lyft Driver Statistics
- To date, almost 2 million drivers work for Lyft across the U.S. and Canada.
- Lyft Statistics show that almost 72% of Lyft drivers are men, while 28% are women.
- Meanwhile, about 75% are aged 40 or older, while 69% are from minority groups in 2024.
- 7% of drivers identify as members of the LGBT+ community.
- 55% of people hold either a bachelor’s degree or a master’s degree.
Lyft Driver Statistics by Demographics
 (Source: helplama.com)
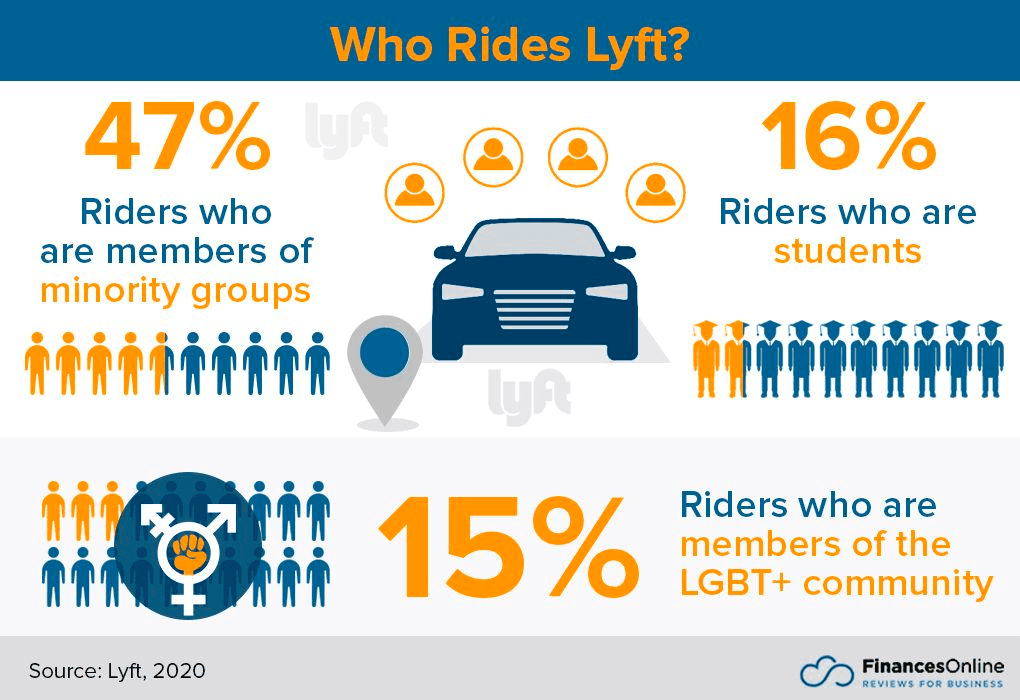
- In recent years, almost half (47%) of Lyft riders are minorities, with 18% Hispanic, 22% African American, and 7.2% Asian.
- Meanwhile, students represent 16% of Lyft users, while Lyft riders make up 15% of the LGBT+ community.
- An average American Lyft rider’s household earns around USD 54,000 annually.
- The average cost of a Lyft ride is USD 167, and users spend about USD 8.97 billion annually on Lyft.
Lyft Website Traffic Statistics
 (Source: similarweb.com)
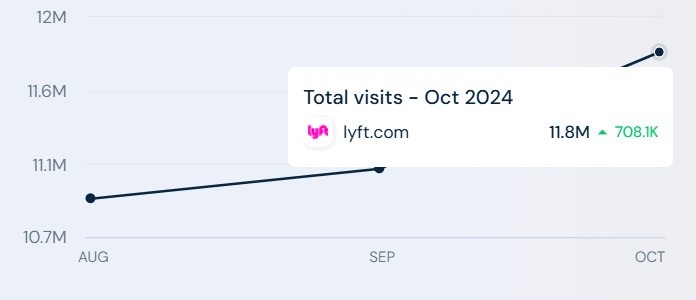
- In October 2024, lyft.com accounted for 11.8 million website visits.
- In addition, the website secured a 6.38% higher visit rate compared to September and a 54.44% bounce rate.
- Over the last three months, lyft.com’s global ranking improved from 6,487 to 6,305.
- To date, the website’s global rank is #6,305 (+182), and in the United States, it is #1,172 (+39).
- The total number of pages per visit to the website was 2 minutes and 72 seconds.
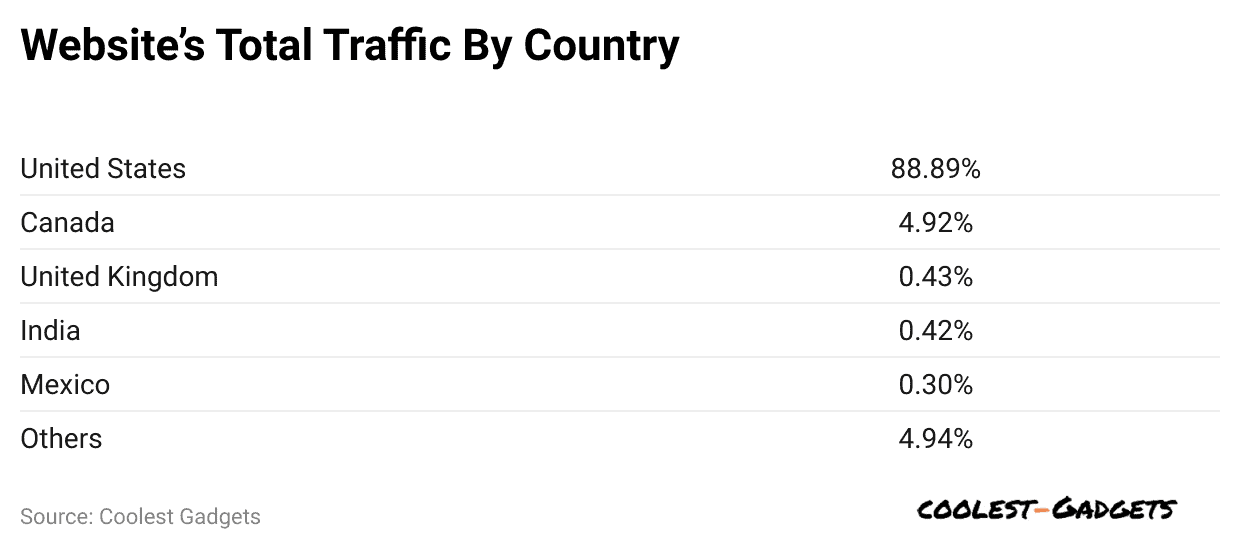
By Country
 (Reference: similarweb.com)
- Lyft Statistics further indicated that in October 2024, the United States had 88.99% of the website’s total traffic, up 2.04% from last month.
- At the same time, other countries recorded the following contributions in total traffic on lyft.com: Canada:4.92% (-2.08%), United Kingdom: 0.43% (-11.21%), India: 0.42% (-17.45%), and Mexico: 0.3% (+48.86%)
- Besides, other countries collectively made up a website share of 4.94%.
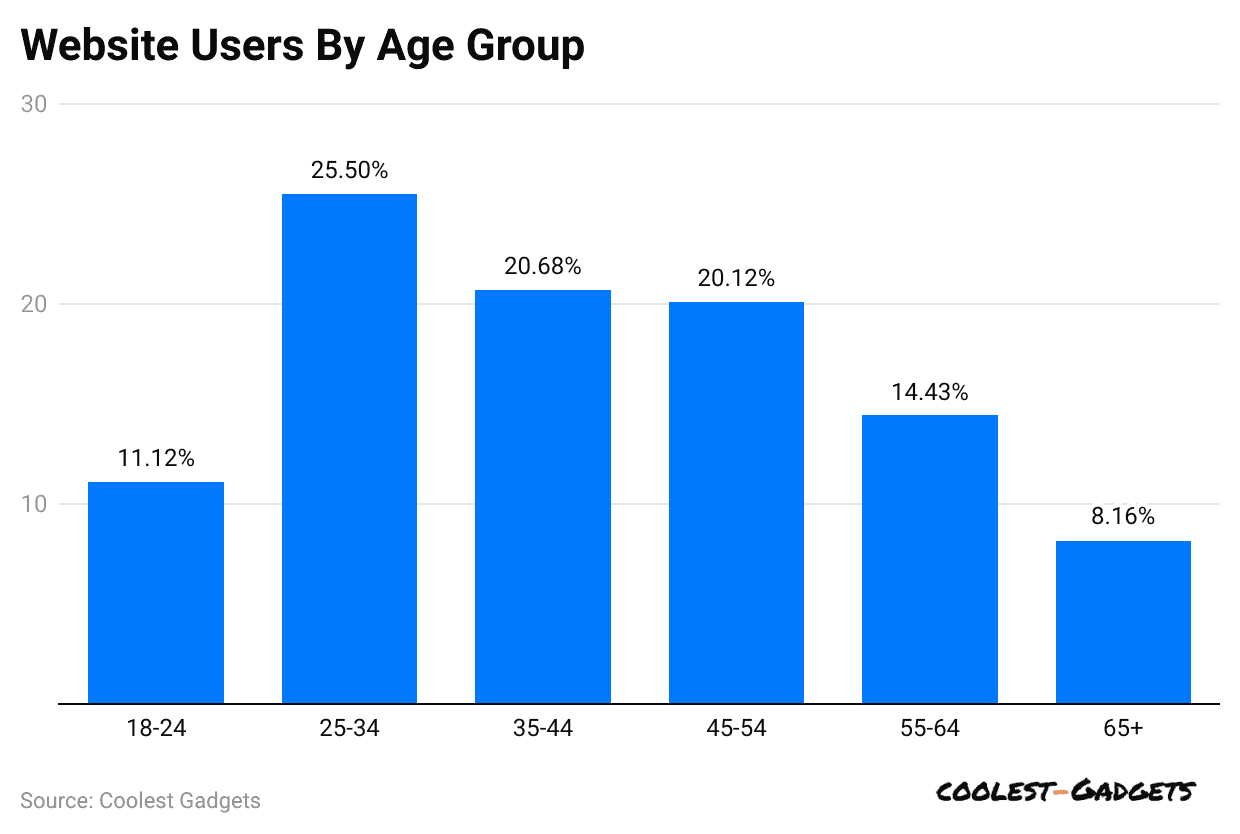
By Demographics
 (Reference: similarweb.com)
- Lyft Statistics show that based on age groups, the highest number of website users stands between 25 and 34 years old, with a share of 25.5%.
- Around 20.68% of Lyft website users are 35 to 44 years old.
- On the other hand, 20.12% and 14.43% of users are 45 to 54 years old and 55 to 64 years old, respectively.
- Only 11.12% of website users are aged from 18 to 24 years.
- 65+ years and above users contributed only 8.16% of shares on lyft.com.
- Similarly, in the last month of 2024, female and male Lyft users of lyft.com accounted for 55.03% and 44.97%, respectively.
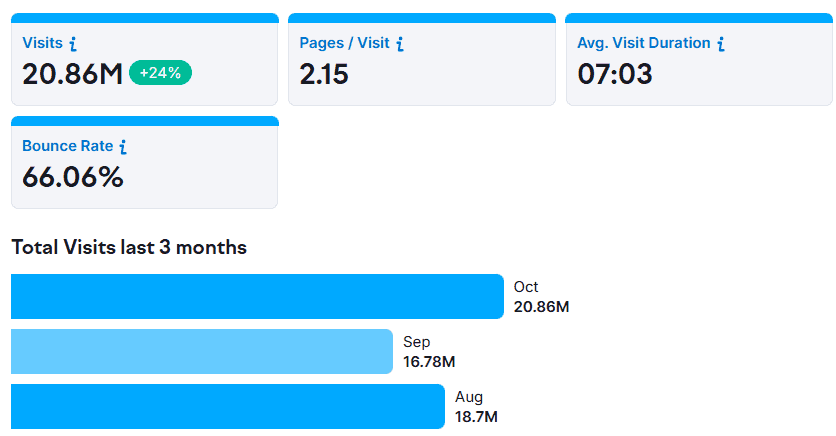
By Device
 (Source: semrush.com)
- According to Lyft Statistics, in October 2024, around 91.05% of visitors to lyft.com used mobile devices, and 8.95% accessed it from desktops.
- The above graph shows that the website had 20.86 million visits, an increase of 24.31% from August.
- Meanwhile, the average was 7 minutes and 03 seconds per session.
| Country | Total Visits | Visitor’s Share | Mobile | Desktop |
| United States | 19.71 million | 94.47% | 91.63% | 8.37% |
| Canada | 774.09 thousand(k) | 3.71% | 89.17% | 10.83% |
| India | 60.94k | 0.29% | 82.69% | 17.31% |
| United Kingdom | 55.37k | 0.27% | 76.24% | 23.76% |
| Mexico | 32.82k | 0.16% | 91.75% | 8.25% |
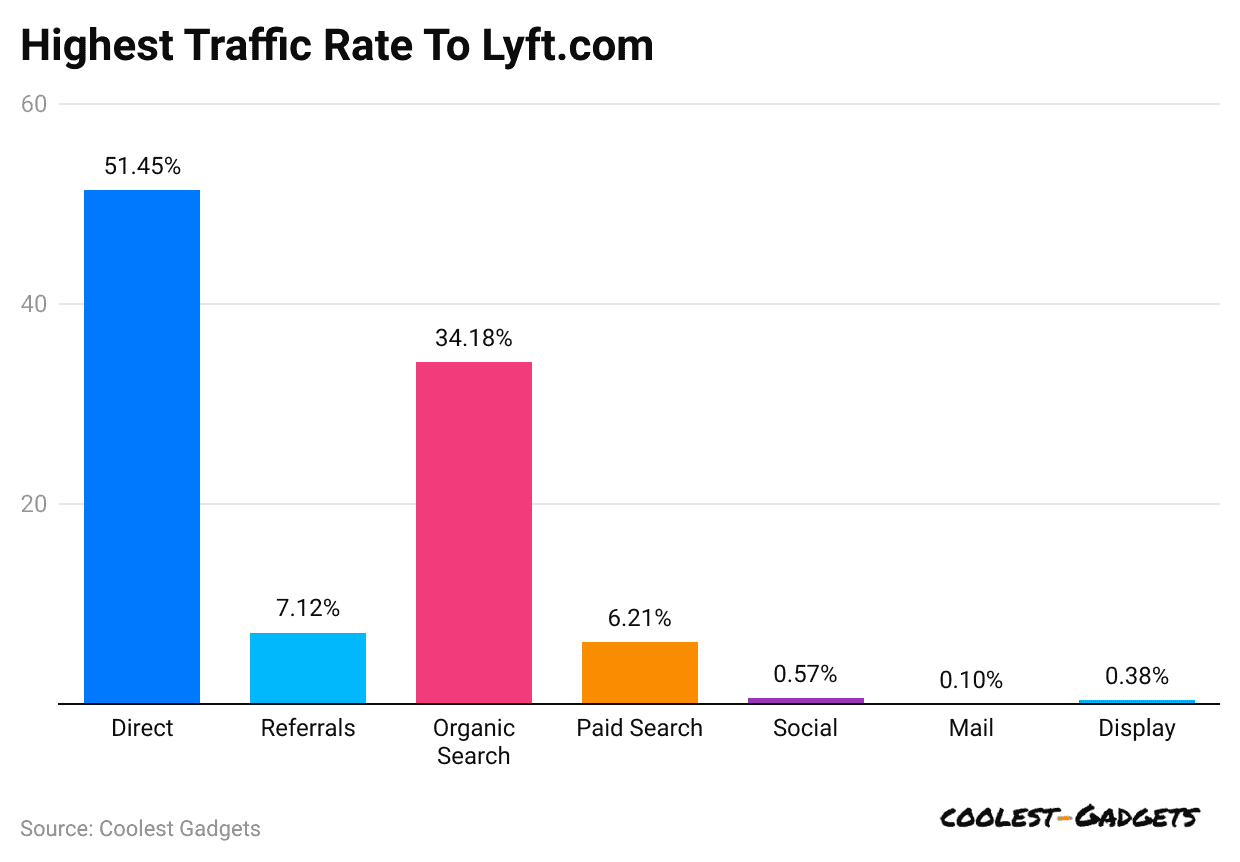
By Traffic Source
 (Reference: similarweb.com)
- The highest traffic rate to lyft.com was accounted for by the direct search, resulting in 51.45%.
- According to Lyft Statistics, around 34.18% of the share was generated via organic searches, while 7.12% came from referrals.
- Others are followed by paid searches (6.21%), social (0.57%), mail (0.1%), and display (0.38%).
By Social Media Referral Statistics
 (Reference: similarweb.com)
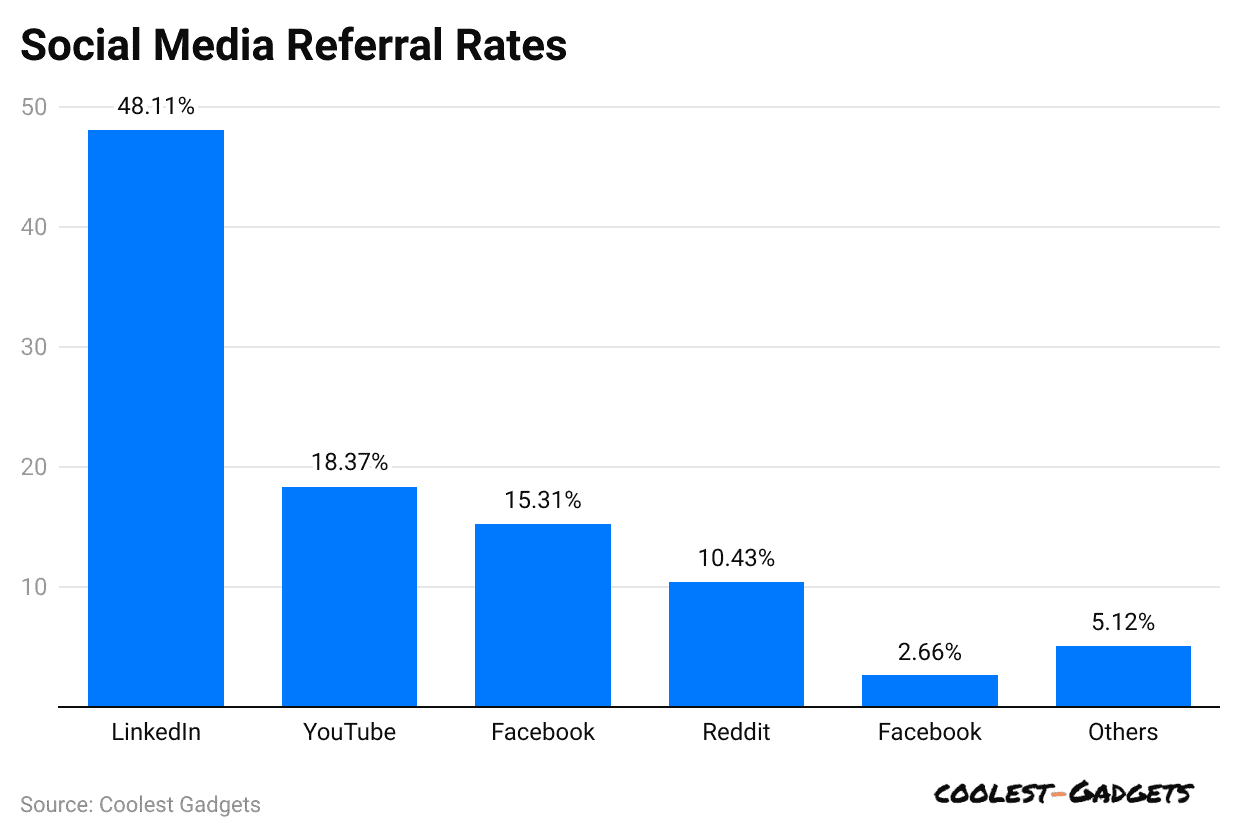
- LinkedIn and YouTube had the two highest social media referral rates, with 48.11% and 18.37% share on the Lyft website, respectively.
- Facebook, Reddit, and Facebook Messenger each contributed 15.31%, 10.43%, and 2.66% to lyft.com.
- In October 2024, these websites’ social media referral rates of other networks collectively reached 5.12%.
 (Source: secondmeasure.com)
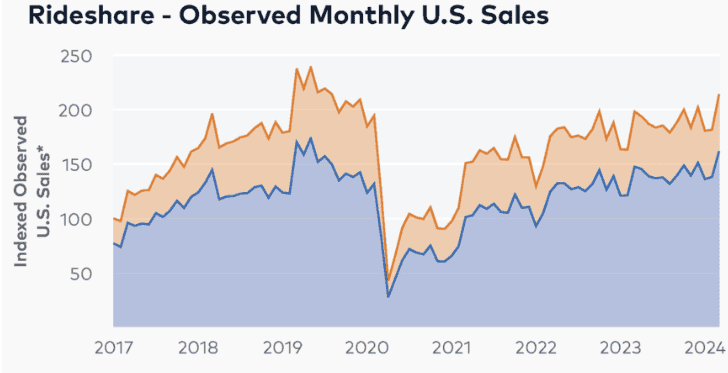
- In March 2024, Uber’s rideshare sales increased by 10% compared to last year, while Lyft’s sales grew by 3%.
- Meanwhile, Uber accounted for 76% of the total rideshare spending in the U.S., and Lyft accounted for 24%.
- Uber’s average monthly sales per customer were USD 107, a 6% increase from the previous year.
- As of March 2024, Lyft’s average sales per customer were USD 95, 5% more than in March 2023.
- From February to March 2024, Uber’s average sales per customer rose 6%, while Lyft’s increased 5%.
Lyft App Downloads Statistics
- As of 2024, Lyft Statistics also reported that the Google Play Store reached over 50 million downloads, becoming the most popular among Android users.
- Apple App Store ranks fifth in travel apps with a 4.9-star rating from 13.8 million reviews.
- In Q2 2024, Lyft had 205 million rides, a 15% increase compared to last year.
- At the same time, active riders reached 23.7 million, a 10% rise from last year.
- In the highest quarter since 2019, we welcomed the most drivers and achieved record driver hours.
Sustainable Initiatives of Lyft Statistics
- In April 2024, Lyft expanded its ‘Green’ mode to 22 cities and 40 airports, allowing riders to request electric or hybrid vehicles for lower-emission trips.
- Lyft introduced a sustainability dashboard in the Lyft Business Portal, enabling companies to track their rideshare greenhouse gas emissions, including total emissions and emissions by fuel type and program.
- Lyft plans to invest an additional USD 80 million between 2024 and 2025 to support EV drivers and encourage gas-powered drivers to transition to electric vehicles.
- By December 2023, Lyft facilitated over 2.3 million EV rides per month, marking a significant growth in EV adoption on the platform.
- Lyft partnered with charging networks like EVgo, Electrify America, and EVCS to provide drivers with discounted fast-charging options, addressing range anxiety and promoting EV use.
Conclusion
Lyft is a strong player in the global ridesharing market, offering affordable and convenient transportation facilities. With continuous improvements in its services and expansion into electric vehicles, Lyft is focusing on sustainability and innovation. This company also supports drivers with flexible earning opportunities in recent years. Although it has faced much competition, Lyft’s commitment to customer satisfaction and advanced technology helps it maintain its brand position.
Looking ahead, Lyft aims to grow its market share while contributing to eco-friendly urban mobility, keeping passengers and drivers at the center of its mission.
Sources
FAQ.
Open the Lyft app, enter your destination, select your ride type, confirm pickup location, and tap “Request Lyft” to book.
Yes, Lyft offers safety features like driver background checks, in-app emergency assistance, and real-time ride tracking.
Yes, this platform offers options for groups and luxury rides, including XL for larger groups and Lux for premium experiences.
To sign up as a Lyft driver, visit their website, provide personal details, and complete the required background checks.
The company promotes sustainability by offering eco-friendly transportation options like electric vehicles, bikes, and scooters, reducing car dependency.
Saisuman is a talented content writer with a keen interest in mobile tech, new gadgets, law, and science. She writes articles for websites and newsletters, conducting thorough research for medical professionals. Fluent in five languages, her love for reading and languages led her to a writing career. With a Master’s in Business Administration focusing on Human Resources, Saisuman has worked in HR and with a French international company. In her free time, she enjoys traveling and singing classical songs. At Coolest Gadgets, Saisuman reviews gadgets and analyzes their statistics, making complex information easy for readers to understand.