Bandai Statistics By Net Sales, Market Capitalization, Segment, Region, Peak Concurrent Users And Demographics

Updated · Mar 18, 2025


TABLE OF CONTENTS
- Introduction
- Editor’s Choice
- Bandai Statistics By Net Sales
- Bandai Namco’s Net Sales By Segment
- Income Statement Of Bandai Namco Holdings Inc
- Bandai Revenue Statistics By Region
- Bandai’s New Video Game Title Releases By Region
- Bandai Statistics By Annual Video Game Unit Sales
- Leading Bandai Namco Games On Steam By Peak Concurrent Users
- Bandai’s Share Statistics, 2024
- Bandai Website Traffic Statistics By Country
- Bandai Statistics By Notable Releases Of 2024
- Conclusion
Introduction
Bandai Statistics: Bandai Namco Holdings Inc., often referred to simply as Bandai Namco, is a Japanese multinational corporation known for its diverse business operations in entertainment, toys, amusement parks, and video games. It was formed through the merger of two companies, Bandai and Namco, in 2005. The companies combined their strengths in toy manufacturing and video game development to create a powerhouse in the entertainment industry.
This article will guide you effectively as it covers all current trends and analyses of the company globally based on several insights. Let’s dive into some interesting facts and figures about Bandai Namco.
Editor’s Choice
- Worldwide net sales reached around 7 billion U.S. dollars in the financial year ending March 31, 2024, marking a 6.07% increase from last year.
- Bandai Namco’s worldwide operating income was about 600 million U.S. dollars, and its gross profit was about 2.45 billion U.S. dollars in the same period.
- The advertising cost of the company was approximately USD 426 million.
- The company’s market capitalization was approximately $12.42 billion in June 2024, reflecting a 54.1% increase over the past year.
- By the end of 2024, Japan will generate the highest revenue worldwide, accounting for 5 billion U.S. dollars, followed by Europe (USD 680 million).
- In fiscal year 2023, Bandai Namco Holdings captured 84% of the Japanese plastic character model market.
- On the other hand, Bandai Namco Holdings held a 60% share of the Japanese digital card game market in 2023.
- Similarly, Bandai Statistics further states that the worldwide operating income was about 600 million U.S. dollars by 2024.
- In Q1 2024, the total sales through home video games the company generated approximately USD 159.8 billion (USD 0.99 billion).
- To date, around 50 patents have been granted by the end of 2024.
- As of March 31, 2024, overall sales generated through Bandai’s Dragon Ball intellectual property amounted to around 930 million U.S. dollars globally.
You May Also Like To Read
- Bosch Statistics
- Kawasaki Statistics
- Navistar Statistics
- BYD Statistics
- Stellantis Statistics
- Great Wall Motors Statistics
- Maybach Statistics
- Buick Statistics
- Lyft Statistics
Bandai Statistics By Net Sales
- In the fiscal year ending on March 31, 2024, Bandai Namco’s worldwide net sales reached around 7 billion U.S. dollars, marking a 6.07% increase from the previous year’s quarter.
Here are the net sales statistics for Bandai Namco from 2006 to 2023:
| Year | Net Sales (USD billions) |
| 2023 | 8.67 |
| 2022 | 8.16 |
| 2021 | 6.97 |
| 2020 | 6.6 |
| 2019 | 6.59 |
| 2018 | 6.08 |
| 2017 | 5.51 |
| 2016 | 5.12 |
| 2015 | 4.89 |
| 2014 | 4.56 |
| 2013 | 4.14 |
| 2012 | 3.99 |
| 2011 | 3.53 |
| 2010 | 3.47 |
| 2009 | 3.91 |
| 2008 | 4.15 |
| 2007 | 3.95 |
| 2006 | 3.88 |
(Source: statista.com)
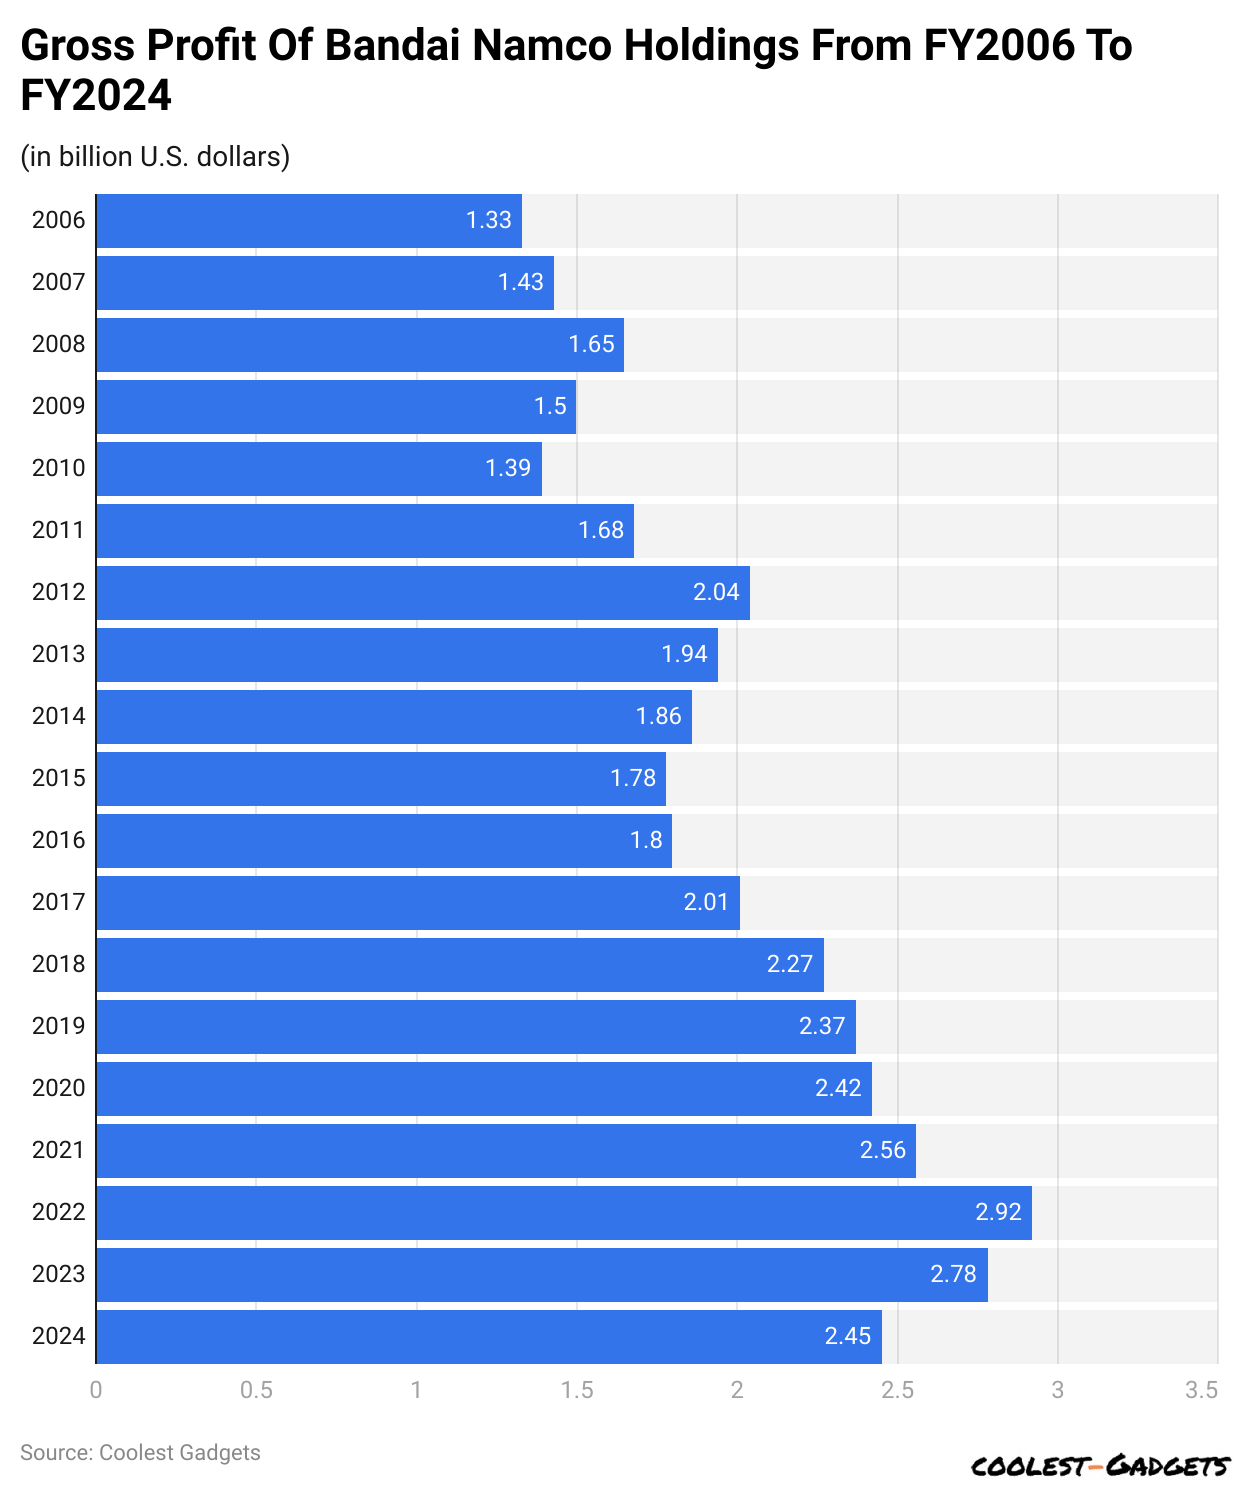
By Gross Profit
 (Reference: statista.com)
- Bandai Statistics also show that by the end of March 31, 2024, Bandai Namco’s worldwide gross profit was about 2.45 billion U.S. dollars.
- The company’s gross profit was around USD 2.78 billion in 2023, down from USD 2.92 billion in 2022.
In contrast, other gross profits of Bandai Namco Holdings from 2006 to 2021 are detailed below:
| Year | Net Sales (USD billions) |
| 2021 | 2.56 |
| 2020 | 2.42 |
| 2019 | 2.37 |
| 2018 | 2.27 |
| 2017 | 2.01 |
| 2016 | 1.80 |
| 2015 | 1.78 |
| 2014 | 1.86 |
| 2013 | 1.94 |
| 2012 | 2.04 |
| 2011 | 1.68 |
| 2010 | 1.39 |
| 2009 | 1.50 |
| 2008 | 1.65 |
| 2007 | 1.43 |
| 2006 | 1.33 |
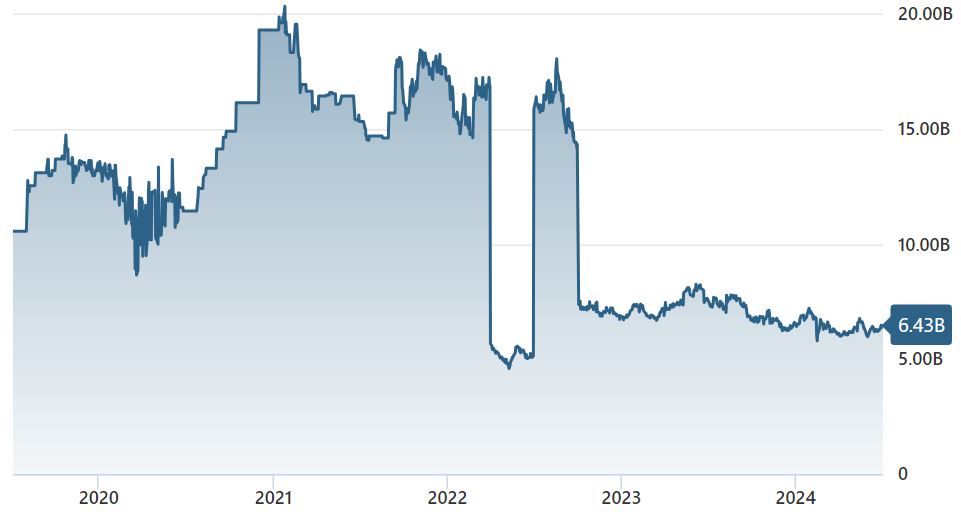
By Market Capitalization
 (Source: stockanalysis.com)
- In June 2024, the company’s market capitalization is approximately $12.42 billion, reflecting a 54.1% increase over the past year.
On the other hand, Bandai Statistics further elaborates that the monthly market cap in 2023 and 2024 is described below:
| Monthly market cap (USD billion) | 2023 and change % | 2024 and change % |
| January | 7.35 (8.16%) | 7.11 (7.91%) |
| February | 6.83 (-7.01%) | 6.52 (-8.33%) |
| March | 6.88 (0.77%) | 6.08 (-6.77%) |
| April | 7.47 (8.44%) | 6.15 (1.19%) |
| May | 7.71 (3.27%) | 5.96 (-3.00%) |
| June | 7.61 (-1.28%) | 6.29 (5.41%) |
| July | 7.43 (-2.41%) | – |
| August | 7.60 (2.31%) | – |
| September | 6.68 (-12.08%) | – |
| October | 6.82 (2.05%) | – |
| November | 6.54 (-4.04%) | – |
| December | 6.59 (0.71%) | – |
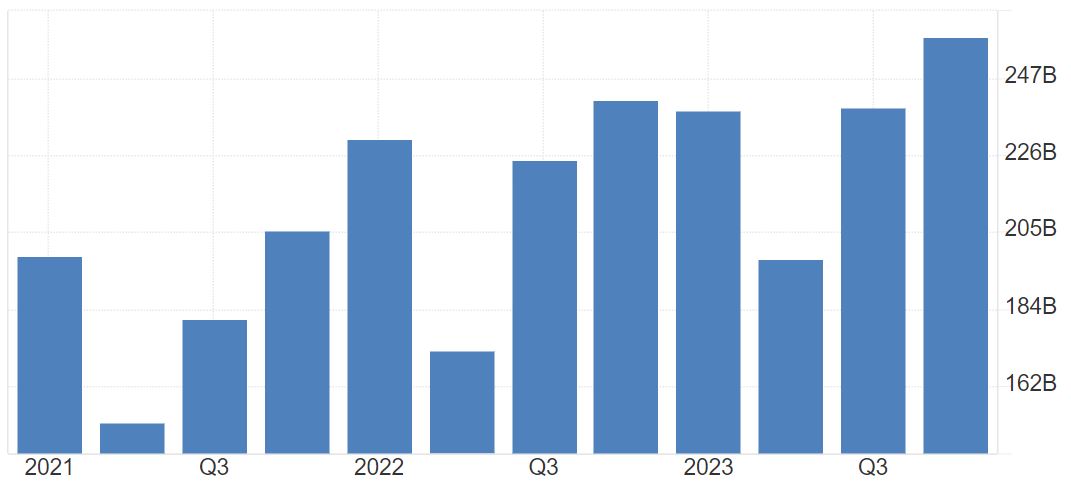
By Operating Expenses
 (Source: tradingeconomics.com)
- Bandai Namco Holding’s 2024 quarterly operating expenses were JPY 198 billion (USD 1.23 billion) in Q1 (-17.1%) and JPY 239 billion (USD 1.49 billion) in Q2 (up 21% from the previous quarter).
- However, in the third quarter of 2024, the company’s estimated expenses will be JPY 258 billion (USD 1.60 billion), up by 8.1%.
By Market Share
- Bandai Statistics 2023, Bandai Namco Holdings captured 84% of the Japanese plastic character model market.
- Moreover, the company captured around 55% of the Japanese capsule toy (gacha) market, followed by the digital card game market (60%) and the card game market (6%).
You May Also Like To Read
- Ferrari Statistics
- Fiat Statistics
- Ford Statistics
- General Motors Statistics
- Honda Statistics
- Hyundai Statistics
- Infiniti Statistics
- Isuzu Statistics
- Jaguar Statistics
- Jeep Statistics
- Kia Statistics
Bandai Namco’s Net Sales By Segment
 (Reference: statista.com)
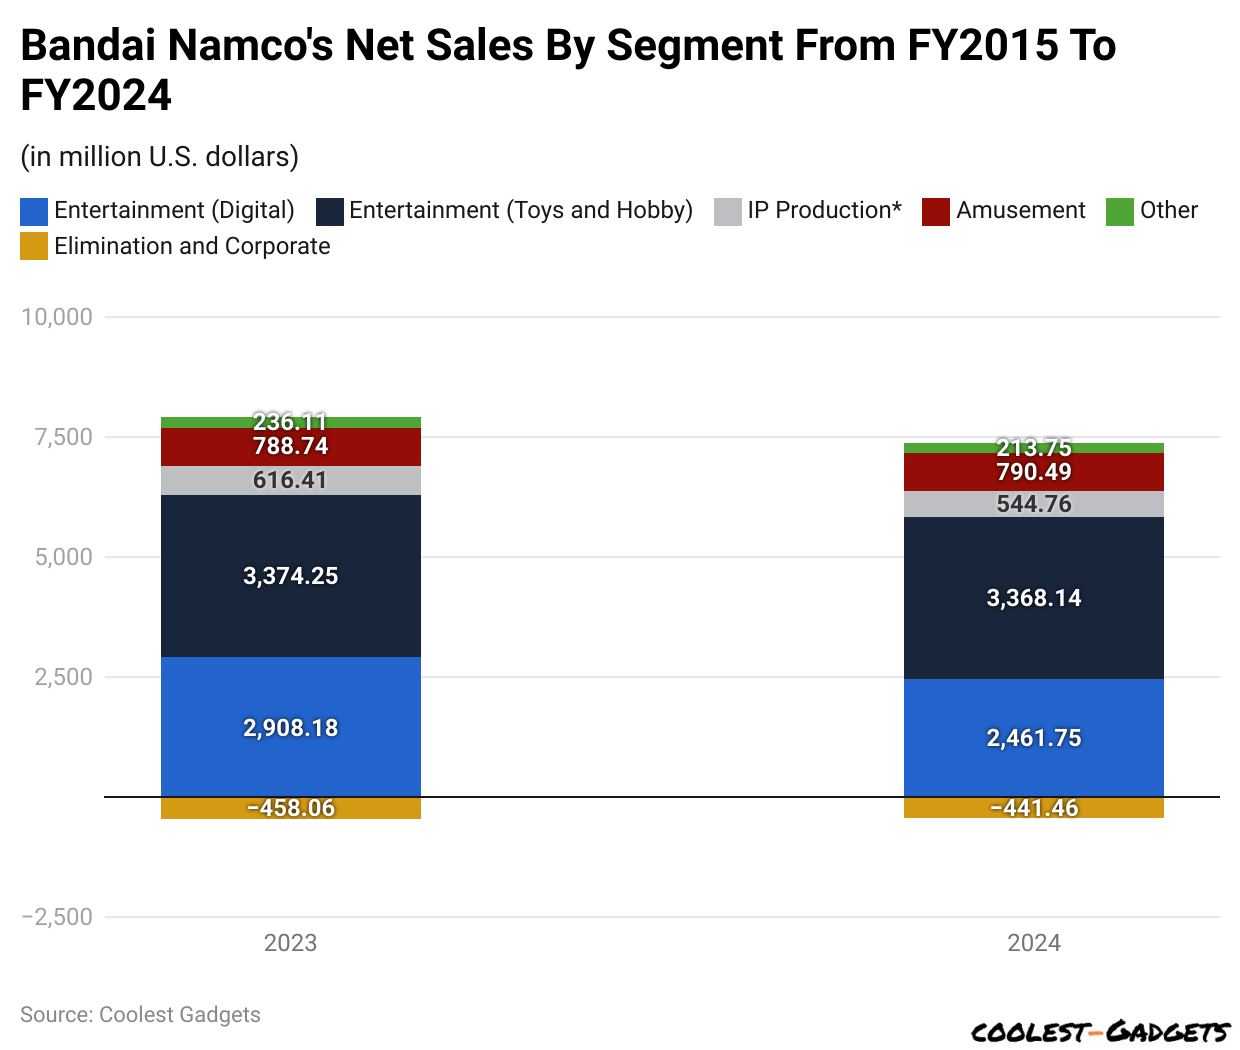
- As per Bandai Statistics 2024, the entertainment (Toys and Hobbies) segment will have the highest net sales, resulting in USD 3,368.14 million, followed by entertainment: digital (USD 2,461.75 million).
- Other segments’ net sales include Amusement (USD 790.49 million), I.P. Production (USD 544.76 million), others (USD 213.75 billion), and Elimination and Corporate (-441.46 million).
Furthermore, segmental net sales (in USD millions) of Bandai Namco in 2023 are depicted in the table below:
| Entertainment (Digital) | Entertainment (Toys and Hobby) | I.P. Production | Amusement | Other | Elimination and Corporate |
| 2,908.18 | 3,374.25 | 616.41 | 788.74 | 236.11 | -458.06 |
Income Statement Of Bandai Namco Holdings Inc
| (USD million) | F.Y. 2023 | Growth Rate | F.Y. 2024 | Growth Rate | ||
| First half | Second half | Overall | ||||
| Net Sales | 6176.09 | 111.3% | 2963.01 | 3274.9 | 6237.91 | 101% |
| Gross Profit | 2299.64 | 103.5% | 1185.2 | 1247.58 | 2432.78 | 105.8% |
| Operating Profit | 726.54 | 92.8% | 374.27 | 405.46 | 779.74 | 107.3% |
| Recurring Profit | 798.49 | 95.8% | 386.75 | 417.94 | 804.69 | 100.8% |
| Profit Attributable to Owners of Parent |
563.56 | 97.4% | 274.47 | 293.18 | 567.65 | 100.7% |
Bandai Revenue Statistics By Region
| (USD million) | F.Y. 2023 | Growth Rate (YoY) | F.Y. 2024 | Overall 2024 | Growth Rate (YoY) | |
| Country | First half | Second half | ||||
| Japan | 4413.51 | 113.1% | 2130.25 | 2311.15 | 4441.39 | 101% |
| Americas | 619.7 | 100.1% | 296.3 | 324.37 | 620.67 | 100.20% |
| Europe | 589.22 | 114.4% | 265.11 | 318.13 | 583.24 | 99% |
| Asia | 553.66 | 108.2% | 271.35 | 321.25 | 592.6 | 107% |
| Total | 6176.09 | 111.3% | 2963.01 | 3274.9 | 6237.91 | 101% |
(Source: bandainamco.co)
Bandai’s New Video Game Title Releases By Region
 (Reference: statista.com)
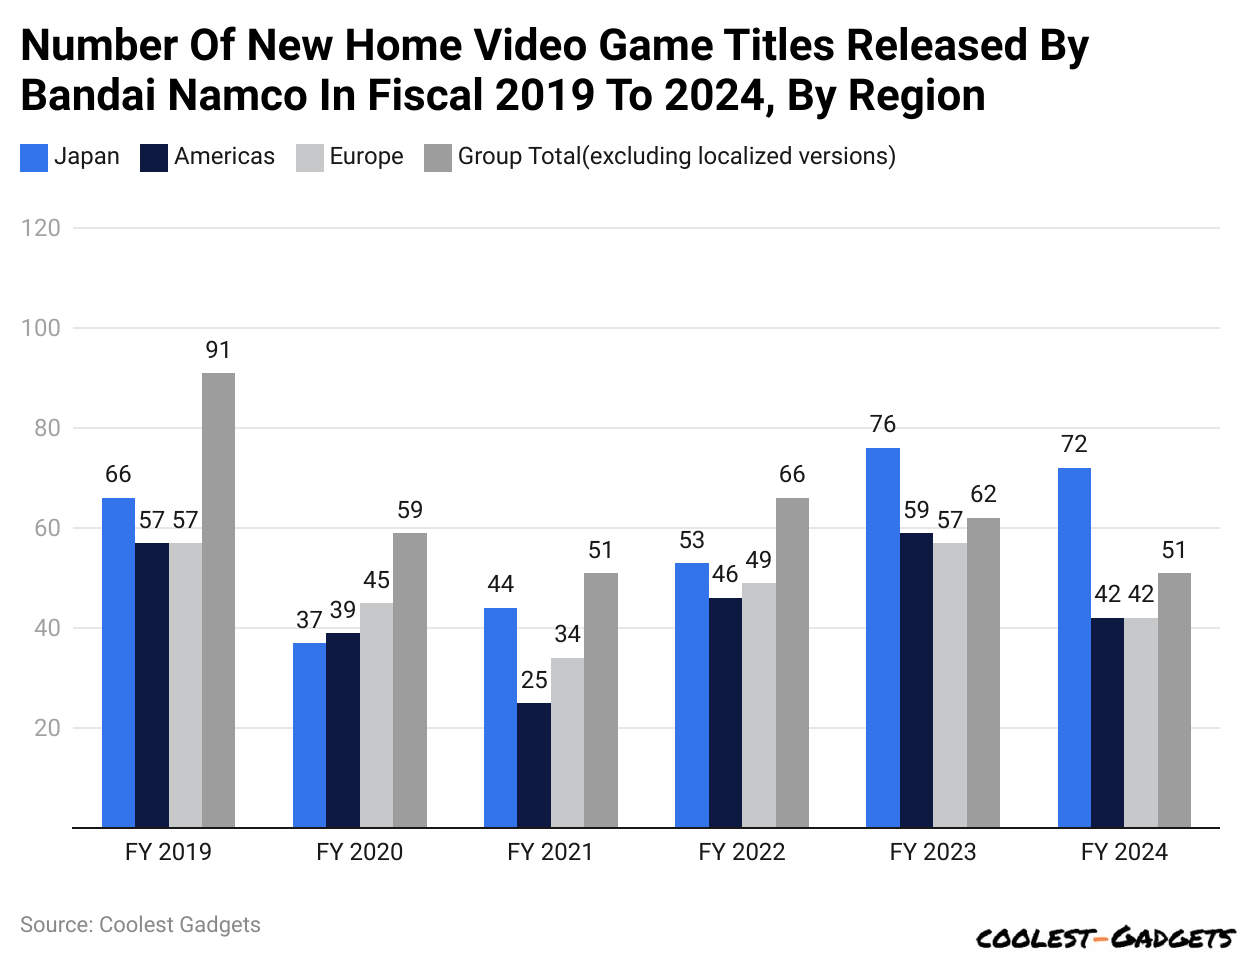
- Banadai Statistics also show that by the year ending March 2024, Bandai Namco released 72 of the highest new gaming titles in Japan.
- In contrast, the total number of new home video game titles released by Bandai Namco in other regions are Americas (42), Europe (42), and group total excluding localized versions (51).
Other title releases in previous years are depicted below:
| Year | Japan | Americas | Europe | Group Total |
| 2023 | 76.00 | 59 | 57 | 62 |
| 2022 | 53 | 46 | 49 | 66 |
| 2021 | 44 | 25 | 34 | 51 |
| 2020 | 37 | 39 | 45 | 59 |
| 2019 | 66 | 57 | 57 | 91 |
Bandai Statistics By Annual Video Game Unit Sales
 (Reference: statista.com)
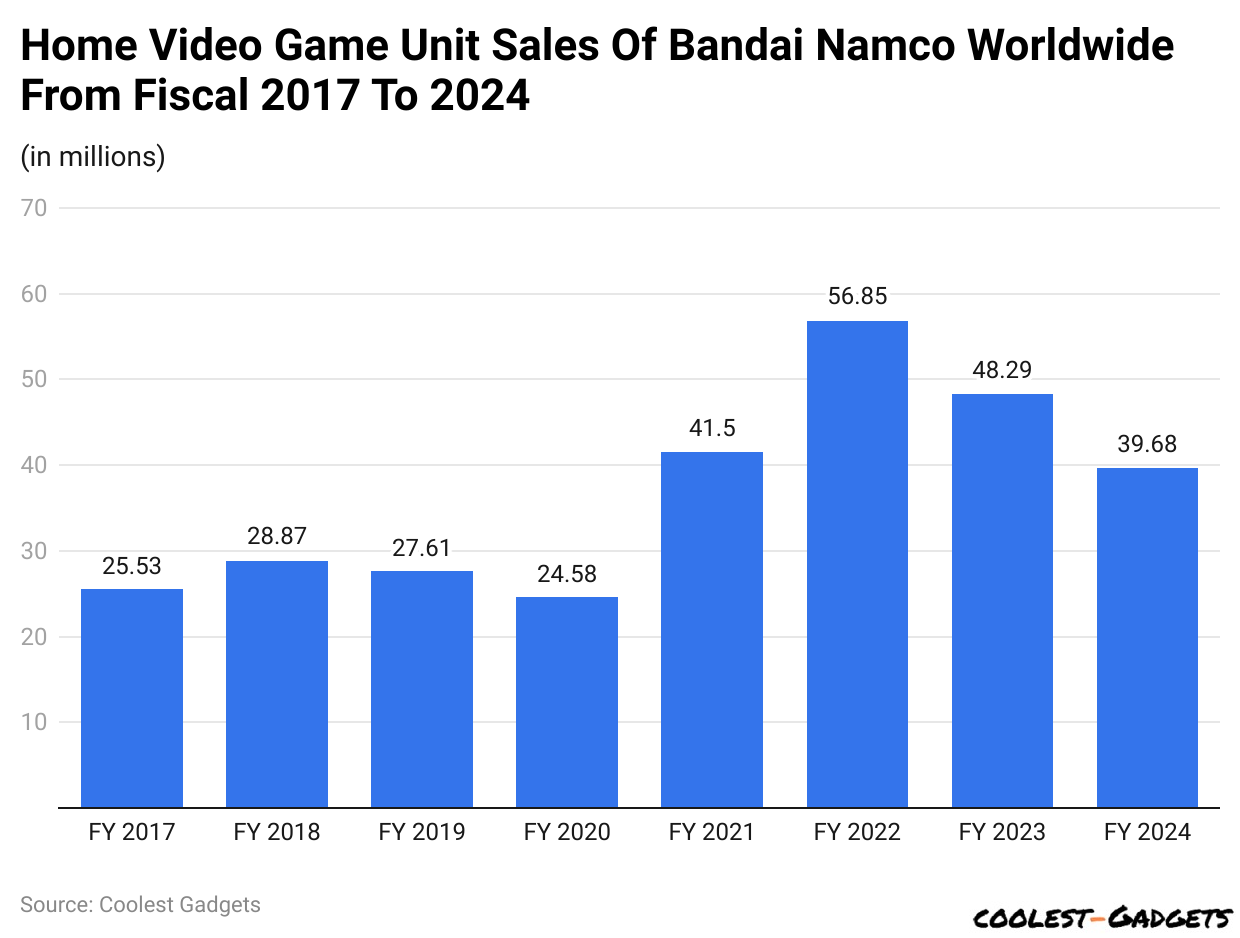
- By the end of March 2024, Bandai sold out around 39.7 million units of home video games, a decrease from 48.3 million units sold in 2023.
- On the other hand, the annual video game sales (in million units) in previous years were 2022 (56.85), 2021 (41.5), 2020 (24.58), 2019 (27.61), 2018 (28.87), and 2017 (25.53).
Leading Bandai Namco Games On Steam By Peak Concurrent Users
 (Reference: statista.com)
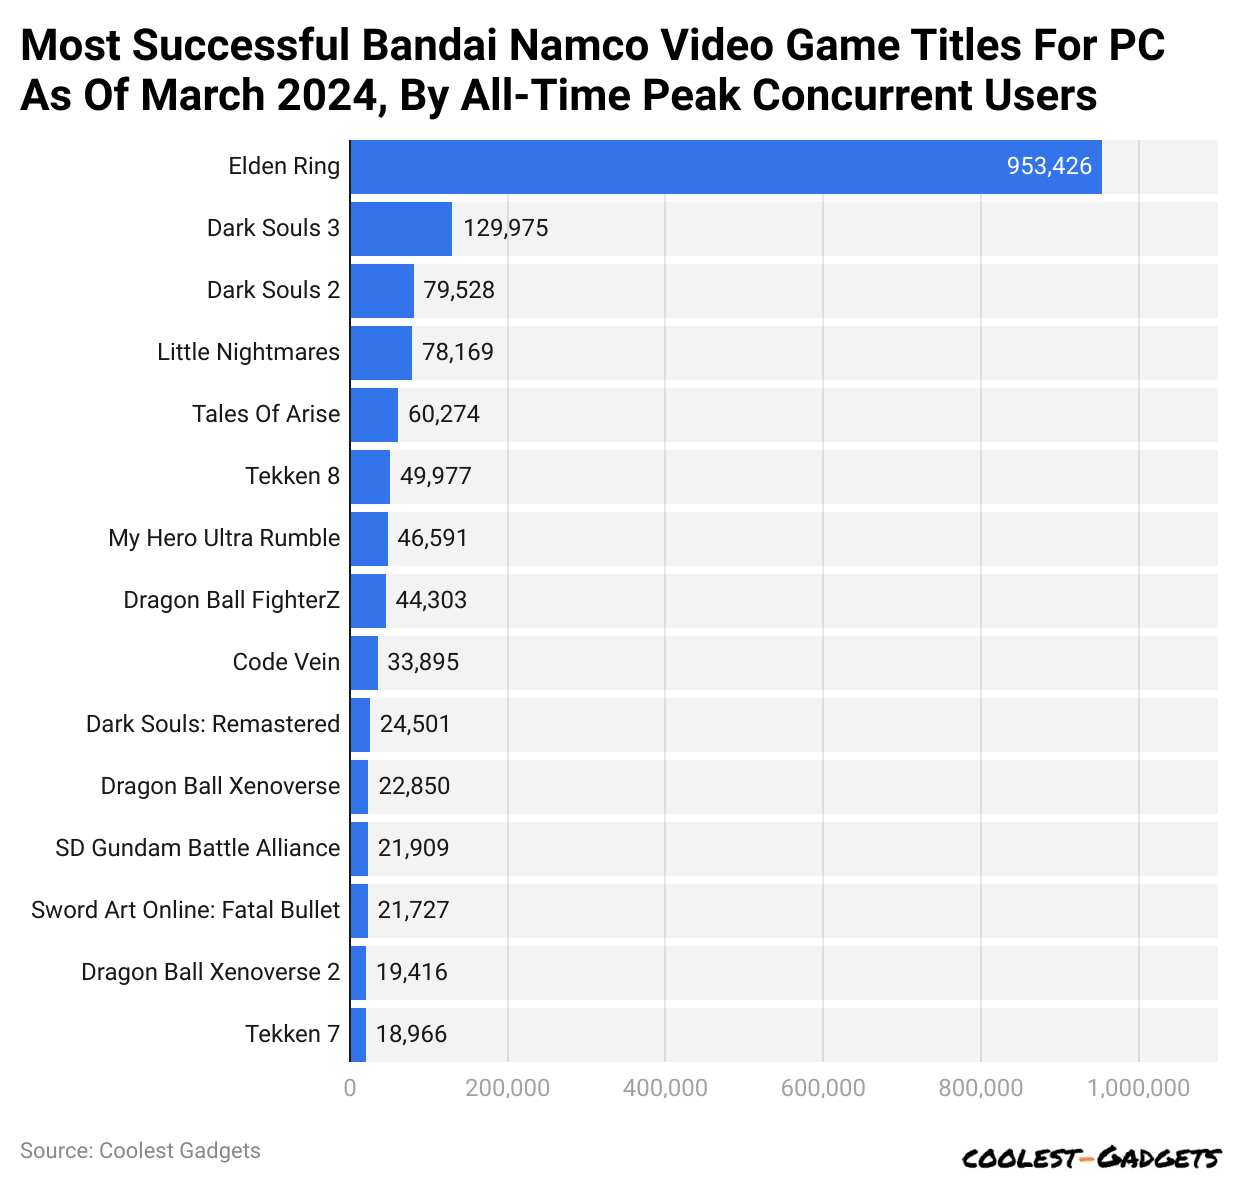
- Bandai Statistics further represents that as of March 2024, the most successful Bandai Namco video game title for P.C. is Elden Ring, with 953,426 all-time peak concurrent users.
- Furthermore, other video game titles for P.C. by total users are followed by Dark Souls III (129,975), Dark Souls II (79,528), Little Nightmares (78,169), Tales of Arise (60,274), Tekken 8 (49,977), My Hero Ultra Rumble (46,591), Dragon Ball FighterZ (44,303), Code Vein (33,895), Dark Souls: Remastered (24,501), Dragon Ball Xenoverse (22,850), S.D. Gundam Battle Alliance (21,727), Dragon Ball Xenoverse 2 (19,416), and Tekken 7 (18,966).
You May Also Like To Read
- Audi Statistics
- Alfa Romeo Statistics
- Aston Martin Statistics
- Bentley Statistics
- BMW Statistics
- Bugatti Statistics
- Chevrolet Statistics
- Citroën Statistics
- Daihatsu Statistics
| Avg Vol (3 month) | JPY 1.87 million (USD 0.11 million) |
| Avg Vol (10 days) | JPY 1.77 million (USD 0.11 million) |
| Shares Outstanding | JPY 654.39 million (USD 4.08 million) |
| Implied Shares Outstanding | JPY 661.71 million (USD 4.12 million) |
| Float | JPY 598.13 million (USD 3.73 million) |
| % Held by Insiders | 14.56% |
| % Held by Institutions | 37.62% |
(Source: finance.yahoo.com)
Bandai Website Traffic Statistics By Country
 (Reference: similarweb.com)
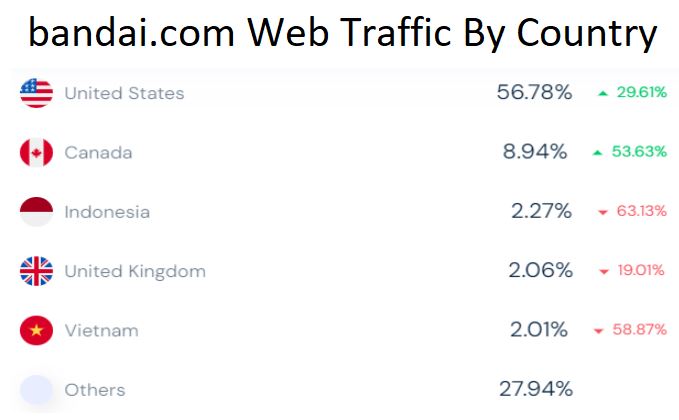
- The total number of website visits to Bandai in May 2024 was 211.7 thousand, up 6.67% from last month and with a bounce rate of 47.3%.
- As mentioned in Bandai Statistics, the United States had 56.78% of total traffic on bandai.com, but it recorded an increase in total website visitors by 29.61%.
- Other countries recorded the following contributions in total traffic: Canada = 8.94% (+53.63%), Indonesia = 2.27% (-63.13%), the United Kingdom = 2.06% (-19.01%), and Vietnam = 2.01% (-58.87%).
- Additionally, other countries collectively made around 27.94% of traffic on bandai.com.
By Device
 (Reference: semrush.com)
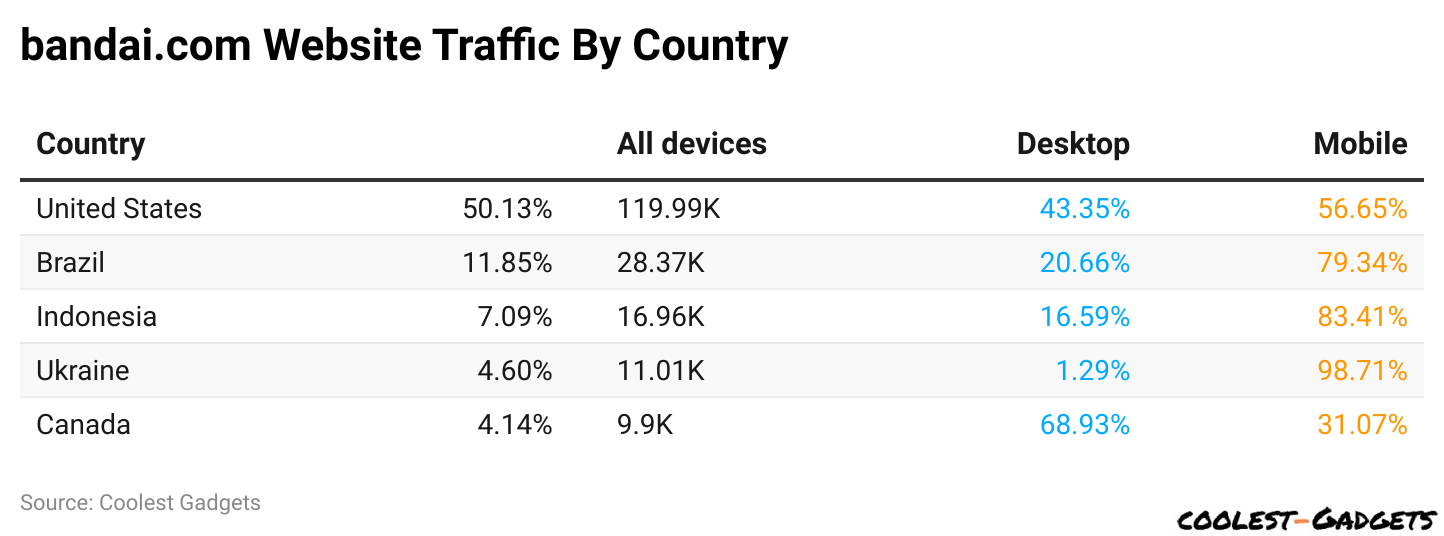
- As of May 2024, around 42.37% of the world’s Bandai players are desktop, and 57.63% are mobile gamers on bandai.com.
- Meanwhile, 50.13% of total Bandai gamers belong to the United States of America, which is 119.99 thousand; out of these,43.35% are desktop players, and 56.65% are mobile players.
- Brazil has 28.37K players, of which 11.85% play desktop games, 20.66% play mobile devices, and 79.34% play mobile games.
- Bandai Statistics also show that 7.09% of the total players are from Indonesia, resulting in 16.96K, with 16.59% access to the desktop version and 83.41% access to mobile devices.
- In Ukraine and Canada, there are around 11.01K and 9.9K players, respectively, resulting in 4.6% and 4.14%.
- Out of these, in Ukraine, 1.29% of players are desktop players, and 98.71% are mobile players, while in Canada, around 68.93% of players access Bandai on desktop, and 31.07% play on mobile.
By Demographics
 (Reference: similarweb.com)
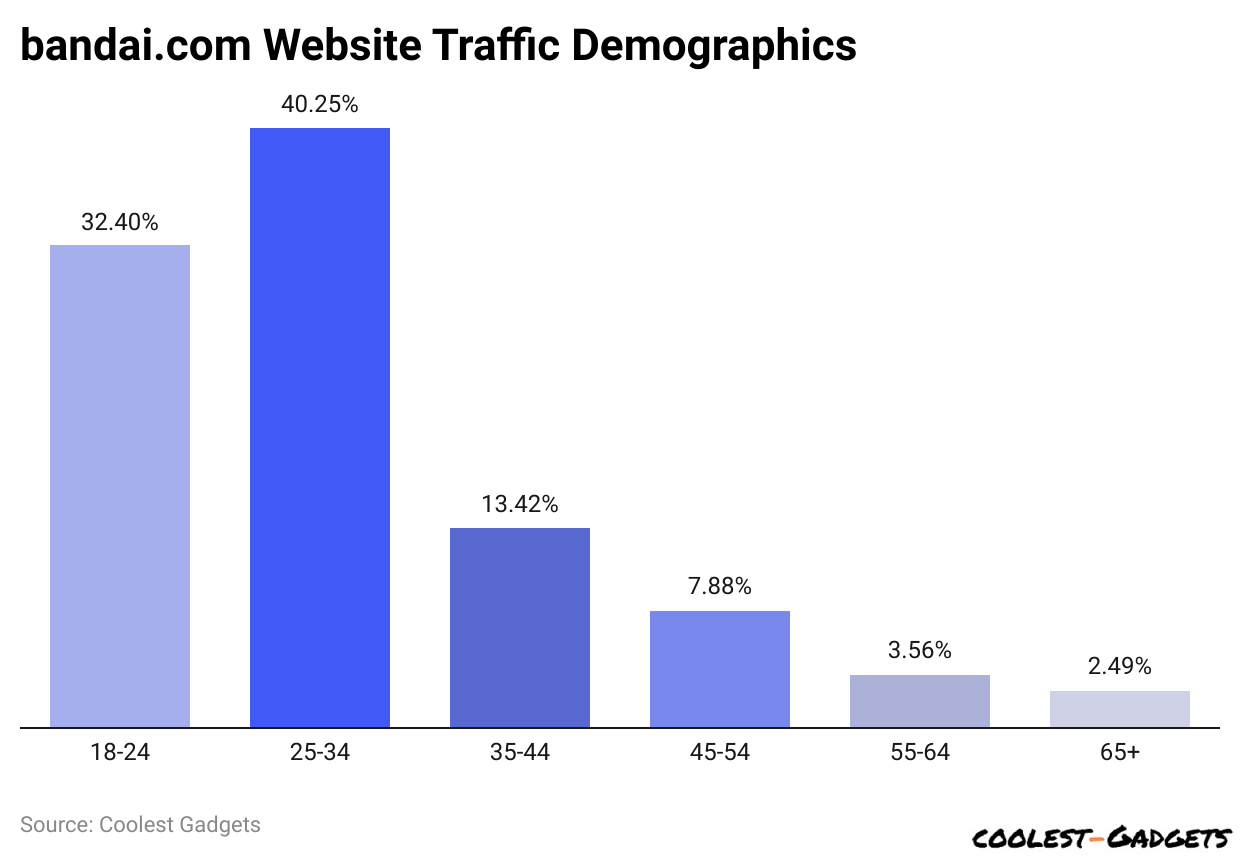
- As of May 2024, the Bandai Statistics by demographic state that the highest number of gamers observed is between the ages of 25 and 34, resulting in 40.25%.
- Around 32.4% of Bandai players are between 18 and 24 years old.
- Besides, 13.42% and 7.88% belong to the 35 to 44-year-old and 45 to 54-year-old age groups, respectively.
- 3.56% of players are aged between 55 years to 64 years.
- And 2.49% of Bandai gamers are contributing from the age group of 65 years.
- On this bandai.com website, male users secured the highest share, 67.46%, and females with 32.54%.
By Traffic Sources
 (Reference: similarweb.com)
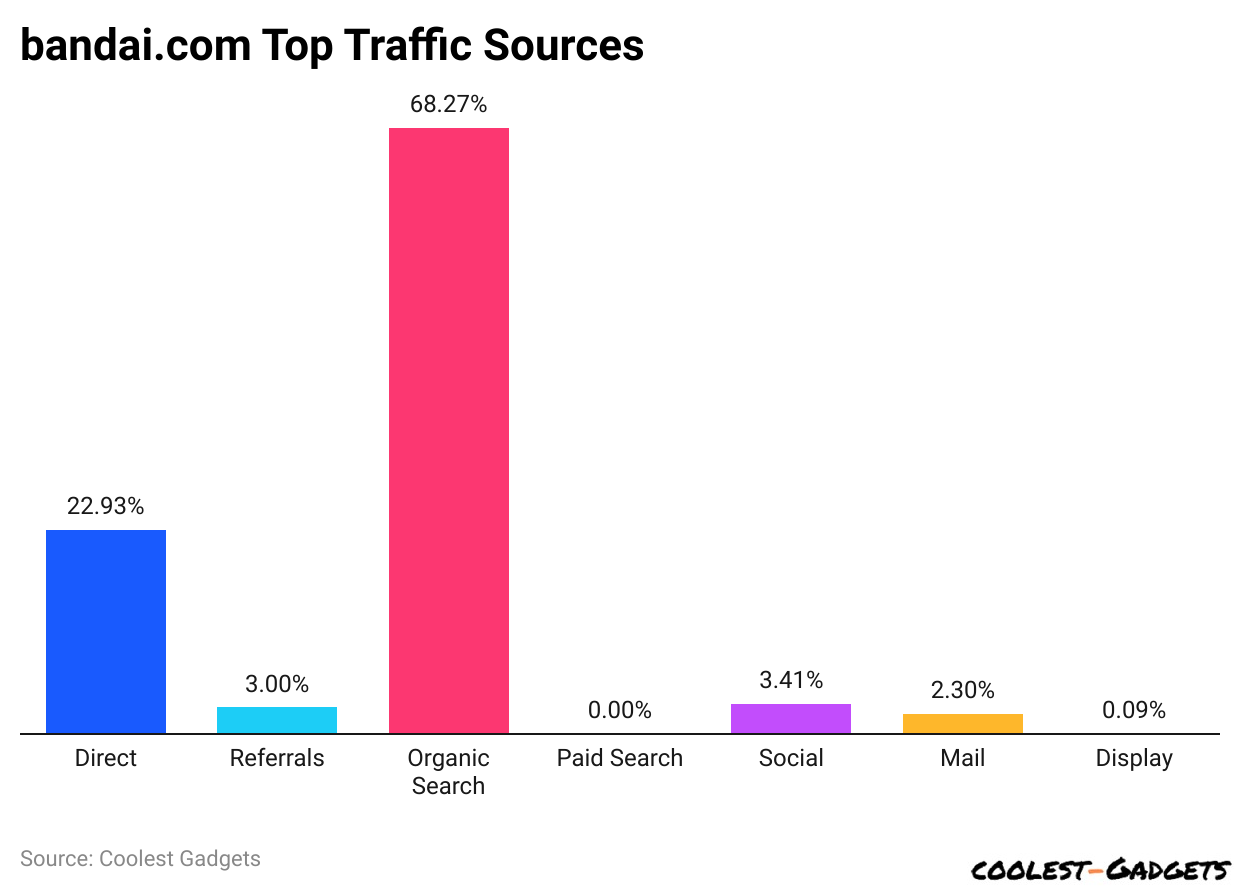
- As mentioned in Bandai statistics, the highest rate of traffic to bandai.com is from organic search, which is 68.27%.
- Moreover, 22.93% is direct traffic, while 3.41% is from social search.
- Furthermore, other traffic sources to bandai.com are referral (3%), mail (2.3%), and display (0.09%).
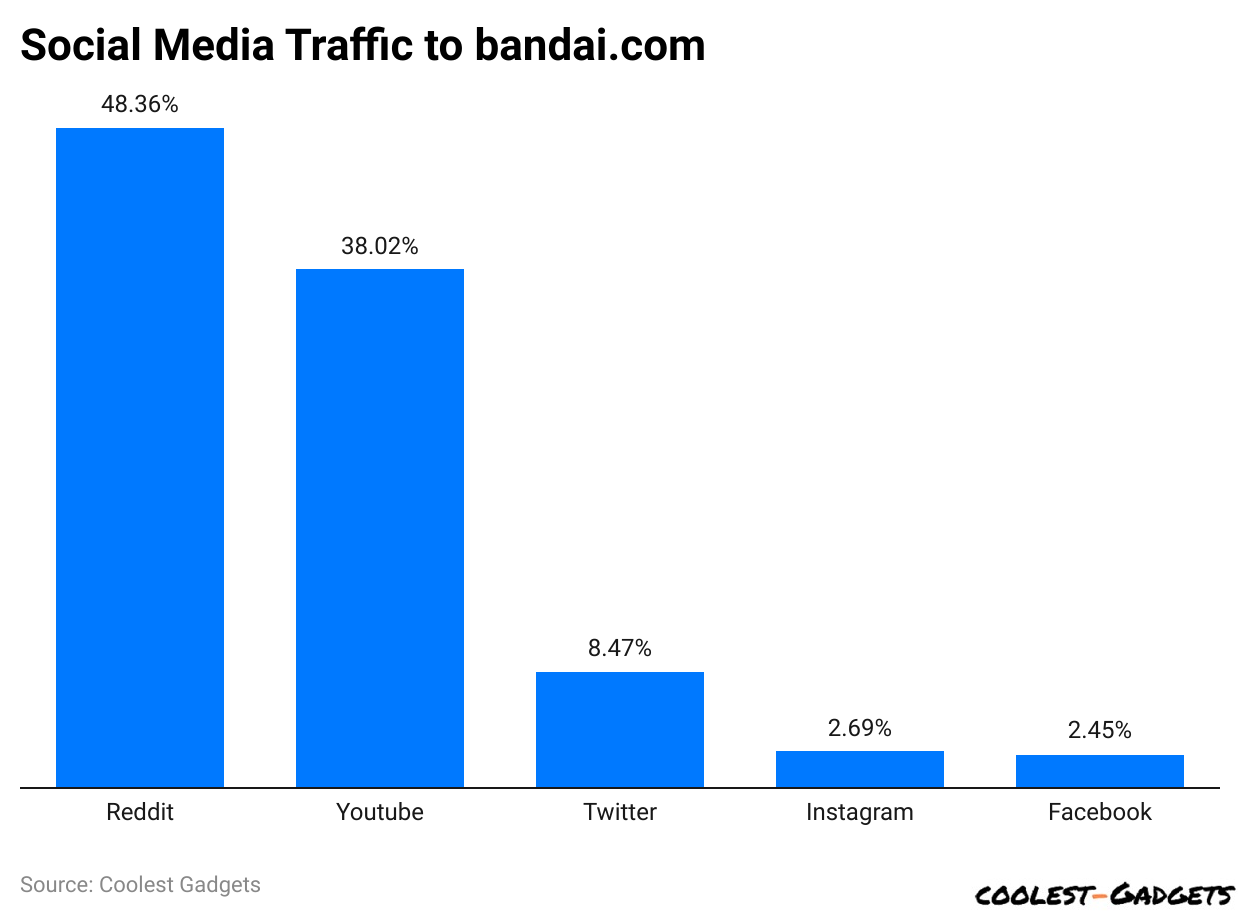
By Social Media Referral Rate
 (Reference: similarweb.com)
- Based on Bandai Statistics, Reddit has the highest social media referral rate on bandai.com, resulting in 48.36% more referrals than other social networks.
- YouTube and Twitter each contributed 38.02% and 8.47%.
- Traffic sent by Instagram was 2.69%, and Facebook made up 2.45% of the website.
Bandai Statistics By Notable Releases Of 2024
| Name | Release Date | Price | Description |
| Tekken 8 | January 26 |
|
This latest installment in the Tekken series includes enhanced graphics, new characters, and updated mechanics, which will drive significant sales (Releases) (Bandai Namco Entertainment Store). |
| Jujutsu Kaisen Cursed Clash | February 2 |
|
Leveraging the popularity of the Jujutsu Kaisen anime, this game aims to attract a large fanbase, boosting overall sales for the quarter (Bandai Namco Entertainment Store) (Releases). |
| Dragon Ball FighterZ | February 29 | – | Continuation of the successful Dragon Ball FighterZ series, known for its fast-paced fighting gameplay and strong competitive scene (Releases). |
| SAND LAND | April 26 | USD 59.99 | This game is based on the popular manga by Akira Toriyama, which attracts fans of his work and contributes to strong sales figures. |
| Elden Ring: Shadow of the Erdtree: | May 21 |
|
As an expansion to the critically acclaimed Elden Ring, this release is expected to significantly boost engagement and sales for the game (Bandai Namco Entertainment Store). |
Conclusion
Looking ahead, Bandai Namco continues to focus on expanding its reach and enhancing its product offerings. The company remains a dynamic and influential entity in the global entertainment landscape. By combining a rich heritage with forward-looking strategies, it continues to captivate audiences worldwide and lead the industry in creating engaging high-quality entertainment experiences.
Sources
Joseph D'Souza started Coolest Gadgets in 2005 to share his love for tech gadgets. It has since become a popular tech blog, famous for detailed gadget's reviews and companies statistics. Joseph is committed to providing clear, well-researched content, making tech easy to understand for everyone. Coolest Gadgets is a trusted source for tech news, loved by both tech fans and beginners.