Globalization Statistics By Global Corn Production, Country and Attitude of People Towards Globalization

Updated · Mar 10, 2025


TABLE OF CONTENTS
- Introduction
- Editor’s Choice
- General Globalization Statistics
- By Number of Policies Implemented By Type
- By Consumer Confidence In Developed And Emerging Countries
- By Top 20 Countries With The Lowest GDP Per Capita
- By Index Field Of Globalization By Sector
- By Social Globalization Index Field
- By Political Globalization
- By Economic Globalization
- By Global Corn Production
- By The Attitude of People Toward Globalization
- By Trade Trends In Major Economic Countries
- By Changes In Bilateral Trade Dependences In Q3 Of 2023
- Globalization Statistics By Trade Trends By Sectoral Level In 2023
- By Leading Rice Exporting Countries
- Top 10 Strongest Export Countries
- By Annual Average GDP Growth Rates By Region
- Globalization Trends Worldwide
- Conclusion
Introduction
Globalization Statistics: Globalization has facilitated the acceptance of modern concepts and the transformation of residents’ lifestyles in various countries, leading to interconnectedness and fostering cultural exchange, economic growth, technological progress, and more.
However, the COVID-19 pandemic has caused setbacks in these areas, resulting in layoffs, economic losses, and development challenges. Current globalization statistics indicate that the world is still recovering from the events of 2020.
Editor’s Choice
- Global trade is expected to grow by 2.6% in 2024, rebounding from a 1.2% decline in 2023.
- The value of global trade fell by 3% in 2023, with goods trade dropping 5% but services trade growing 8%.
- Trade in environmental products, particularly electric cars, increased by 2% in 2023.
- Developing countries experienced sharper declines in trade, with imports and exports falling by 5% and 7%, respectively.
- The US-China economic rivalry continues, but both nations are making diplomatic efforts to manage tensions.
- Climate-related disruptions are expected to continue impacting global trade and production, with extreme weather events becoming more frequent.
- Global growth is projected at 3.1% in 2024, with inflation expected to fall to 5.8%.
- Digitally enabled trade in services is booming, driven by advancements in technology like simultaneous speech translation.
- Between 2009 and 2023, the most common type of trade liberalization policy globally was tariff measures, totaling 4,700 instances.
- In 2023, global trade in goods was reduced by around USD 2 trillion, while trade in services increased by USD 500 billion.
- The global average of consumer confidence in developed and emerging countries is 47.2.
- Luxembourg led in social globalization in 2023 with a score of 90.25.
- 66% of people globally agree that globalization is good for their country, while 23% disagree.
- The global inflation rate for 2024 is forecasted at 5.8%.
- As of 2023, Burundi had the lowest gross domestic product per capita at USD 245.81.
- Greece has the highest number of people negative towards globalization.
- In 2023, the global fish production volume was 186.6 million metric tons.
You May Also Like To Read
- Endangered Species Statistics
- Food Waste Statistics
- Climate Change Statistics
- Statistics About Flooding And Water Damage in The USA
- Reusable Water Bottle Statistics
- Electric Vehicle Statistics
- Gun Violence Statistics
General Globalization Statistics
- According to Globalization Statistics 2023, in the mentioned year, global trade in goods was reduced by around $2 trillion, on the other hand, trade in services increased by $500 billion.
- The global inflation rate for 2024 is forecasted at 5.8%.
- Furthermore, the inflation rate in the US in January 2024 is 3.1%.
- In 2023, Globalization Statistics state the monthly change in global goods trade was 0.4%.
- In a similar year, the global fish production volume amounted to 186.6 million metric tons.
- A growing impact on global trade has been observed due to a reduction in interdependence between the USA and China.
- As per a report World Trade Statistical Review 2023 by the World Trade Organization, between October 2022 and May 2023, the US dollar currency value was reduced by 5.9% which helped to ease the pressure in global financial markets.
- In Q1 of 2023, the trade value of agricultural products was only 4% compared to Q2 of 2022 representing 13%.
- In Q1 of 2023, considering the region-wise export growth, all of which recorded negative as follows Africa (-10%), South America (-0.4%), Asia (-5%), Middle East (- 7%).
- Furthermore, in a similar quarter, imports of food and energy prices reduced imports bills contributing as follows Asia (6%), South America (5%), Africa (2%), North America (2%), and Europe (1%).
- In 2024, projected growth in world trade is 3.3%.
- By 2024, global gross domestic product is estimated to reach $133,782.89 billion.
- Globalization Statistics state the global average of exports is 140 billion, while $17,643 is a GDP per capita and 3.3% GDP growth rate in terms of the global average.
- In Q2 of 2023, the total imports and exports of the G20 aggregate were 60%.
By Number of Policies Implemented By Type
- Between 2009 and 2023, the most common type of trade liberalization policy incorporated globally was tariff measures contributing 4,700.
- Furthermore, the most often affected products due to anti-trade liberalization policies between similar years were iron and steel resulting in 3,200 and the most often used protectionist trade policies with more than 25,000 measures were subsidies by governments around the world.
- Moreover, between 2009 and 2023, India incorporated the highest liberalizing trade policy measures contributing 933.
- The United States of America implemented the highest global trade liberalization policies resulting in 9,500 between similar years.
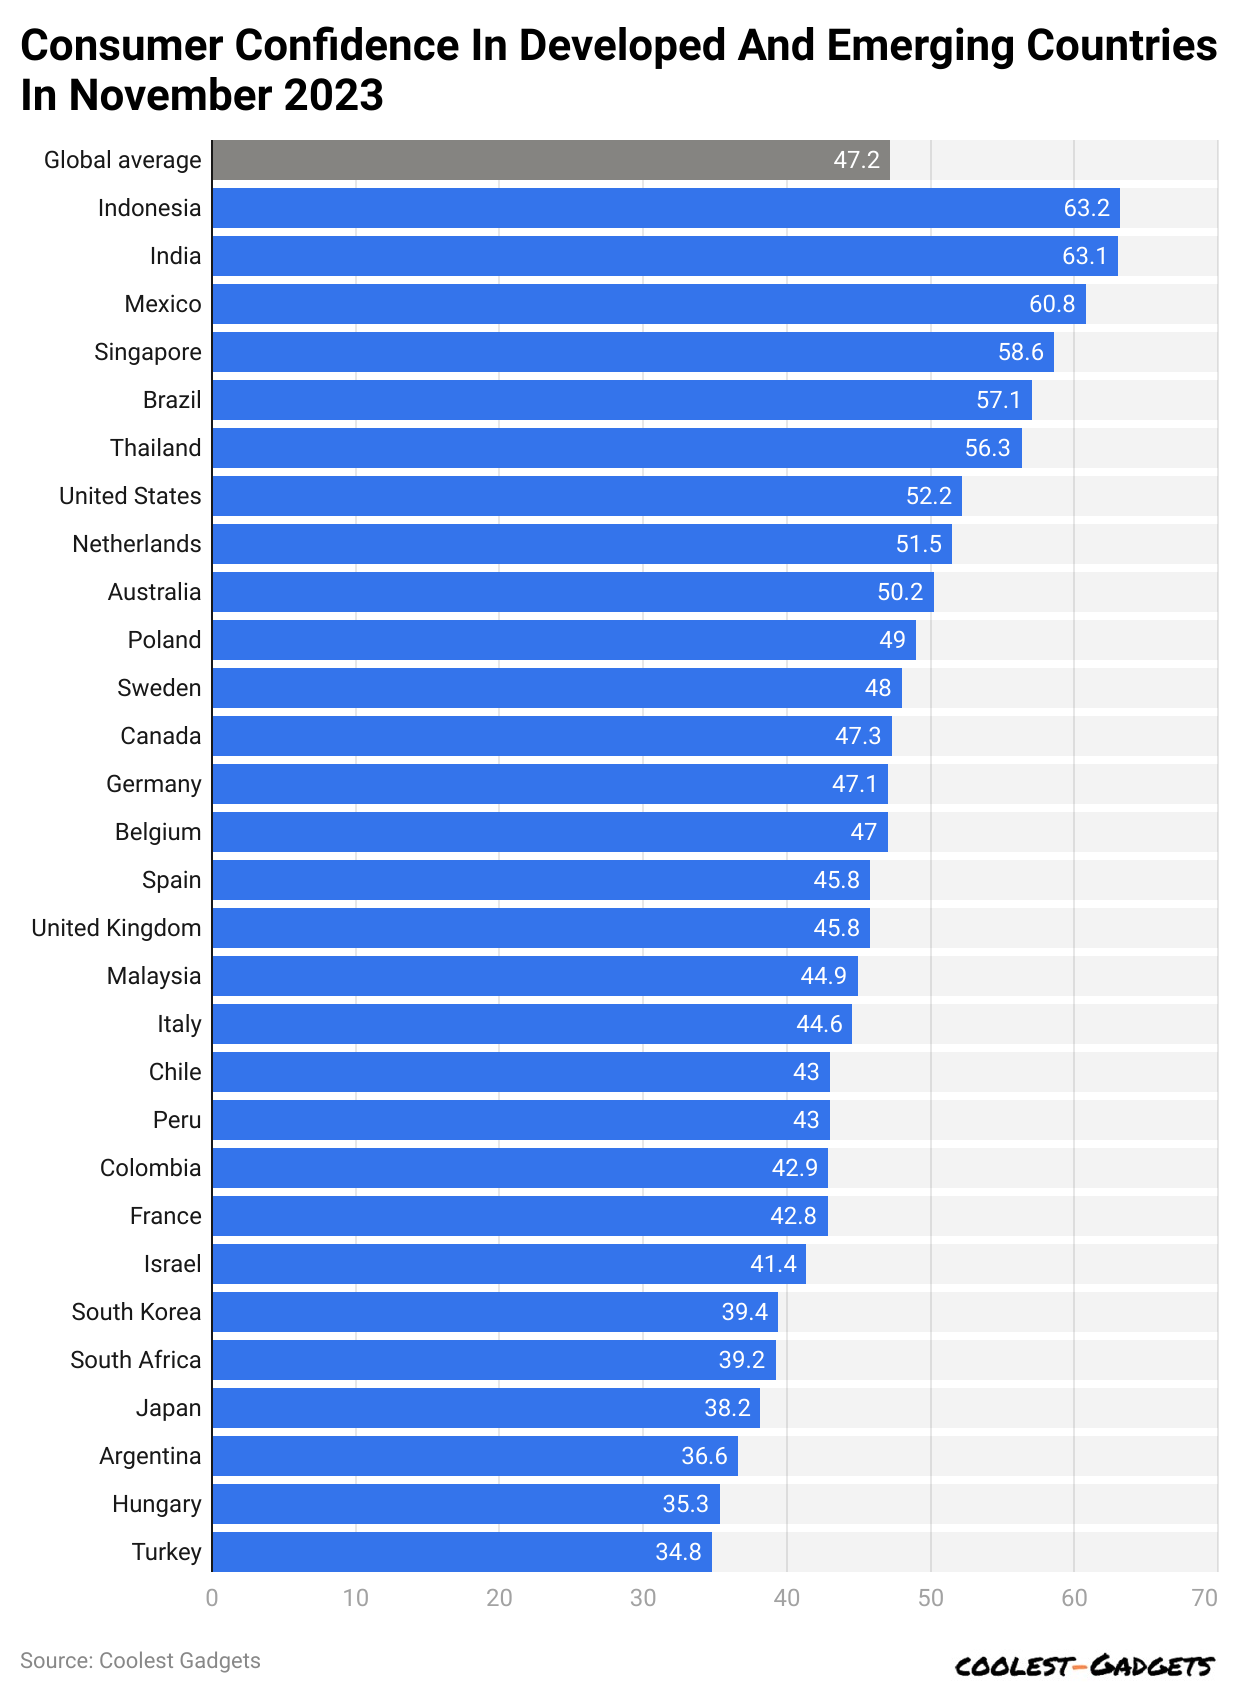
By Consumer Confidence In Developed And Emerging Countries
 (Reference: statista.com)
Considering the developments in the countries, the global average of the same is 47.2. The country-wise comparison shows, that Indonesia, India, and Mexico have the highest index scores thus more consumer confidence contributing 63.2, 63.1, and 60.8 respectively.
On the other hand in 2023, Argentina, Hungary, and Turkey scored lowest resulting in 36.6, 35.3, and 34.8.
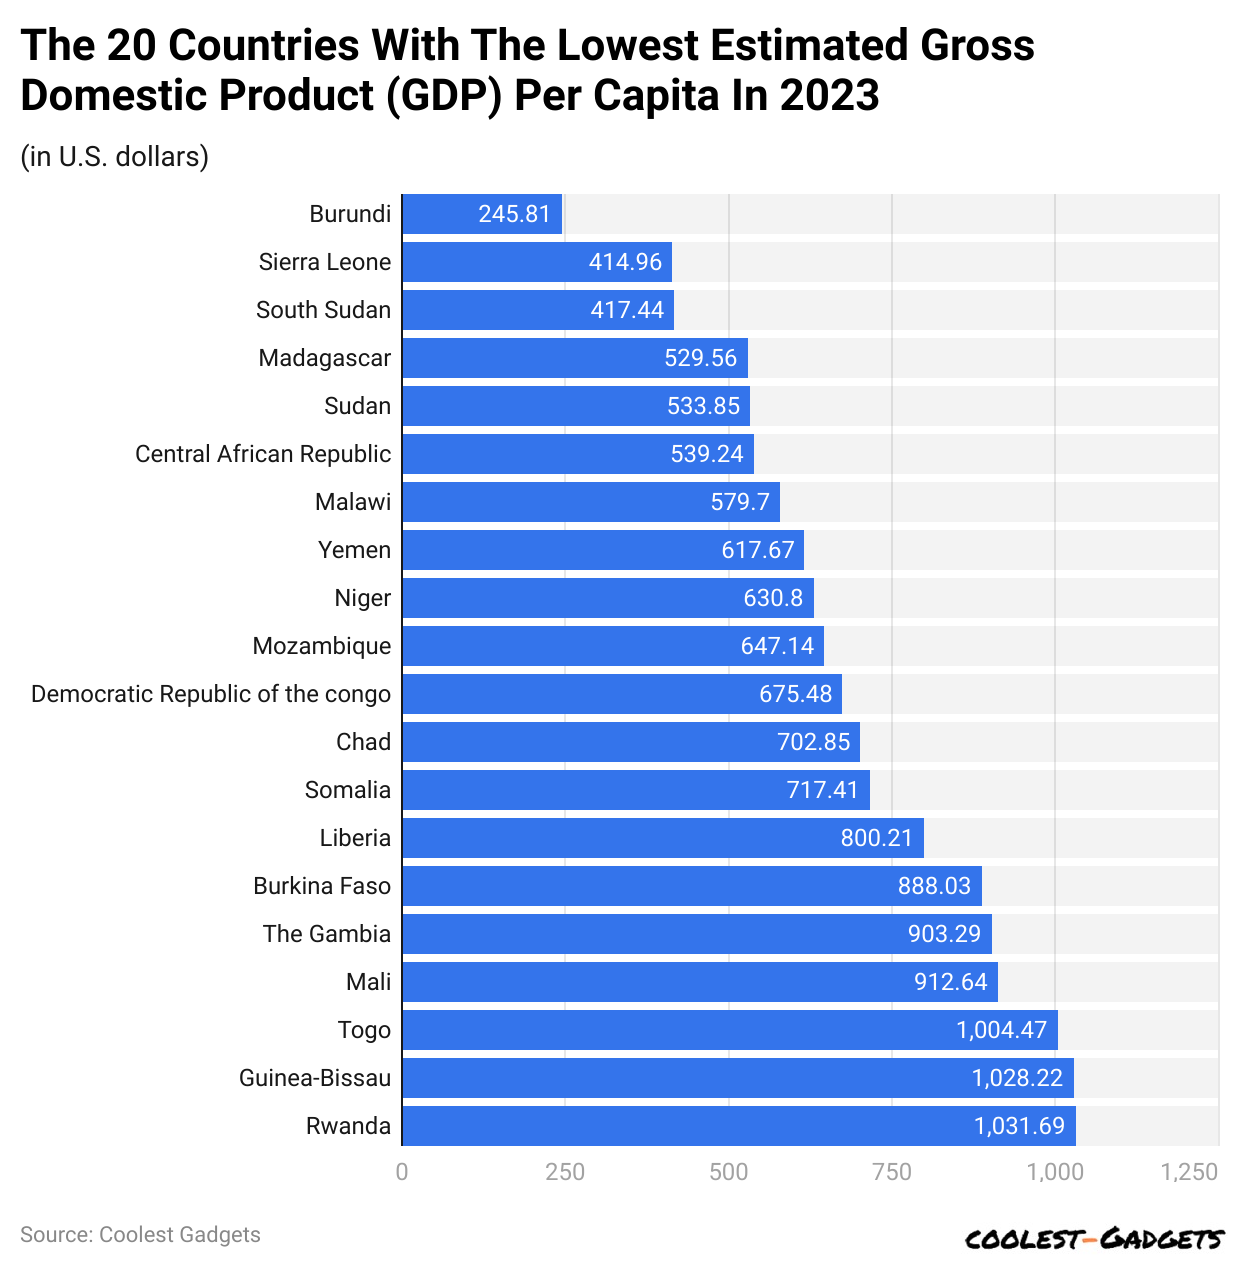
By Top 20 Countries With The Lowest GDP Per Capita
 (Reference: statista.com)
- Globalization Statistics show that as of 2023, Burundi had the est. lowest gross domestic product per capita contributing $245.81.
- Sierra Leone and South Sudan were other top countries with the lowest estimated GDP resulting in $414.96 and $417.44.
- On the other hand, Tago, Guinea-Bissau, and Rwanda contributed comparatively more resulting in $1,004.47, 1,028.22, and 1,031.69.
By Index Field Of Globalization By Sector
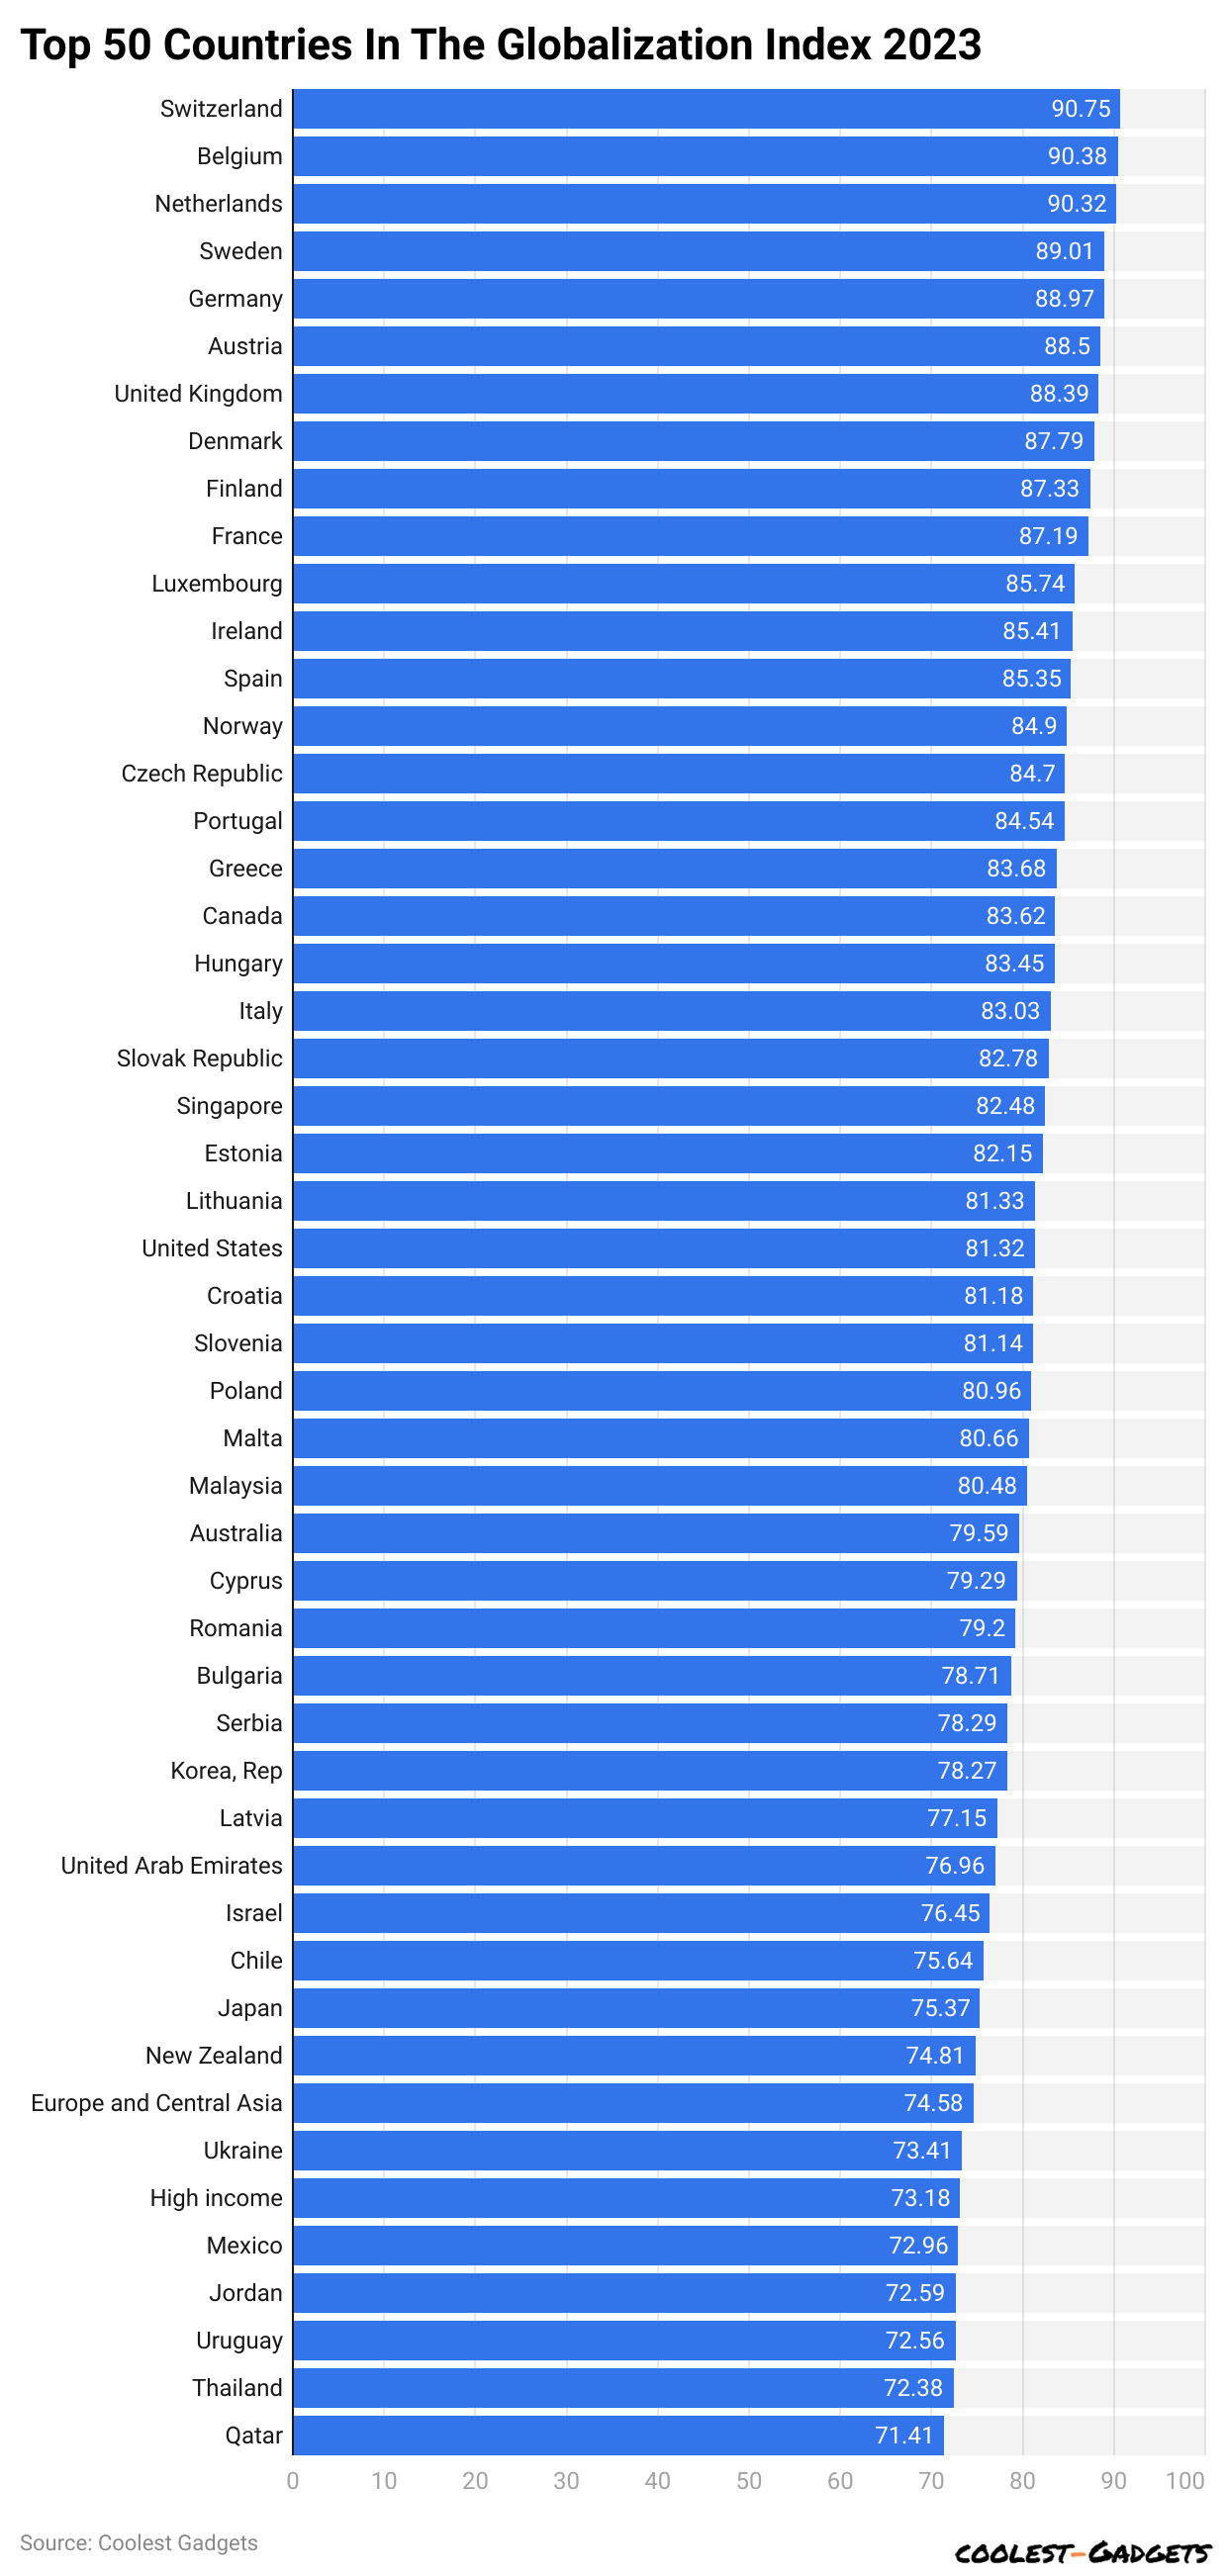
By Top 50 Countries In The Globalization Index In 2023
 (Reference: statista.com)
- Switzerland scored highest with 90.75 on the globalization index in 2023. However, compared to pre-pandemic years, these countries have been able to increase globalization but it still needs to be higher.
- Furthermore, Belgium, Netherlands, Sweden, Germany, Austria, United Kingdom, Denmark, Finland, and France were other top 10 countries in 2023 with comparatively highest globalization index scores.
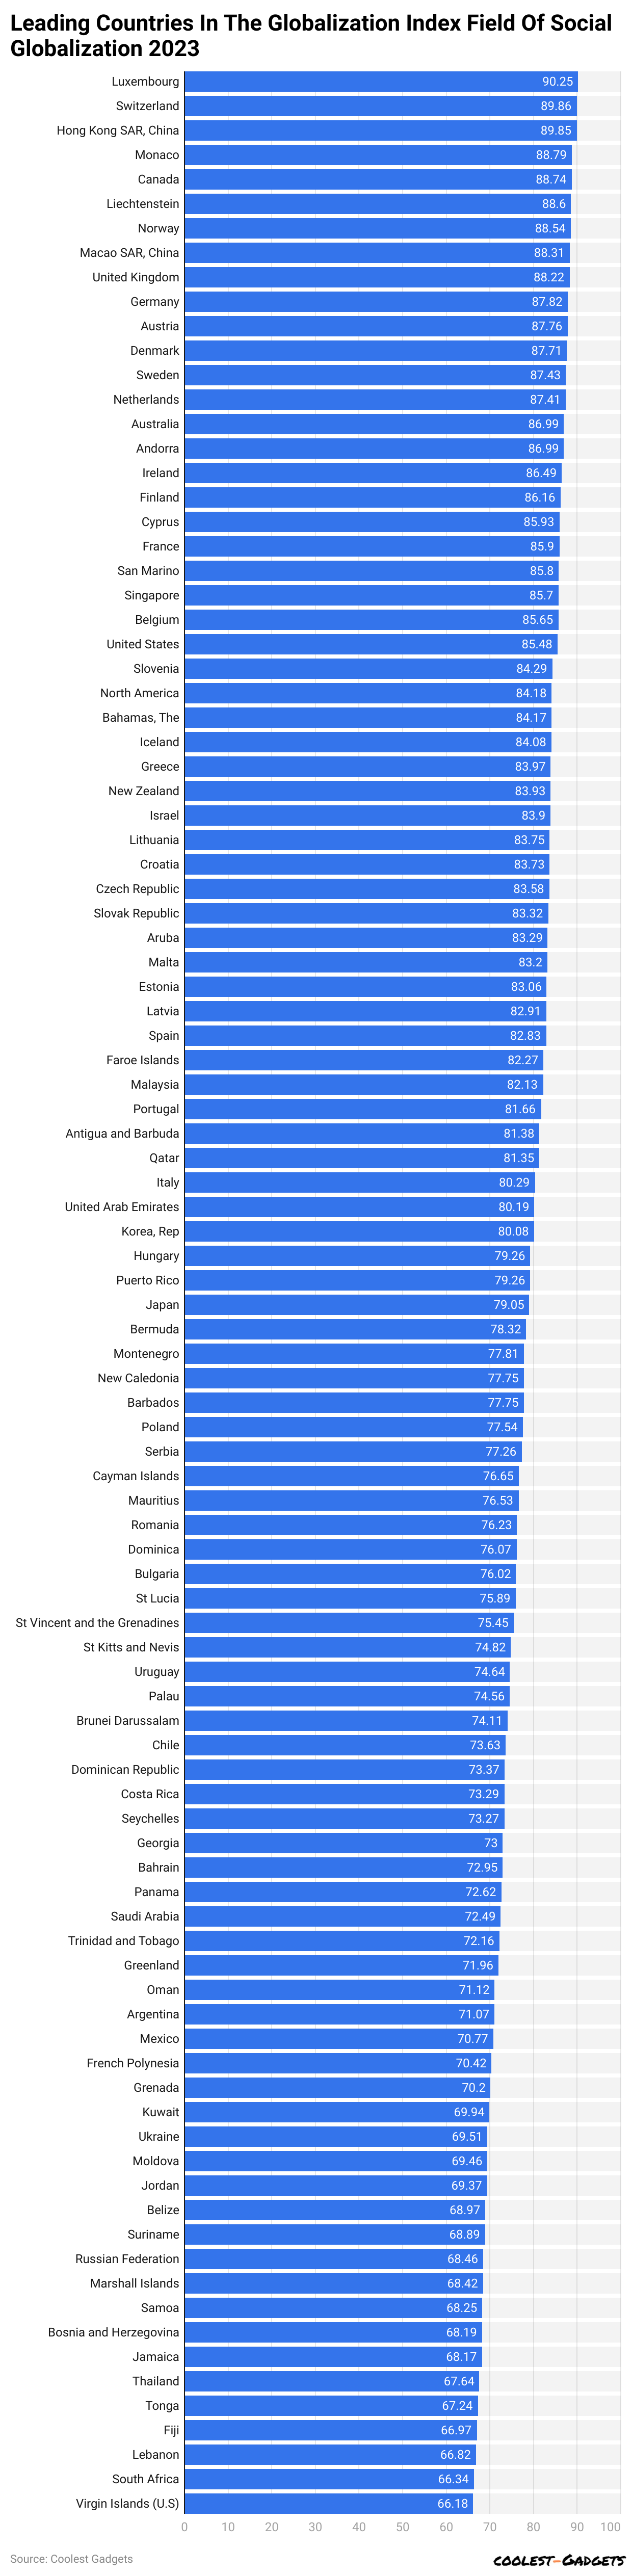
By Social Globalization Index Field
 (Reference: statista.com)
- Luxembourg is the leading country in the globalization index field of social globalization in 2023 with 90.25.
- Switzerland, Hong Kong SAR, China, and Monaco followed behind contributing 89.86, 89.85, and 88.79 respectively.
By Political Globalization
 (Reference: statista.com)
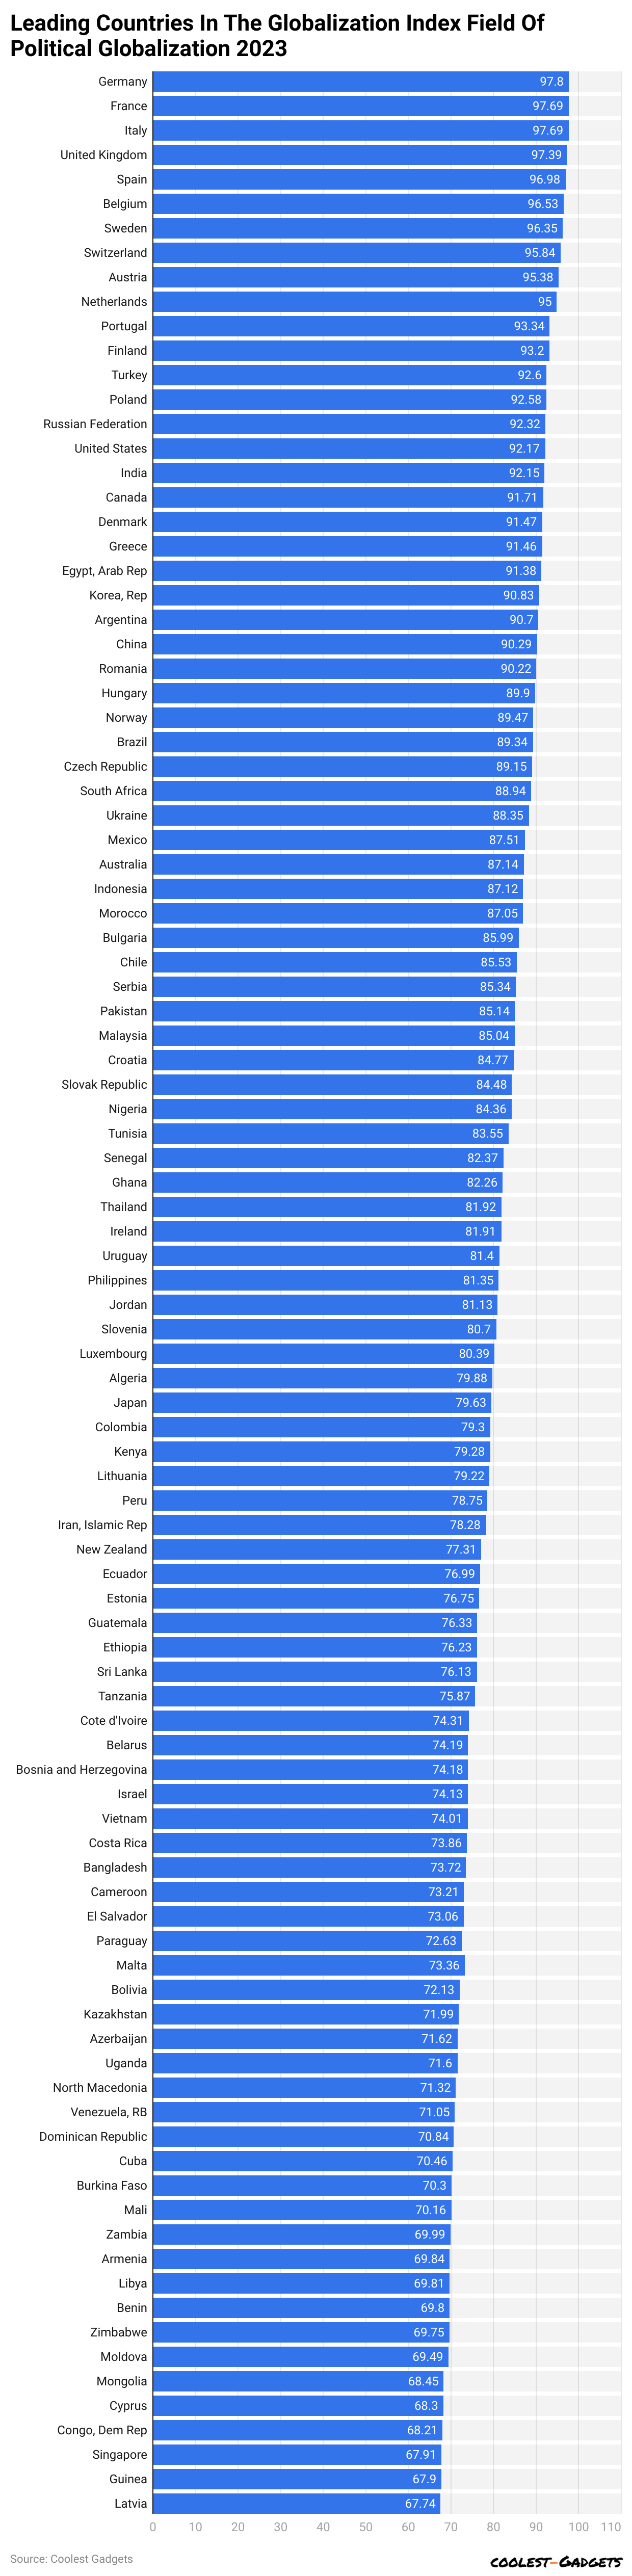
- Furthermore, Globalization Statistics by index field by sector states, that in 2023 in terms of political globalization, Germany contributed the highest with 97.8, followed by France at 97.69 and Italy at 97.69.
- Comparatively, Singapore, Guinea, and Latvia had the lowest index values in points resulting in 67.91, 67.9, and 67.74.
By Economic Globalization
 (Reference: statista.com)
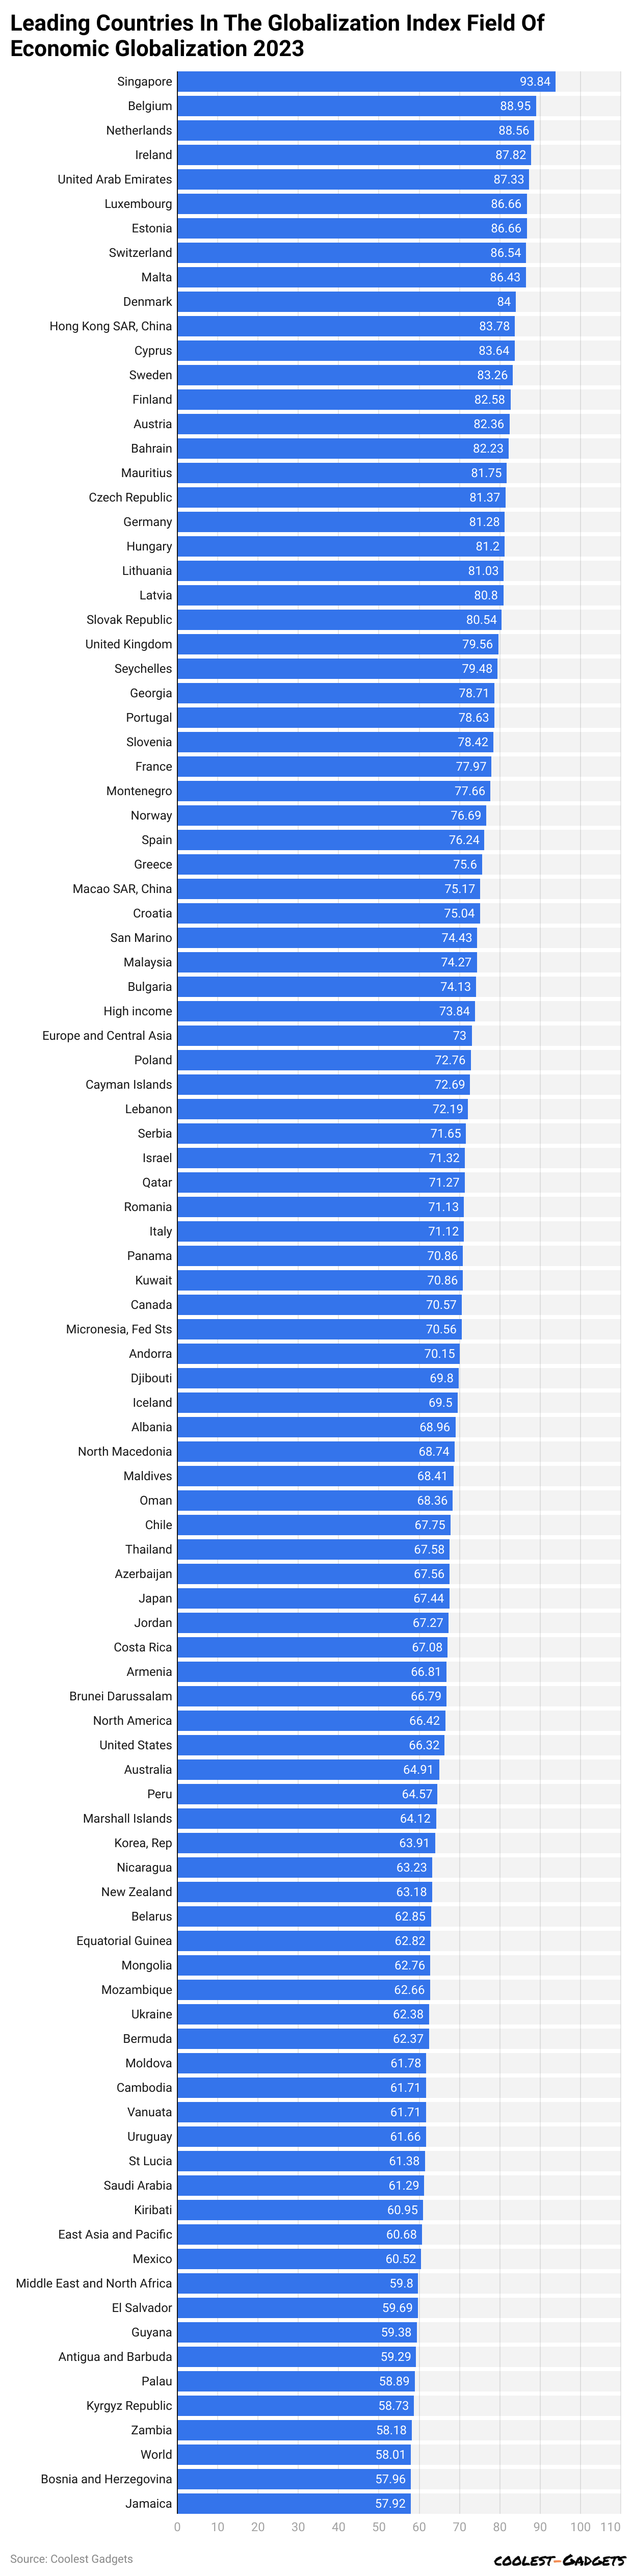
- Similarly, globalization index field of economic globalization in 2023, Singapore scored highest with a 93.84 index value in points.
- Belgium, Netherlands, Ireland, and UAE were comparatively top countries with the highest points.
- On the other hand, Bosnia and Herzegovina and Jamaica had the lowest with 57.96 and 57.92 points respectively.
By Global Corn Production
 (Reference: statista.com)
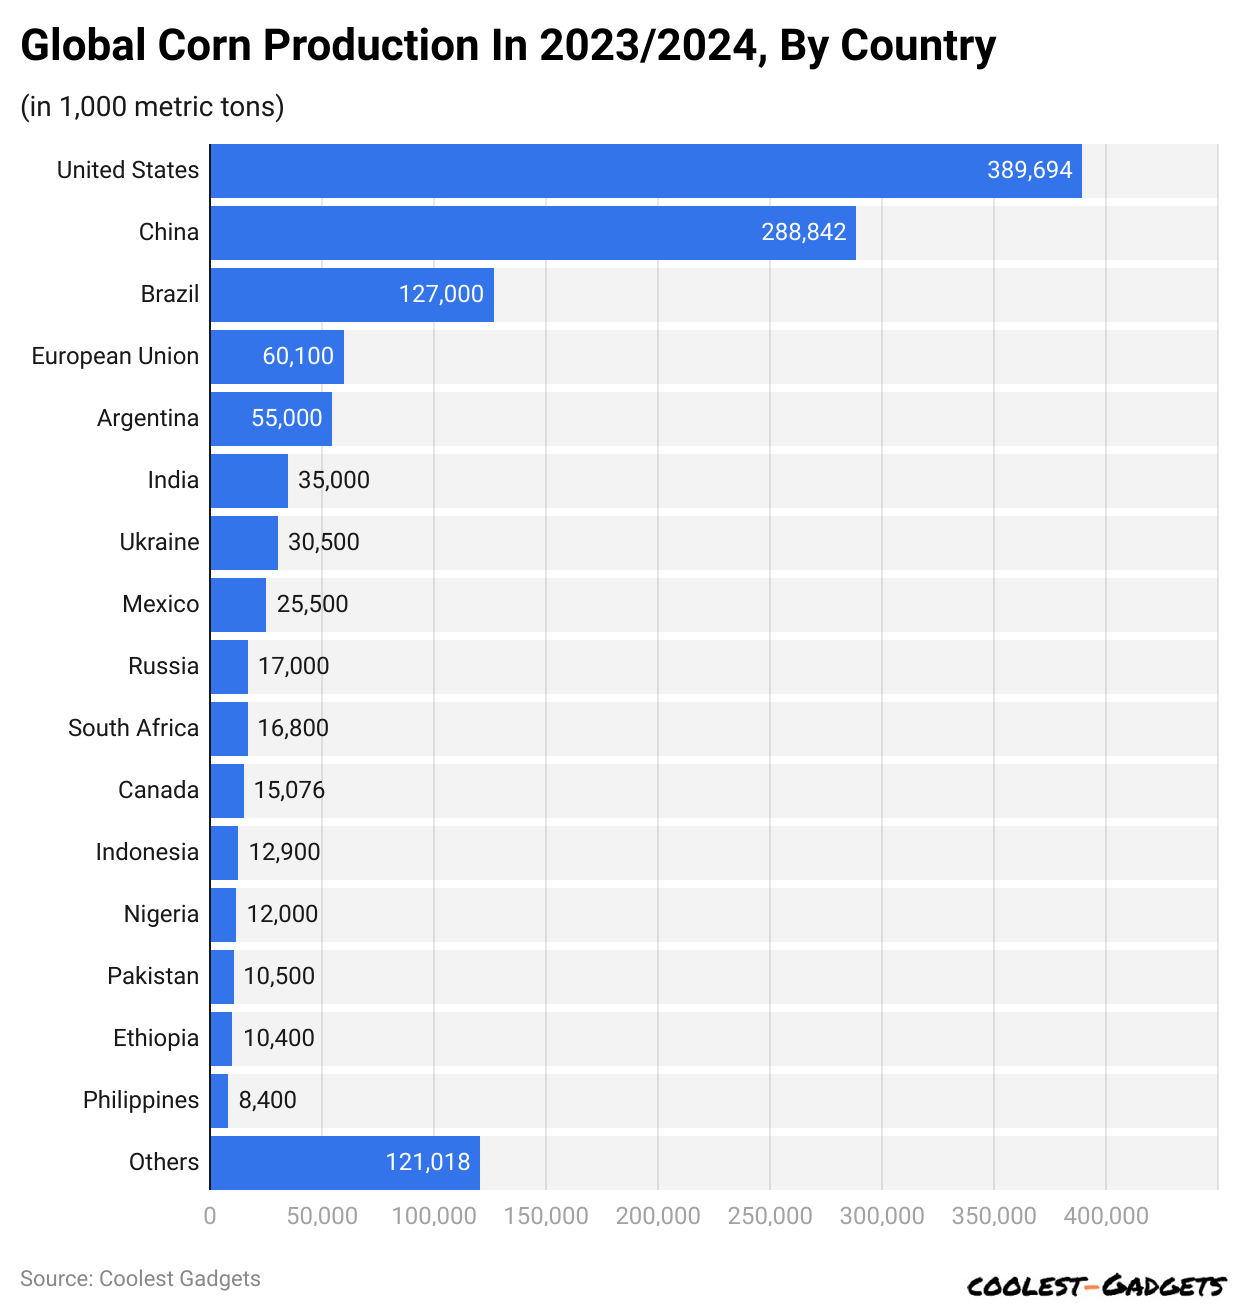
- Between 2023 and 2024, the United States of America is projected to be the largest corn producer in the world contributing 389.7 million metric tons of production.
- China (288,842), Brazil (127,000), the European Union (60,100), and Argentina (55,0000) are followed top 5 countries with the largest projected production.
By The Attitude of People Toward Globalization
 (Reference: statista.com)
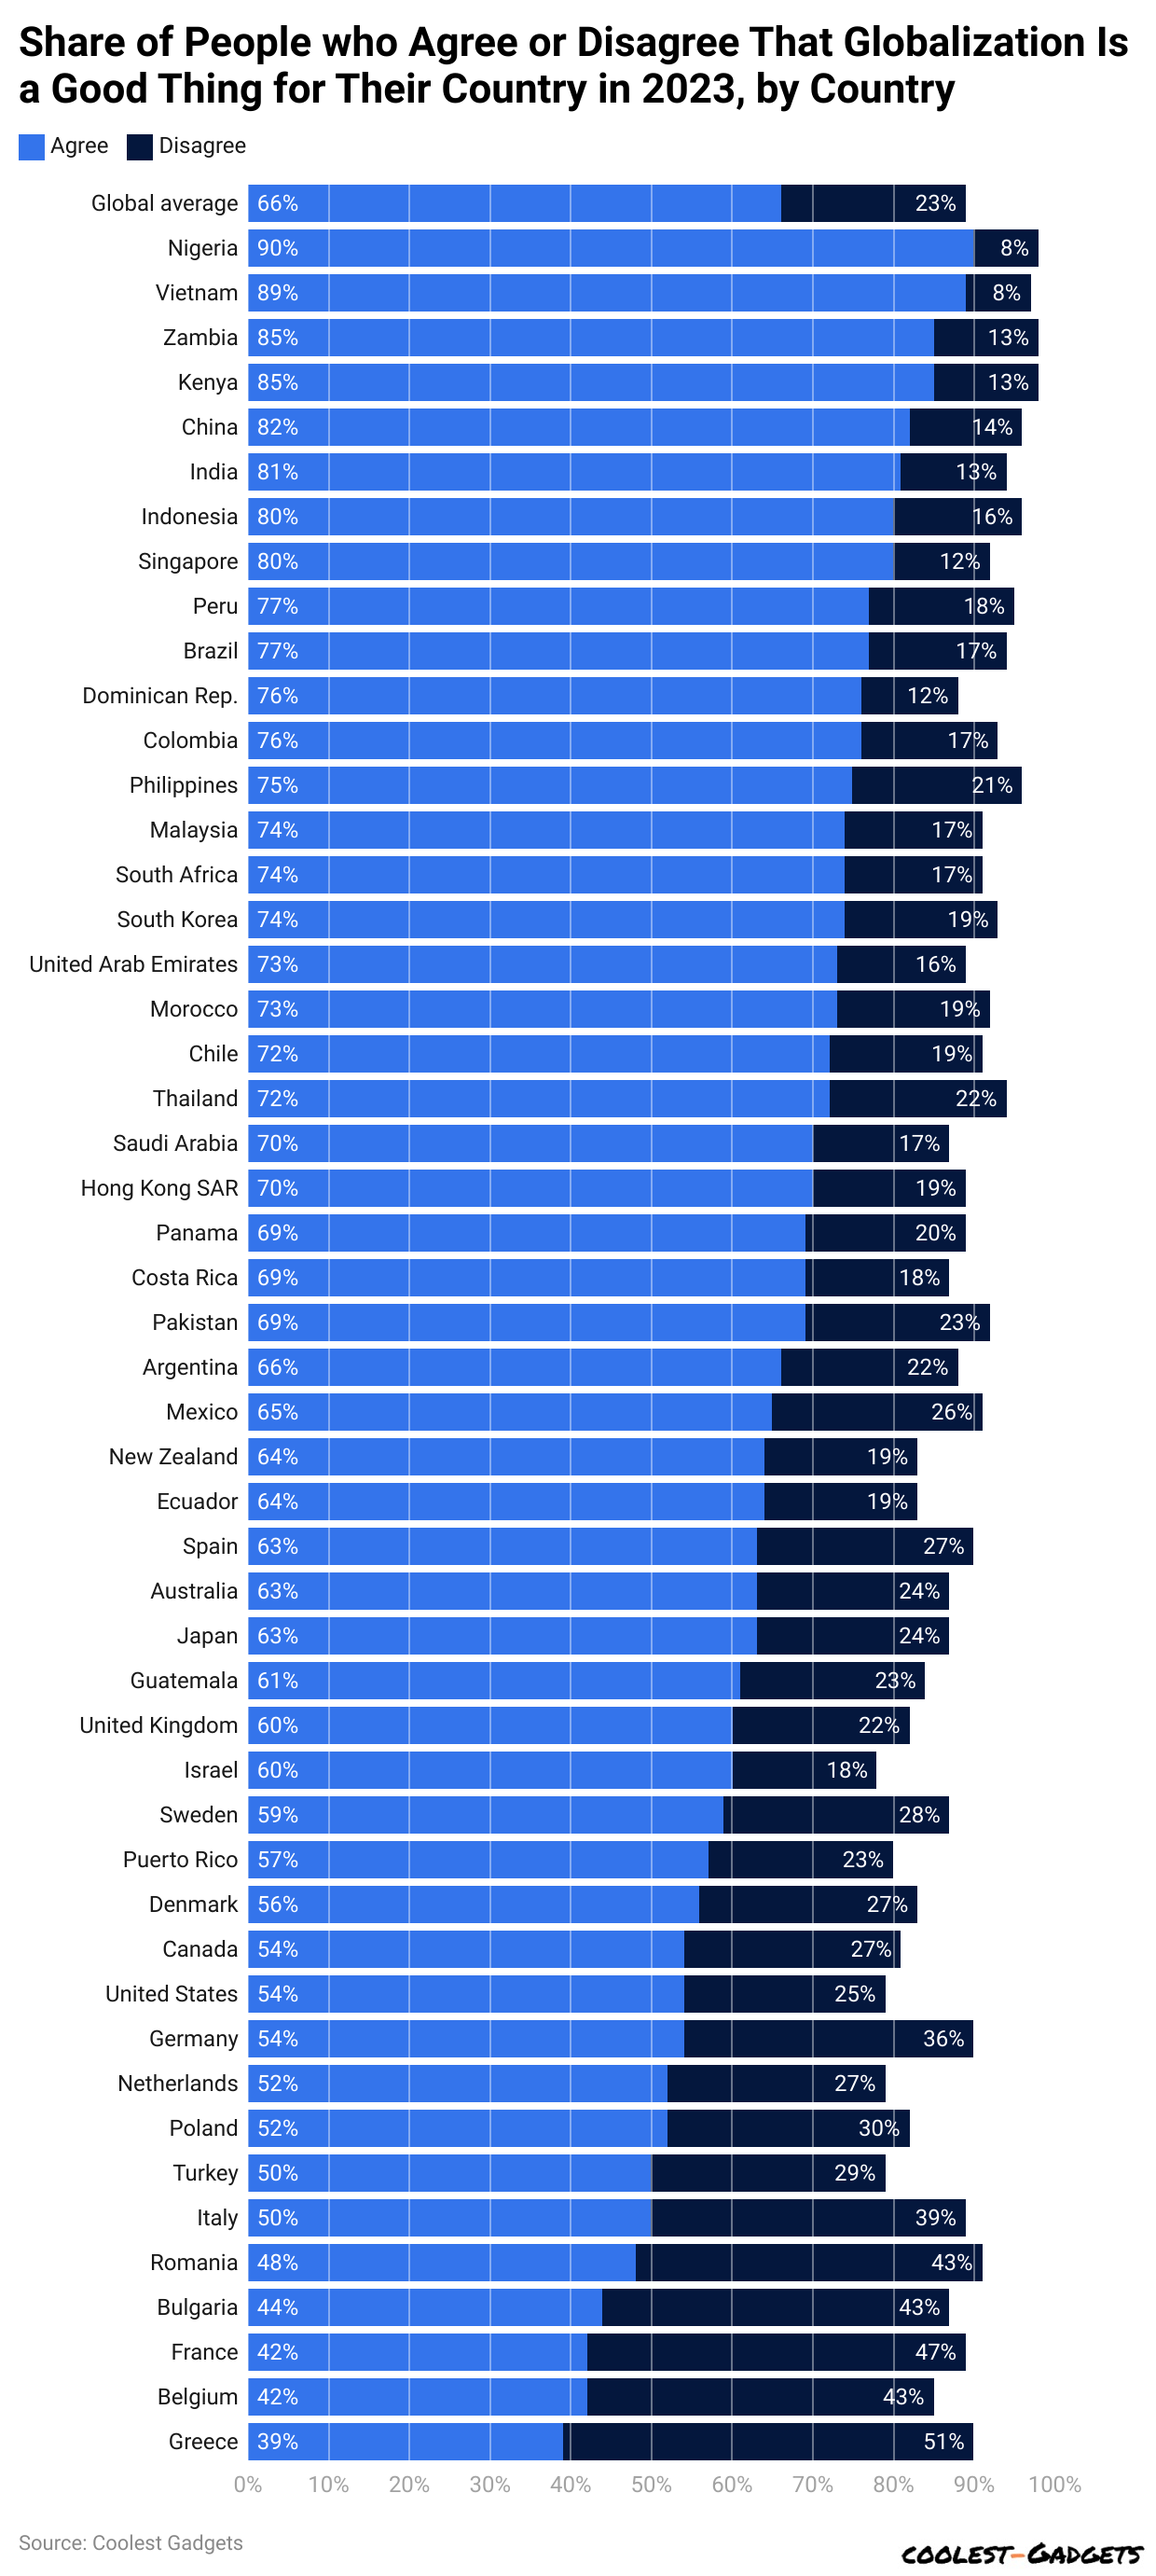
- As per Globalization Statistics, the global average for people who agree that globalization is good for their country is 66%, on the other hand, 23% people disagree.
- Furthermore, Nigeria, Vietnam, Zambia, Kenya, and China are the top 5 countries with the highest number of votes for having a positive attitude toward globalization.
- Greece is the only country with the highest number of people being negative towards globalization.
By Trade Trends In Major Economic Countries
By Goods
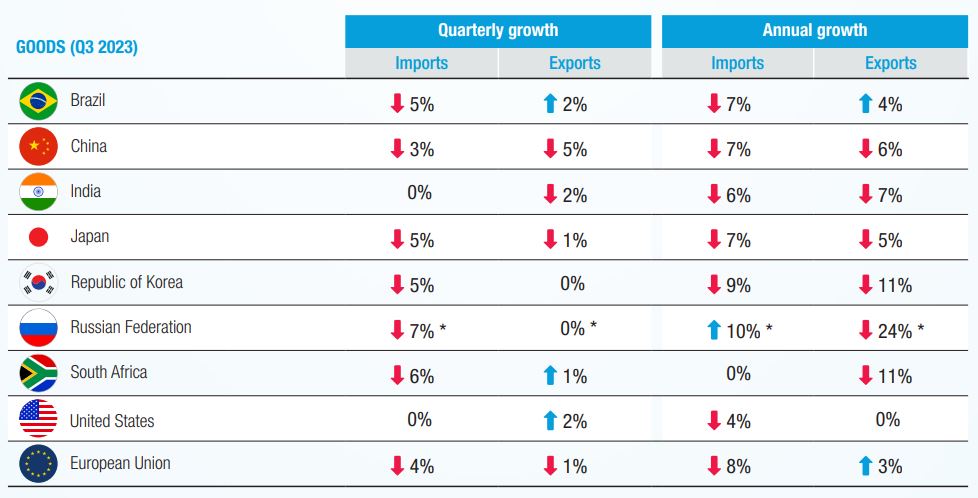
(Reference: unctad.org)
- In Q3 of 2023 merchandise trade in goods, the average quarterly annual growth in the mentioned countries for imports declined.
- Similarly, a few countries experienced an increase in the quarterly growth in exports but a decline in the annual export rate.
- Only Brazil contributed to an increase in exports in both quarterly and annual growth rates.
By Services
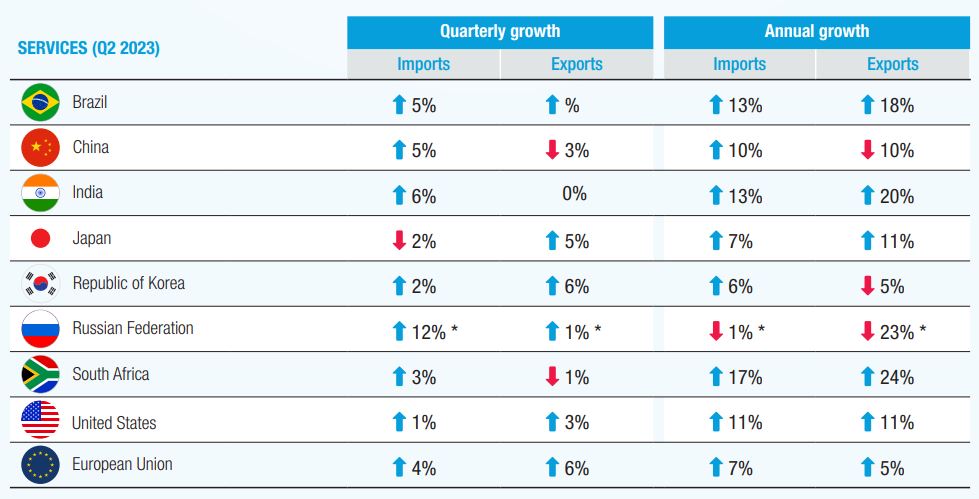
(Reference: unctad.org)
- Furthermore, in Q2 of 2023 in terms of services trade has increased in terms of imports as well as exports in the mentioned countries.
- However, China has seen a 10% annual decrease in exports along with the Russian Federation with -23% (estimated).
- However, quarterly growth for these major countries is lower compared to annual growth in terms of imports and exports.
By Changes In Bilateral Trade Dependences In Q3 Of 2023
Increasing Trade Dependence
| Dependent | Depending on | Annual change |
| Ukraine | European Union | 10.0% |
| Russian Federation | China | 8.0% |
| Kazakhstan | European Union | 2.9% |
| Iraq | China | 2.8% |
| Australia | China | 2.5% |
| Viet Nam | China | 2.3% |
| Saudi Arabia | European Union | 2.2% |
| Taiwan Province of China | European Union | 1.5% |
| Taiwan Province of China | United States | 1.3% |
| United States | European Union | 1.3% |
(Source: unctad.org)
Decreasing Trade Dependence
| Dependent | Depending on | Annual change |
| Russian Federation | European Union | -6.4% |
| Taiwan Province of China | China | -2.2% |
| United States | China | -1.8% |
| Viet Nam | United States | -1.4% |
| Republic of Korea | China | -1.4% |
| Japan | China | -1.2% |
| Türkiye | Russian Federation | -1.2% |
| Chile | China | -1.1% |
| China | United States | -1.0% |
| European Union | Russian Federation | -0.7% |
(Source: unctad.org)
In Q3 of 2023, there has been a 10% increase in the rate for Ukraine depending on the European Union. Furthermore, the Russian Federation has also shown an increase in the dependency rate by 8%. The lowest but increased dependency rates were observed for Taiwan of China with the European Union and USA at 1.5% and 1.3% respectively, and the USA on European Union at 1.3%.
On the other hand, the Russian Federation's dependence on the European Union has shown has decrease in the rate of contributing -6.4%. Furthermore, Taiwan Province of China with China and USA with China registered a -2.2% and -1.8% decrease.
Globalization Statistics By Trade Trends By Sectoral Level In 2023
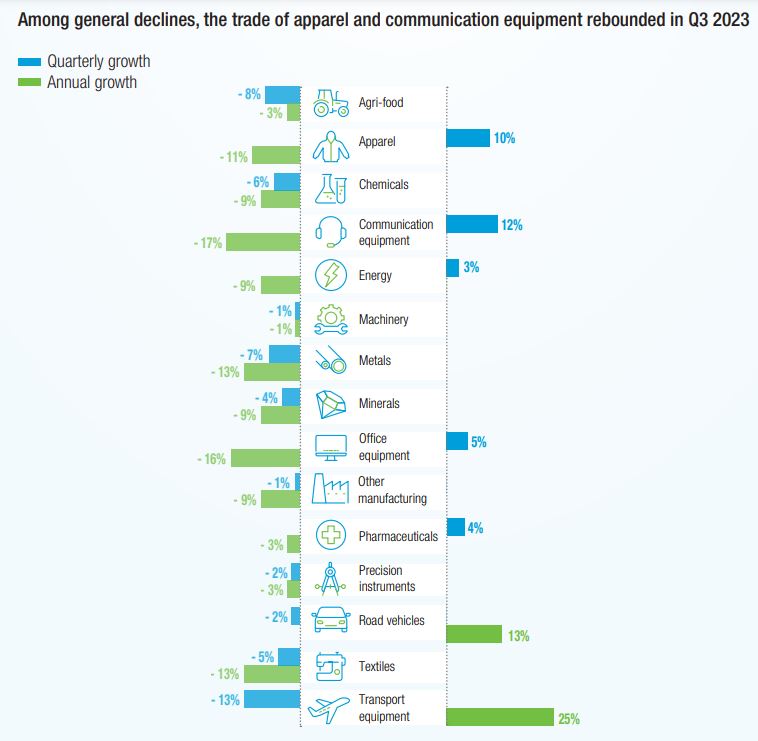
(Source: unctad.org)
- Compared to annual vs quarterly growth, on average each sector is on a steady pace. However, there has been a huge amount of decline in communication and office equipment globally.
- On the other hand, transport equipment has shown 25% annual growth compared to 113% quarterly growth being the highest.
By Leading Rice Exporting Countries
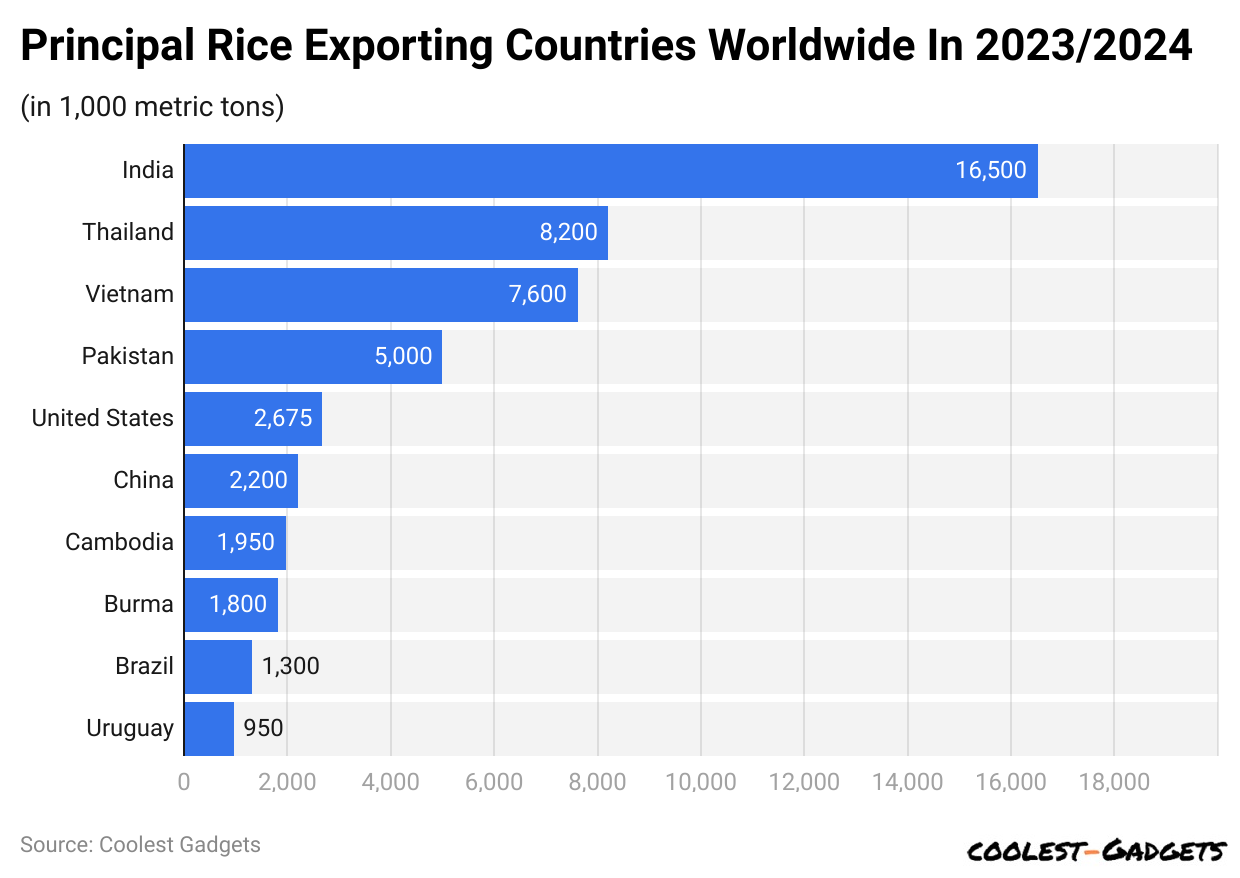 (Reference: statista.com)
- For the years 2023 and 2024, India became the largest exporter of rice resulting in 16,500 million metric tons. Thailand (8,200), Vietnam (7,600), Pakistan (5,000), the USA (2,675), and China (2,200) followed the list.
- Other countries that contributed less than 2,000 million metric tons were Cambodia, Burma, Brazil, and Uruguay.
Top 10 Strongest Export Countries
| Country | GDP | GDP Per Capita | Population |
| China | $18 trillion | $21,476 | 1.41 billion |
| South Korea | $1.67 trillion | $50,070 | 51.6 million |
| United States | $25.5 trillion | $76,399 | 333 million |
| Japan | $4.23 trillion | $45,573 | 125 million |
| India | $3.39 trillion | $8,379 | 1.42 billion |
| Germany | $4.07 trillion | $63,160 | 84.1 million |
| Russia | $2.24 trillion | $36,485 | 144 million |
| Brazil | $1.92 trillion | $17,822 | 215 million |
| France | $2.78 trillion | $55,493 | 67.9 million |
| Mexico | $1.41 trillion | $21,512 | 128 million |
(Reference: usnews.com)
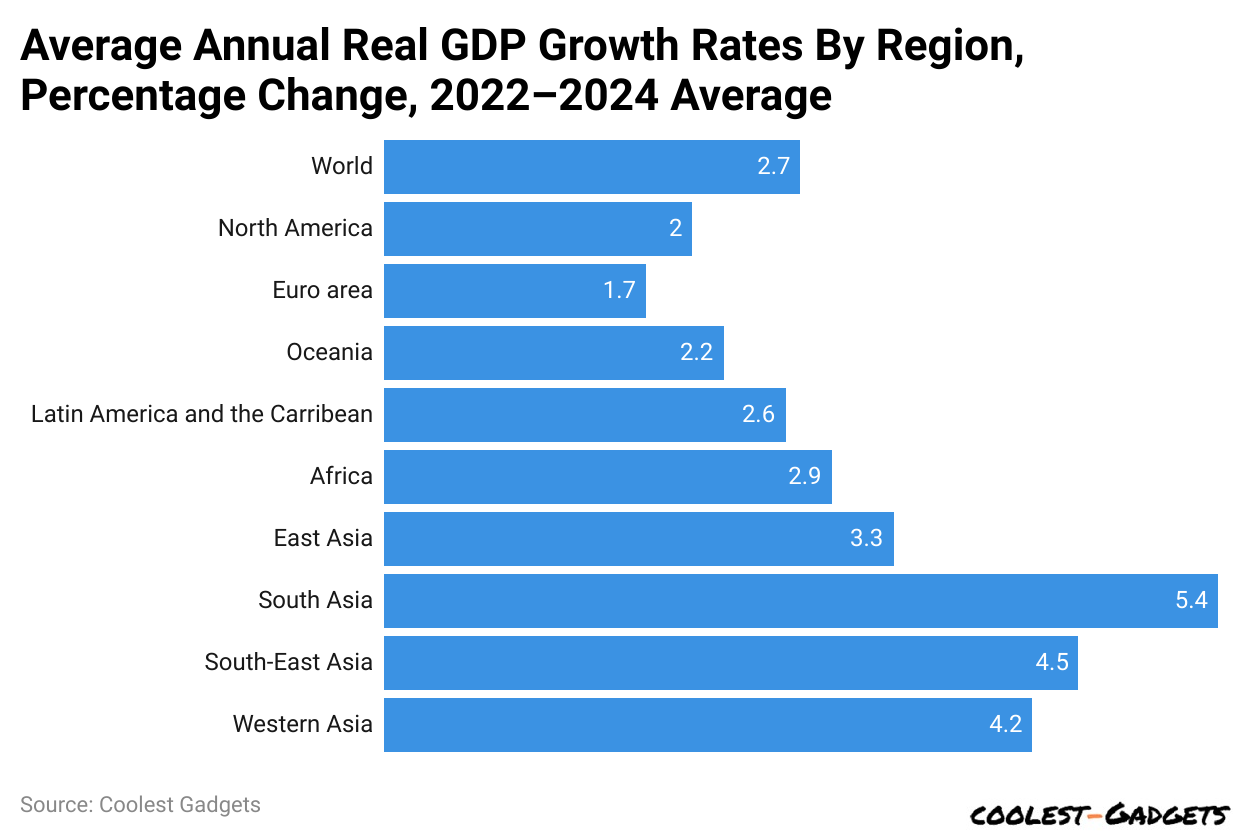
By Annual Average GDP Growth Rates By Region
 (Reference: unctad.org)
- Between 2022 and 2024, the global average of GDP growth rate change worldwide is 2.7%.
- The highest is observed for South Asia (5.4%) Southeast Asia (4.5%), and Western Asia (4.2%).
- On the other hand, the lowest growth rate change is observed for the European region contributing 1.7%.
Globalization Trends Worldwide
Trade and Investment
In 2023, global trade continued its upward trajectory, reaching a staggering $19.25 trillion. This represents a steady growth of 3.8% compared to the previous year. Notably, emerging markets played a significant role, with their share of global trade climbing to $7.6 trillion, marking an increase of 5.2%. Foreign direct investment (FDI) also surged, totaling $1.45 trillion, with the services sector attracting the lion’s share of investment at $620 billion.
Supply Chains and Manufacturing
The globalization of supply chains remained a dominant trend in 2023, as businesses sought to optimize costs and access diverse markets. The total value of global manufacturing output reached $13.8 trillion, with China retaining its position as the world’s manufacturing powerhouse, accounting for $3.5 trillion of this total. However, there’s been a noticeable shift, with Southeast Asian countries such as Vietnam and Indonesia emerging as attractive destinations for manufacturing investments, reflecting a diversification strategy among multinational corporations.
Technology and Innovation
The digital revolution continues to reshape globalization, with technology acting as a catalyst for connectivity and innovation. In 2023, the global digital economy expanded to $7.2 trillion, driven by advancements in artificial intelligence, cloud computing, and e-commerce. Notably, the United States maintained its dominance in the tech sector, with a market value of $2.5 trillion, followed closely by China at $1.8 trillion. Cross-border data flows surged to 80 terabytes per second, highlighting the increasing interconnectedness of the global economy.
Labor and Migration
Globalization has led to unprecedented movements of labor, shaping demographic trends and labor dynamics worldwide. Remittances, a vital source of income for many developing countries, reached a record high of $715 billion in 2023, with India, China, and Mexico being the top recipients. However, the issue of labor exploitation and displacement remains a concern, with an estimated 164 million migrant workers facing precarious employment conditions globally.
Environmental Sustainability
Amidst the benefits of globalization, environmental sustainability has emerged as a pressing challenge. In 2023, global spending on renewable energy reached $366 billion, reflecting a growing emphasis on decarbonization and clean energy transitions. However, this figure falls short of the investment needed to achieve global climate targets. The circular economy gained traction, with investments in recycling and waste management reaching $220 billion, underscoring efforts to mitigate resource depletion and waste generation.
Economic Integration And Regional Blocs
One of the defining features of globalization is the formation of regional economic blocs and trade agreements. In 2023, regional trade agreements covered approximately 60% of global trade, with notable examples including the European Union, the Comprehensive and Progressive Agreement for Trans-Pacific Partnership (CPTPP), and the African Continental Free Trade Area (AfCFTA). These agreements facilitate smoother trade flows, reduce tariffs, and harmonize regulatory standards, thereby fostering economic integration. The value of intra-regional trade within these blocs surpassed $9 trillion, underscoring the significance of regional cooperation in today’s global economy.
Financial Flows And Capital Markets
Globalization has also led to the proliferation of financial flows and the interconnectedness of capital markets. In 2023, total global financial assets reached a staggering $532 trillion, encompassing equities, bonds, derivatives, and other financial instruments. The foreign exchange market, with a daily turnover exceeding $6.6 trillion, remains the largest and most liquid financial market globally. Moreover, cross-border mergers and acquisitions (M&A) activity surged to $3.4 trillion, as companies sought to expand their global footprint and access new markets.
Cultural Exchange And Consumer Behavior
Beyond economics, globalization has profound implications for cultural exchange and consumer behavior. As stated by Globalization Statistics the global media and entertainment industry, valued at $2.2 trillion, continues to transcend national borders, disseminating cultural products and shaping societal norms worldwide. The rise of social media platforms has further accelerated this trend, enabling individuals to connect and share experiences across geographical boundaries. In terms of consumer behavior, there’s been a noticeable shift towards globalized tastes and preferences, with multinational corporations leveraging brand recognition and marketing strategies to appeal to diverse audiences.
Geopolitical Risks And Uncertainties
While globalization offers numerous opportunities, it also entails inherent risks and uncertainties, particularly in the realm of geopolitics. Globalization Statistics shows in 2023, geopolitical tensions and trade disputes between major powers, such as the United States and China, continued to escalate, leading to market volatility and supply chain disruptions. The COVID-19 pandemic further exposed vulnerabilities in global governance and cooperation, highlighting the need for greater resilience and contingency planning. As market researchers, understanding geopolitical dynamics and their potential impact on business operations is essential for mitigating risks and safeguarding against adverse outcomes.
Socioeconomic Inequalities And Development Disparities
Despite the overall benefits of globalization, it has also exacerbated socioeconomic inequalities and development disparities both within and between countries. In 2023, the richest 1% of the global population owned over 43% of the world’s wealth, while the bottom 50% held just 2%. Moreover, income inequality within countries has widened, contributing to social unrest and political instability in some regions. Addressing these disparities requires concerted efforts from policymakers, businesses, and civil society to ensure that the benefits of globalization are shared equitably and sustainably.
Conclusion
The world is still recovering from COVID-19 setbacks in terms of political, trade, technological, etc losses. However, the majority of the countries improved within just 3 years of such a setback. However, the number is still lower as compared to pre-pandemic levels as shown in Globalization Statistics.
However, compared to older times, imports of goods and services have been improved, but developing countries have started producing their goods and services affecting the average imports.
Sources
Pramod Pawar brings over a decade of SEO expertise to his role as the co-founder of 11Press and Prudour Market Research firm. A B.E. IT graduate from Shivaji University, Pramod has honed his skills in analyzing and writing about statistics pertinent to technology and science. His deep understanding of digital strategies enhances the impactful insights he provides through his work. Outside of his professional endeavors, Pramod enjoys playing cricket and delving into books across various genres, enriching his knowledge and staying inspired. His diverse experiences and interests fuel his innovative approach to statistical research and content creation.