Reusable Water Bottle Statistics By Usage and Revenue

Updated · Jan 02, 2025


TABLE OF CONTENTS
- Introduction
- Editor’s Choice
- Water Bottle Environmental Pollution Statistics
- Fascinating Reusable Water Bottle Statistics
- Reusable Water Bottles Market Size
- Regional Insights of Reusable Water Bottles
- Water Bottle Statistics
- Water Bottle Waste Statistics
- Water Bottle Trust Statistics
- Plastic Bottle Waste Statistics
- Reusable Water Bottle Purchases Statistics
- Recent Developments in Reusable Water Bottles
- Conclusion
Introduction
Reusable Water Bottle Statistics: Reusable water bottles have emerged as a vital tool in combating environmental degradation, offering a sustainable alternative to single-use plastics. Each day, approximately 1.3 billion plastic bottles are utilized worldwide, amounting to around 1 million bottles every minute. Given this staggering consumption, reusable water bottles play a crucial role in reducing the demand for plastic, lowering plastic waste, and minimizing the environmental footprint of our hydration habits.
In an effort to explore the impact of plastic water bottles on the environment more thoroughly, we’ve compiled data from various sources and conducted a comprehensive survey involving 2,143 U.S. adults to gauge their perspectives on bottled water usage and trust. This approach helps illuminate the broader environmental implications and consumer attitudes toward bottled water.
Editor’s Choice
- The Global Reusable Water Bottles Market is projected to reach a value of approximately USD 15.5 billion by 2033, expanding at a compound annual growth rate (CAGR) of 4.8%.
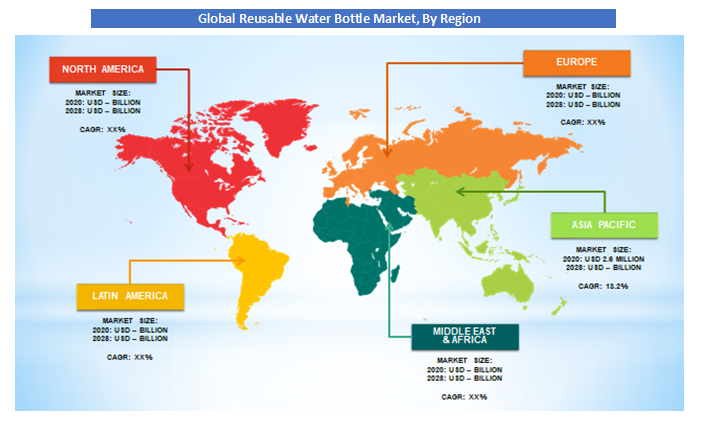
- In 2023, the Asia Pacific region held the largest market share, accounting for 40.6% of the global market, translating to revenues of USD 3.9 billion.
- Annually, using reusable water bottles can prevent the use of 156 single-use plastic bottles per individual, which reduces plastic waste by over 1.5 kg per person.
- Only about 11.8% of plastic beverage bottles are recycled, highlighting the environmental benefit of switching to reusable bottles.
- Stainless steel is the material of choice for 40% of consumers purchasing reusable water bottles due to its durability and ability to regulate temperature.
- Consumers can save an average of USD 308.88 each year by using reusable water bottles instead of buying bottled water.
- Using a reusable water bottle to consume eight glasses of water daily can lead to a reduction of 245 grams of plastic waste per year, which amounts to 89,525 grams of plastic saved annually.
- The market for mobile water purifiers for reusable bottles is expected to surpass USD 190 million by 2025.
- In the United States, approximately 38 billion plastic water bottles are discarded annually, resulting in nearly USD 1 billion in plastic waste.
- Around 60% of U.S. households use water filters, which supports the preference for using reusable water bottles.
- The average American possesses approximately 7.24 reusable water bottles.
- Approximately 53% of U.S. residents own reusable water bottles that are BPA-free.
- Switching from bottled to tap water can save an individual up to USD 1460 per year, based on an average consumption of 167 bottled waters annually.
- A reusable water bottle can be refilled 800 times, significantly offsetting the cost of disposable plastic bottles.
- In the Reusable Water Bottles Market, plastic maintained a dominant position in the material type segment with a 37.3% share in 2023.
- Supermarkets and hypermarkets dominated the distribution channel segment with a 39.3% market share in 2023.
You May Also Like To Read
- Endangered Species Statistics
- Food Waste Statistics
- Globalization Statistics
- Climate Change Statistics
- Statistics About Flooding And Water Damage in The USA
- Electric Vehicle Statistics
- Gun Violence Statistics
Water Bottle Environmental Pollution Statistics
- The people of the United States throw away almost 60 million plastic bottles of water each day.
- Plastic water bottles require nearly 450 years to break down.
- The majority of plastic water bottles consumers purchase end up being thrown away in the garbage dumps.
- It takes nearly three times the water space to make just a single bottle of water, compared to the time it takes to fill it up.
- In a recent study, a researcher found that about 15% of the population consumes water in bottles, as opposed to 12% of those who consume tap-filtered water.
- Bottled water can cost the median price of $1.11 per gallon. In contrast, tap water is lower than 50 percent of a penny for a gallon.
- The average drinking of water bottles within the United States has grown by approximately 40% and now stands at 44 gallons for each person.
- Every year, to supply the need for water bottles over 17 million barrels worth of crude oil is consumed that can provide fuel for more than a million automobiles each year across the United States.
- 244,000 tons of plastic are floating around in oceans.
Nearly 23% of the plastic bottles that are thrown away are recycled each year. - In 2050, the oceans of the globe are expected to be filled with more plastic than marine species.
- Nearly 2 million tons of used water bottles are disposed of all over America. United States.
- The average American would prefer 167 bottles every year, however only 38 of them are recycled.
- It is recommended that people consume 8 glasses of water per day. The cost of water from the tap is almost $0.49 annually, but it is $1,400 when you buy bottles.
- Based on statistics about reusable plastic water bottles, microplastics can be present in over 90% of samples taken from 259 bottles across the globe. If one bottle was examined, its level would be up to 10,000 plastic particles per liter of water.
Fascinating Reusable Water Bottle Statistics
- Almost 60 million plastic bottles are disposed of in the United States each day, but just around 23% of disposable bottles are sent to recycling.
- As per a survey done in 2024, 60% of adults, that is 155 million people in the United States, own a reusable water bottle.
- About 103 million adults in the United States do not own a reusable water bottle.
- In 2022, the worldwide reusable water bottle market was valued at $8.92 billion.
- The Canadian government has begun to implement disposable bottle bans.
- The reusable water bottle market is predicted to expand at a 4.3% CAGR between 2022 and 2030.
- By 2030, the market of reusable water bottles is projected to be $12.61 billion.
- Customers buy plastic reusable water bottles very regularly, accounting for 35.8% of the total sales.
- 40% of the owners choose reusable water bottles made from stainless steel, 27% of owners choose plastic water bottles, and 20% of owners prefer glass water bottles.
- The customer thinks that stainless steel bottles have very few health concerns and are also, like the truth, better at regulating the temperature of their liquids.
- In 2021, the Asia Pacific region influenced the global reusable water bottle market with a revenue share of more than 39%.
- With 27.5%, the North American market ranked second and is projected to grow in both its total value and proportion of the global market share.
- The authorities in the United States plan to ban single-use plastic bottles nationwide by 2030.
- Over the forecasted period of 2022-2032, the online channels and specialty stores for reusable water bottles will experience the fastest growth at a 4.2% CAGR.
- By 2030, online sales will grow their share in the market for almost the remainder of the decade and are projected to account for 25% of the total sales.
- According to a study, almost 50 billion plastic water bottles are sold in the United States annually. That means almost 13 bottles each month for each person in America.
- If the United States population shifts to reusable bottles, it can save almost 156 plastic bottles per person yearly.
- According to a study in 2024, the median 0.5-litre plastic water bottle contains almost 9.9 grams of plastic.
- According to a survey, 156 plastic bottles are used annually. If every person buys a reusable water bottle, it will save almost 1.5 kg of plastic from being produced.
- As per the projection, 77% of disposable plastic water bottles are not recycled.
- The median cost of a plastic water bottle is currently $1.98 in the United States.
- It is assumed that customers buy almost 156 discarded plastic bottles per year. Switching to a reusable bottle can save almost $308.88 yearly.
- Plastic bottled water requires 16 million barrels of oil and contributes almost 2.5 million tons of CO2 pollution each year.
- In terms of manufacturing energy consumption, one stainless steel water bottle equals almost 50 plastic bottles.
- A person’s carbon dioxide savings by switching to reusable water bottles will be enough to fill almost 2,580 gallons each year.
Reusable Water Bottles Market Size
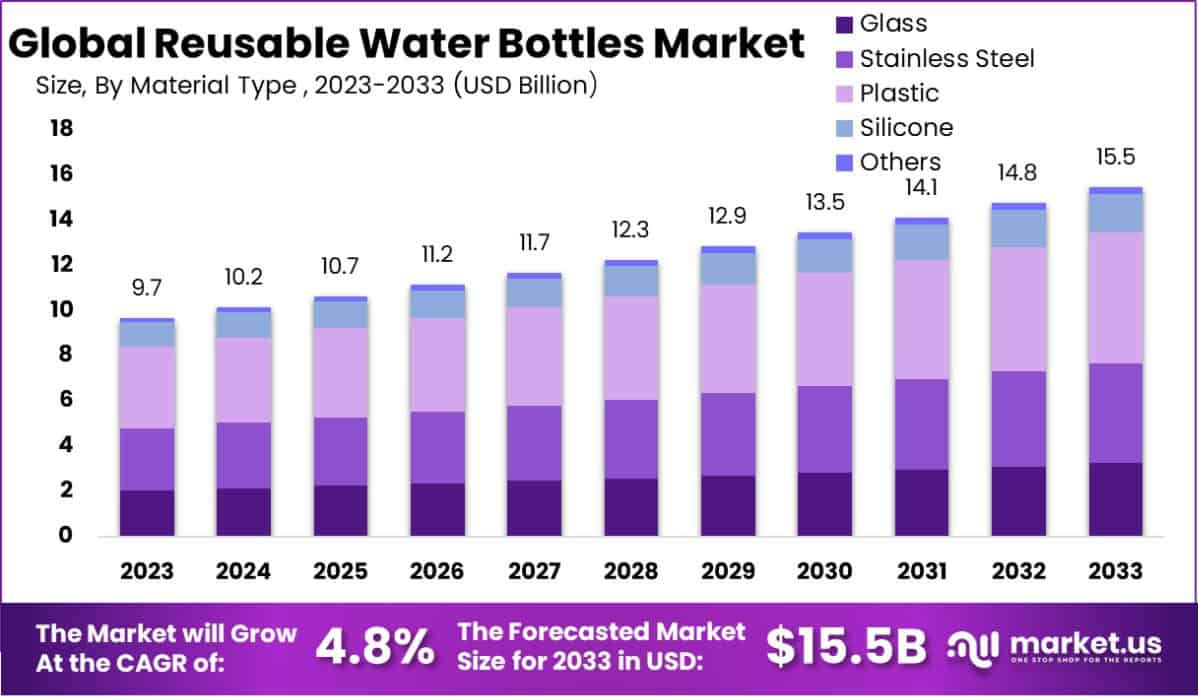
- Market Growth: The reusable water bottles market is projected to grow from USD 9.7 billion in 2023 to USD 15.5 billion by 2033, achieving a compound annual growth rate (CAGR) of 4.8% over the forecast period from 2024 to 2033.
- Regional Dominance: In 2023, the Asia Pacific region held a dominant position in the market, commanding a 40.6% market share with revenues amounting to USD 3.9 billion.
- Material Type Dominance: Plastic was the leading material type within the Reusable Water Bottles Market in 2023, securing a 37.3% market share.
- Distribution Channel Dominance: Supermarkets & hypermarkets were the primary distribution channel for reusable water bottles in 2023, holding a 39.3% market share.
- Governmental Initiatives: Significant investments in sustainability initiatives such as the Swachh Bharat Mission (SBM-G) in India, with a budget of approximately USD 870 million, and the Jal Jeevan Mission (JJM) with a budget of around USD 8.5 billion, both emphasize improving sanitation and water distribution systems respectively, indirectly boosting the market for reusable water bottles.
- Local Initiatives: Strategic municipal initiatives like “Milano Plastic Free,” which distributed 100,000 reusable bottles in Milano, Italy, play a critical role in reducing single-use plastic consumption and promoting sustainable consumer behaviors. Similar educational campaigns in Florence and the Amalfi Coast distribute reusable Tritan water bottles in schools, further highlighting the commitment to environmentally friendly practices.
Regional Insights of Reusable Water Bottles
- In 2023, the Asia-Pacific influenced reusable water bottles with a revenue of 39.8%.
- Japan is strongly focused on inventions, which can result in developments in reusable water bottle materials, functions, and designs.
(Source: zionmarketresearch.com)
- In the Asia-Pacific region, India’s reusable water bottle market is the fastest growing, as it has many bottle manufacturers, low costs, and a wide range of products available.
- Customers in Japan prioritize high-quality products and are creating a chance for premium reusable water bottles with more features.
- The Chinese government has banned single-use plastic and established drinking water fountains everywhere. This is predicted to drive the growth of the reusable water bottle market in China.
- The reusable water bottle market in Australia is estimated to grow at a 5% CAGR in the projected period.
- Japan’s culture of convenience and hygiene can drive the adoption of reusable water bottles in the future.
- Over the forecasted period of 2023 – 2030, North America is expected to have the highest CAGR, which is 4.5%.
- In the United States, the reusable water bottles market is estimated to grow at a 4% CAGR in the forecasted period, driven by customers’ changing preferences for saving the environment.
- By 2034, the reusable water bottle market in Japan is predicted to rise at a 2.6% CAGR.
- Japan’s concentration on waste management ranges well with the sustainable advantages of reusable water bottles.
- India has witnessed growth in environmental concerns, government initiatives, and increased health awareness.
Water Bottle Statistics
- In America, bottled water had the first number of packed beverages in 2019.
- Nearly 22% of the tested water bottle brands have a chemical contaminant at some level over severe state health limitations.
- The environmental footprint of sealed bottled water is almost 1,000 times higher than that of tap water.
- By 2024, the bottled water industry is predicted to value almost $350 billion.
- The production of bottles for US utilization alone needs almost 1.5 million barrels of oil yearly, enough to fuel some 100,000 cars for the year in the United States.
- As per the study, females are more likely to use bottles of drinking water than males, with almost 67% of females and 63% of males, respectively.
- Nearly 1 out of 5 bottled waters hold chemicals above the limits of health.
- Plastic water bottles are between 500 and 1,000 times more overpriced than tap water.
- A reusable water bottle pays for itself after the 5th refill, in contrast to buying a disposal water bottle.
- By 2024, the worldwide industry for reusable water bottles will be valued at $10.19 billion.
- Virtually 90% of the cost of a bottle of water is due to the packaging, not the quality of the water.
- The minimum consumption of people in the US is almost 43.7 gallons of bottled water, which makes it the most consumed-packed beverage.
- In 2020, Nestle’s Pure Life was a very famous bottled still water brand in America, with sales that reached around 919 million US dollars.
- Nearly 17 million barrels of oil are used to produce plastic water bottles yearly.
- The production of plastic water bottles needs almost 2,000 times more energy than for producing tap water.
- The wholesale value of the United States plastic bottled water market was almost 18.5 billion.
- In the United States, the consumption of bottled water was almost 14,4 billion gallons.
- The median American uses almost 167 disposal water bottles, but only 38 are recycled.
Water Bottle Waste Statistics
- Just 9% of all the plastic waste that is produced overall is successfully recycled.
- Almost 480 billion plastic bottles were sold globally in 2020.
- If it is collected, plastic wasted water bottles can be recycled into 1.1 billion pounds of new PET products.
- It takes almost 22 gallons of water to produce one pound of plastic, which can generate almost 50 water bottles.
- Almost $ 11.4 billion worth of plastic materials is disposed of every year, including water bottles.
- It takes almost 1,000 years for the decomposition of plastic water bottles.
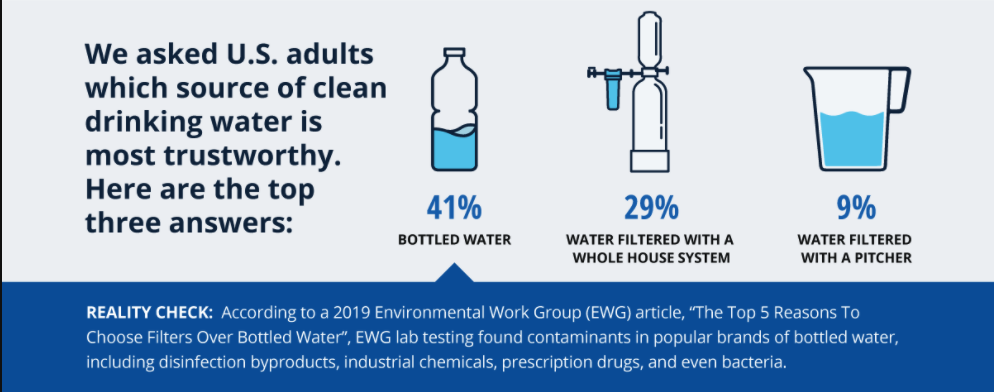
Water Bottle Trust Statistics
Here are the statistics regarding trust in bottled water based on a 2021 survey of 2,143 individuals:
- Trust by Age: Among different age groups, 53% of Gen Z respondents trust bottled water the most, compared to 36% of Gen X, 32% of Baby Boomers, and 30% of Millennials.
- Trust by Gender: Both women and men trust bottled water equally, with 39% from each gender identifying it as the most trustworthy source.
- Trust by Region: Trust in bottled water is highest in the Northeast U.S., with 43% considering it the most reliable. This is followed by the South at 41%, and both the West and Midwest at 36%.
- Trust by Urban/Suburban/Rural Classification: Rural areas show the highest trust in bottled water at 42%, urban areas at 39%, and suburban areas at 38%.
- Trust by Income: Respondents with a household income of USD 50,000 – USD 99,000 show the greatest trust in bottled water at 46%. Both lower income groups (less than USD 49,999) and higher income groups (more than USD 100,000) trust bottled water at a rate of 41%.
- Trust by Marital Status: Single individuals trust bottled water more than married individuals, at 43% compared to 35%.
- Trust by Parental Status: Non-parents trust bottled water more than parents, at 41% compared to 36%.
(Source: Aquasana)
Plastic Bottle Waste Statistics
- According to Officeh2o.com, nearly 2.5 million tons of CO2 are generated from the manufacturing process and filling of plastic bottles each year.
- Worldwide, around 1 million plastic bottles are bought each minute, as per the United Nations Environment Programme.
- According to National Geographic, for each six plastic bottles of water that are bought, just one is recycled.
- Virtually 2.5 million tons of CO2 are generated from the process of manufacturing and filling plastic bottles each year.
- According to statistics on reusable water bottles, the median Brit can save 94.4 kg of CO2 every year by transferring it to reusable bottles.
- A median Brit can save almost 94.4kg of CO2 every year by transferring to reusable bottles, which is equal to spending 8,929 hours streaming films and TV.
- In the United Kingdom, almost 16 million plastic bottles are not being recycled every year.
- Roughly 80% of plastic water bottles end up in landfills globally, as per the Huffington Post.
- According to PlasticExpert.co.uk, almost 8 million tonnes of plastic bottles are discarded in the ocean each year.
- The plastic bottles require almost 450 years to decompose fully.
- According to National Geographic, for each of the six plastic bottles purchased, just one is sent for recycling.
- In the United Kingdom, almost 16 million plastic bottles are not being recycled every year.
- Nearly 80% of plastic water bottles end up in landfills globally.
Reusable Water Bottle Purchases Statistics
- Over half (55%) of Americans purchased a reusable water bottle in the past year, motivated by environmental sustainability.
- The survey highlighted that age is the most significant factor influencing the likelihood of purchasing a reusable water bottle, with Gen Z leading the way.
- Other factors such as gender, region, urban/rural classification, and income showed less variation in purchasing behavior, but still provided interesting insights into consumer trends.
By Age:
- 69% of Gen Z reported buying a reusable water bottle in the past year, driven by environmental sustainability, making them the top group.
- 56% of Millennials also made such purchases, the second-highest after Gen Z.
- 49% of Gen X purchased reusable water bottles.
- 46% of Baby Boomers made similar purchases, the lowest among all age groups.
- Despite Gen Z being more likely to use bottled water, they also demonstrate a strong commitment to sustainable lifestyle choices, reflected in their higher rate of reusable bottle purchases.
By Gender:
- 61% of women purchased a reusable water bottle for environmental reasons, outpacing men.
- 51% of men made such purchases, showing a slight gender gap in sustainability-driven behavior.
By Region:
- The West led with 57% of residents purchasing reusable bottles for sustainability reasons.
- The Midwest followed closely with 56%.
- The Northeast had 55% of residents making purchases.
- The South had 53%, the lowest regional percentage.
- Region had a minimal impact on reusable water bottle purchases, with only a slight variation across geographic locations.
By Urban/Suburban/Rural Classification:
- Suburban areas saw the highest purchases at 57%.
- Urban residents followed closely at 56%.
- Rural residents had the lowest rate at 51%.
- Urbanization had little effect on purchasing patterns, with small variations across different residential areas.
By Income:
- 59% of upper-income individuals purchased reusable water bottles for sustainability.
- 57% of middle-income individuals made similar purchases.
- 51% of lower-income individuals bought reusable bottles, the lowest income group.
- Higher income correlates with an increased likelihood of purchasing reusable water bottles.
By Parental Status
- 55% of both parents and non-parents reported purchasing a reusable water bottle for sustainability reasons.
- Parental status did not affect the likelihood of purchasing reusable water bottles.
- Age is the most influential factor in determining the likelihood of purchasing a reusable water bottle, with a significant 23% difference between the highest (Gen Z) and lowest (Baby Boomers) age groups.
- Gender also shows some influence, with women more likely to purchase than men.
- Income and urban/rural classification affect purchasing behavior to a lesser extent, with no demographic group showing a difference greater than 10% aside from age.
- This demographic breakdown demonstrates that while certain factors like age play a significant role, most Americans across various demographics are showing increasing interest in environmentally sustainable choices like reusable water bottles.
Recent Developments in Reusable Water Bottles
The landscape of reusable water bottles has seen significant innovation and sustainability efforts in recent years. Here’s a summary of key developments from various companies:
- MOO Inc. Water Bottle: Launched in September 2021, this premium water bottle extends the MOO brand into the premium category with distinct colors and branding options.
- CamelBak MultiBev: Introduced in July 2020, CamelBak’s MultiBev is a 2-in-1 vessel that includes a water bottle and a travel cup, enhancing consumers’ convenience and versatility.
- Hydaway Collapsible Bottle: Released in February 2021, Hydaway’s collapsible bottle, made from silicone and BPA-free plastic, offers portability. It has two size options and multiple lid choices.
- Nalgene’s Tritan Renew: Starting in 2020, Nalgene shifted its production process to Tritan Renew, a 50% recycled material, completing the transition by January 2023, repurposing over 2.35 million pounds of plastic waste.
- SIGG’s Reusable Bottles at ABN AMRO Open: In February 2023, SIGG provided reusable bottles made from Tritan Renew to players at the ABN AMRO Open tennis tournament, showcasing sustainability efforts.
- Klean Kanteen and Drinkware CoLab: In December 2022, Klean Kanteen joined other outdoor drinkware companies to form the Drinkware CoLab, aiming to decrease carbon emissions and support the OIA’s goal of becoming a climate-positive industry by 2030.
- S’well Elements Collection: Launched in August 2022, S’well’s Elements Collection offers double-walled, stainless steel-insulated bottles in earthy shades. They feature long-lasting temperature retention and drip-free sipping.
- Klean Kanteen’s Rise Collection: Introduced in June 2022 for retail in January 2023, Klean Kanteen’s Rise collection features BPA-free drinkware made from 90% post-consumer recycled stainless steel, with durable construction and insulation.
- Tupperware’s Collaboration with Vera Bradley: In June 2022, Tupperware collaborated with Vera Bradley to release a limited-edition collection of reusable water bottles and other items showcasing fashion-forward designs.
- Tupperware’s Global Sourcing Center: Tupperware announced plans in December 2021 to open a strategic global sourcing center in Singapore, aiming to optimize the company’s supply chain and support expansion into new product lines and channels.
These developments reflect a growing emphasis on sustainability, innovation, and consumer convenience in the reusable water bottle market.
Conclusion
Reusable water bottles are gaining popularity as most people are becoming environment-conscious and alert. Using reusable water bottles not only helps decrease the amount of plastic waste produced every year, but they can also save customers money and reduce greenhouse gas emissions. The advantages of reusable water bottles have been known for a long time, but it generally takes time for the transition to happen and gain social acceptance.
The reusable water bottle statistics reveal nubile yet growing market drivers that also involve material preference, aesthetics, and environmental awareness. Therefore, more households now prefer using reusable water bottles over plastic ones.
Barry Elad is a tech enthusiast passionate about exploring various technology topics. He collects key statistics and facts to make tech easier to understand. Barry focuses on software and its benefits for everyday life. In his free time, he enjoys creating healthy recipes, practicing yoga, meditating, and walking in nature with his child. Barry's mission is to simplify complex tech information for everyone.