Christmas Spending Statistics By Habits, Borrowing Method, Demographics and Facts

Updated · Jan 06, 2025


TABLE OF CONTENTS
- Introduction
- Editor’s Choice
- General Christmas Spending Statistics
- Trending Gift Items Customers Expect at Christmas
- Holiday Shopping Planning Times Statistics
- US Christmas Gift Spending Over Time Statistics
- Average Shopping Time During Christmas Statistics
- Christmas Spending Habits Statistics
- Famous Shopping Websites for Christmas Shopping Statistics
- Christmas Expenditure Statistics By Borrowing Method
- Christmas Spending Demographics Statistics
- Budget For Christmas Gifts Per Child
- Most Famous Christmas Tree Decoration
- Tips to Save During Christmas Time
- Conclusion
Introduction
Christmas Spending Statistics: Christmas is a busy time for shopping. People buy all sorts of things for the holiday, like food, drinks, gifts, and home essentials. Businesses need to be ready for this time of year and make sure they can offer the best products and services to their customers.
Looking at past Christmas sales data can help businesses prepare for the holiday season. By understanding these sales trends, businesses can plan their inventory and make sure they have enough stock. Christmas is a peak shopping time, and it can be tough to handle all the orders by yourself. Sales data is just one way to get ready for Christmas. Another smart option is to use a third-party logistics (3PL) provider.
These companies can store products, manage high order volumes, and ensure quick and accurate deliveries, making the shopping experience easier for customers. By understanding Christmas Spending Statistics and predictions, businesses can make better decisions and meet customer demand without stress.
Editor’s Choice
- Christmas Spending Statistics stated that nearly 34% of shoppers in the US believe they are more likely to go into debt this year (2023) than last year.
- 29% of shoppers plan to buy gifts only when they are on sale.
- Almost 15% of Americans think they need more savings to afford all the gifts for the holidays.
- Christmas shopping in 2022 was expected to make up 18.4% of all holiday retail sales in the US.
- Men typically spend 10% more than women on holiday shopping, with an average of $94.
- 43% of people start their holiday shopping by the end of October.
- Only 1% of people do their Christmas shopping in January.
- 12% of shoppers (or 1 in 18) wait until mid-December to start buying gifts.
- Just 1 in 5 Americans go into debt after doing their holiday shopping.
- Friends are considered the worst gift-givers, as many people receive unwanted gifts.
- $15.2 billion is spent on unwanted gifts each year.
- Around 61% of people in the US receive unwanted gifts, which amounts to 154 million people.
- The biggest expenses for most people are gifts for family, food, and decorations.
- 61% of Americans share their details to get special deals on gifts.
- Only 2% of people sell their belongings to help fund their Christmas shopping.
- 66% of holiday shoppers are willing to pay extra for eco-friendly products.
- Nearly 51% of people buy gifts for themselves during the holidays.
- 19% of Americans make unplanned purchases while shopping for Christmas.
- Nearly 5% of people spend over $300 on gifts for their spouse.
- Christmas Spending Statistics stated that almost 3% of people don’t buy gifts for their friends.
- Almost 23% of shoppers check products on social media before making a purchase.
- 5% of men feel ignored or unloved if they don’t receive gifts for Christmas.
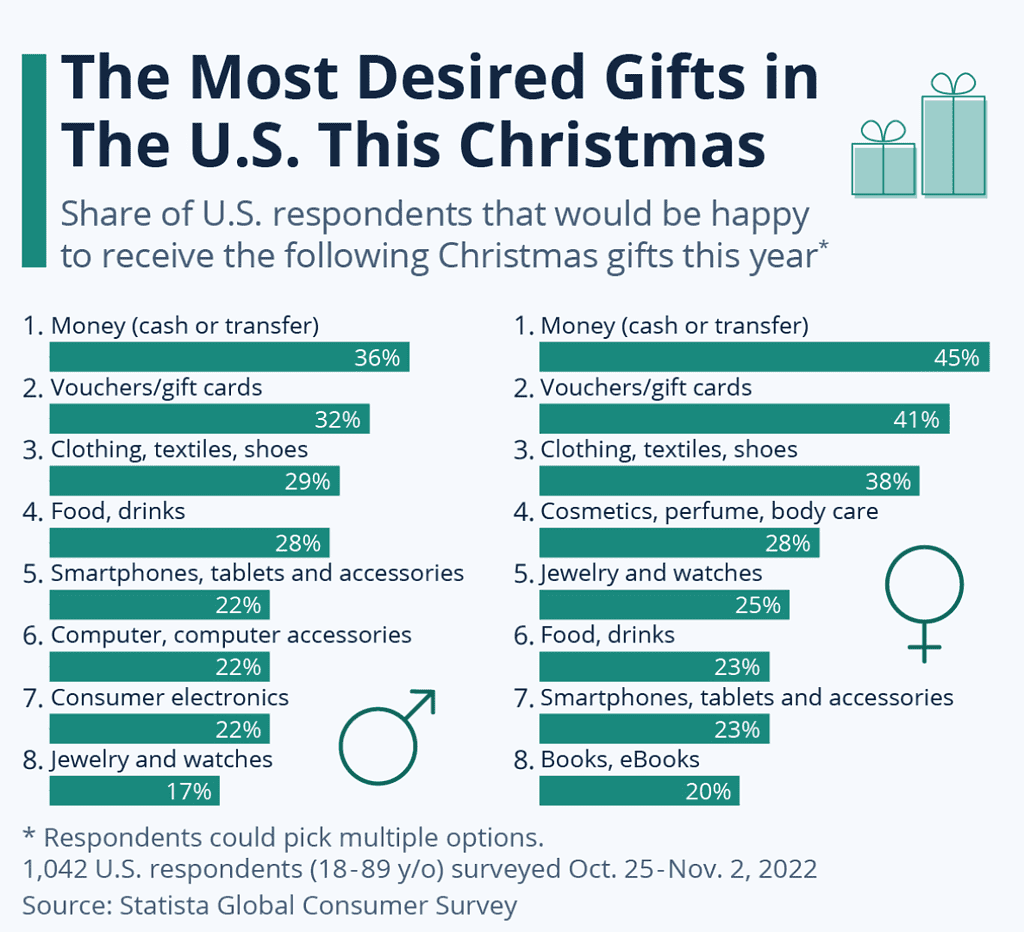
- Roughly 4% of women prefer jewelry as a Christmas gift.
- 2% of women like receiving store credit for their favorite shops, while 35.8% of women prefer handmade gifts.
- Almost 46% of people lie about liking the gifts they receive, with women doing this more often than men (51.4% vs. 35.5%).
- Christmas Spending Statistics stated that almost 49% of Americans don’t buy Christmas decorations.
- The year-over-year growth of Christmas holiday retail sales is 6%.
- Christmas shopping budgets are usually split as follows: 27.5% for food and drinks, 37.8% for gifts, 15.6% for decorations, 10.6% for charity, and 12.6% for transportation.
You May Also Like To Read
- Google Shopping Statistics
- Online Shopper Statistics
- Shopify Statistics
- How Late Is The Closest Grocery Store Open? – Detailed Analysis
- Online Food Ordering Statistics
- Kids’ Clothing Statistics
- Jewellery Statistics
- School Uniforms Statistics
- Men’s Clothing Statistics
- Women’s Clothing Statistics
General Christmas Spending Statistics
- Americans spend around $900 on Christmas every year.
- Christmas Spending Statistics stated that almost 71% of the holiday budget in the US is spent on buying gifts.
- US holiday sales have been growing each year for over ten years.
- 96% of Americans buy gifts for their families.
- According to Deloitte, Americans spend over $500 annually on non-gift items during the holidays.
- People in the US were expected to spend $178 billion on gifts.
- Nearly 81% of shoppers in the US checked products online before buying them in stores.
- 20% of shoppers used the “Buy Now, Pay Later” (BNPL) service.
- In 2023, 72% of people used credit cards for holiday shopping, adding up to $103 billion in credit card purchases.
(Source: quickemailverification.com)
- Due to rising prices in 2024, 79% of Amazon Prime members with early access also shopped on other websites.
- 46% of people pretend to like the gifts they get.
- Men tend to spend 10% more than women on holiday gifts, with men spending an average of $94.
- Christmas Spending Statistics stated that almost 12% of shoppers (about 1 in 18) waited until mid-December to begin their holiday shopping.
- 2% of women like receiving store credit for their favorite shops, while 35.8% prefer handmade gifts.
- Christmas shopping in 2022 was predicted to make up 18.4% of the total retail sales during the holiday season.
- Around 30% of people travel during the holidays.
- Canadians spend nearly $1,000 more than Americans on holiday shopping.
- On average, men spend 10% more than women on holiday purchases.
- The highest spenders during the holidays are people aged 45-54.
- People in the Northeast spend about $100 more per person on holidays than those in the South.
- Gift cards are the most popular presents to receive.
- 48% of Americans start their Christmas shopping before October ends.
- Christmas Spending Statistics stated that almost 63% of Americans shop online for their holiday gifts.
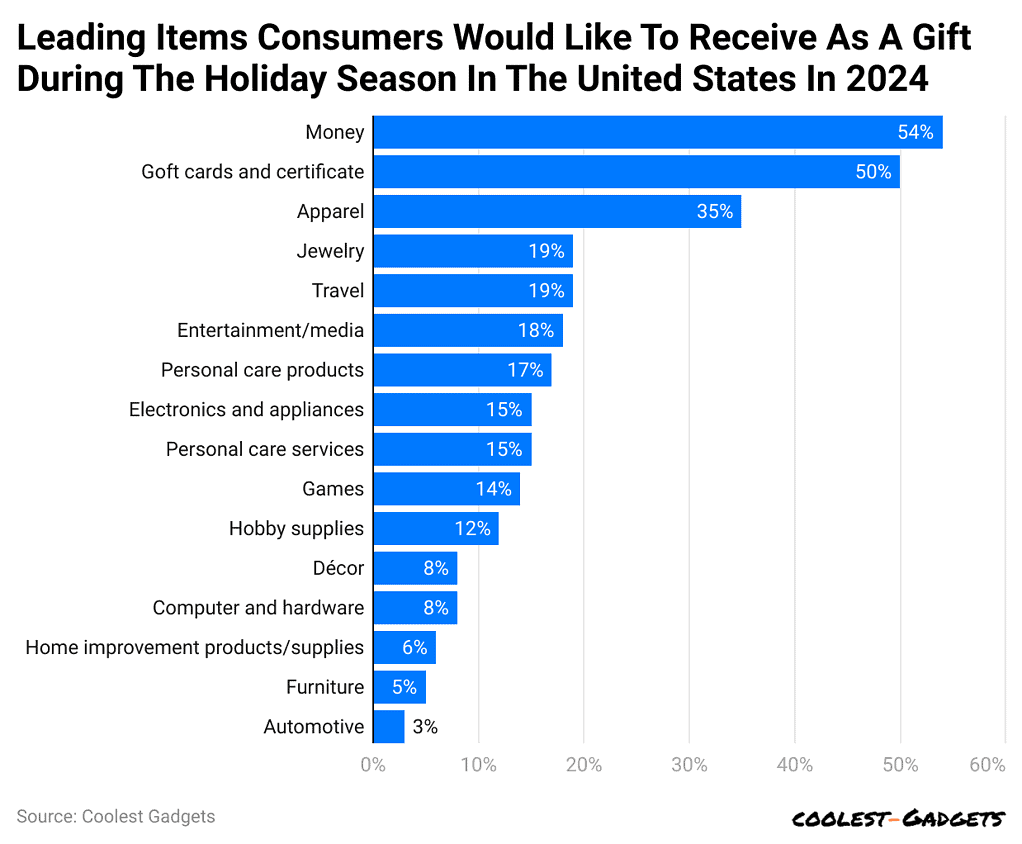
Trending Gift Items Customers Expect at Christmas
(Reference: electroiq.com)
- Money is the most desired gift, with 54% of people expecting it.
- Gift cards and certificates are the second most popular choice, with 50% of people hoping to receive them.
- Christmas Spending Statistics stated that around 35% of people are expecting clothing as a gift.
- Jewellery and travel are both anticipated by 19% of respondents.
- 18% of people are hoping for entertainment or media as a gift.
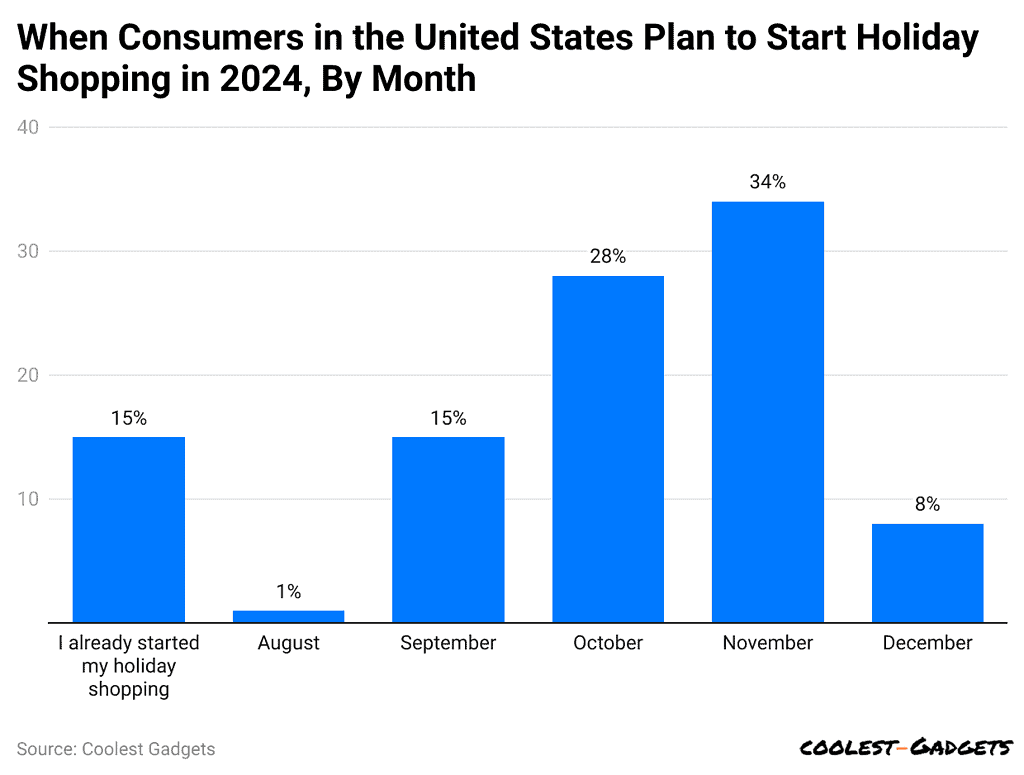
Holiday Shopping Planning Times Statistics
(Reference: electroiq.com)
- 34% of people plan their holiday shopping in November, making it the most common month for planning.
- October is the second most popular month, with 28% of people starting their shopping then.
- Christmas Spending Statistics stated that nearly 15% of respondents have already started their holiday shopping.
- September is another popular month for planning, with 15% of people getting a head start on their shopping.
- Only 8% of people wait until December to start their holiday shopping.
- August is the least popular month, with just 1% of people planning to begin shopping then.
US Christmas Gift Spending Over Time Statistics
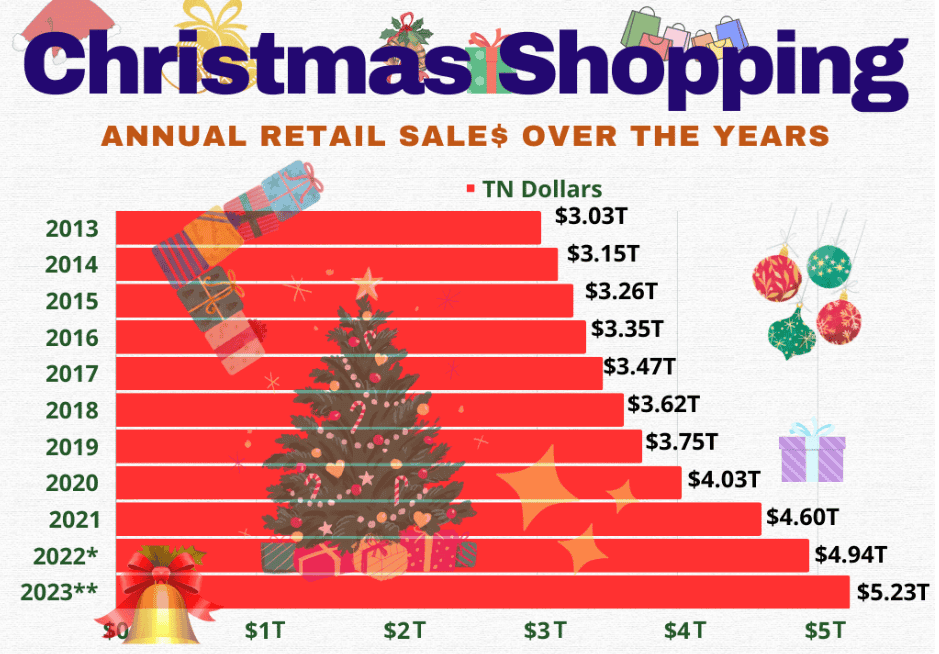
- The NRF reports that US holiday season retail sales have been increasing every year since 2008.
- In the most recent holiday season, sales totaled about $964.4 billion, more than double the $467.2 billion seen in 2004.
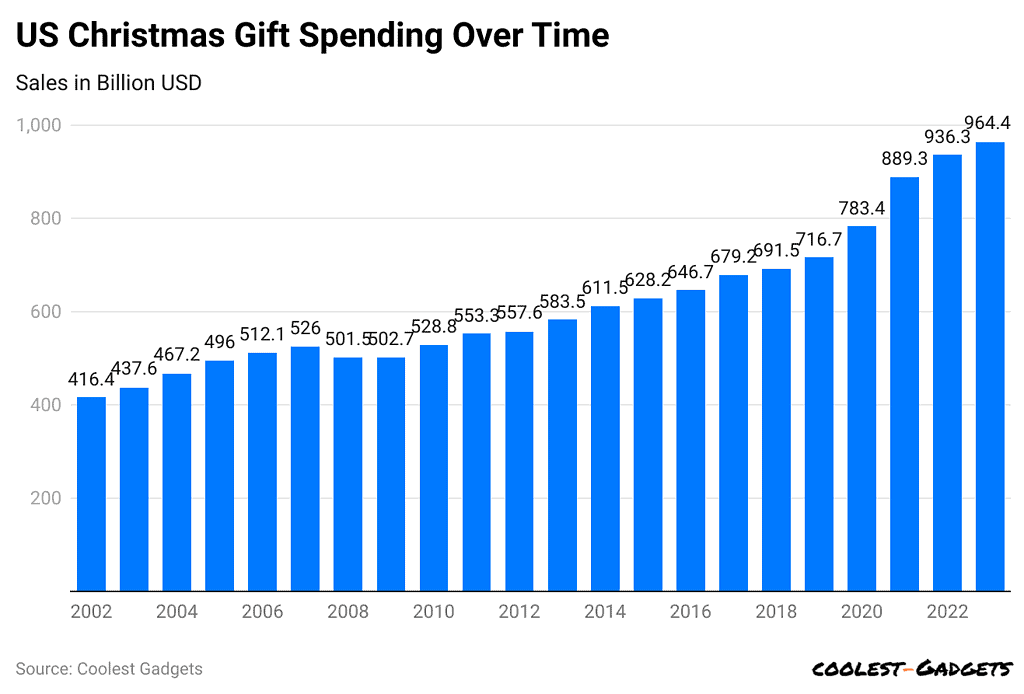
(Reference: explodingtopics.com)
| Year | Sales | Sales Changes over the last year | % Change over the last year |
|
2023 |
$964.4 billion | ↑ $28.1 billion | ↑ 3.8% |
| 2022 | $936.3 billion | ↑ $47 billion |
↑ 5.3% |
|
2021 |
$889.3 billion | ↑ $112 billion | ↑ 13.5% |
| 2020 | $783.4 billion | ↑ $64.4 billion |
↑ 9.3% |
|
2019 |
$716.7 billion | ↑ $25.3 billion | ↑ 3.6% |
| 2018 | $691.5 billion | ↑ $12.3 billion |
↑ 1.8% |
|
2017 |
$679.2 billion | ↑ $32.5 billion | ↑ 5.0% |
| 2016 | $646.7 billion | ↑ $18.5 billion |
↑ 3.0% |
|
2015 |
$628.2 billion | ↑ $16.7 billion | ↑ 2.7% |
| 2014 | $611.5 billion | ↑ $28 billion |
↑ 4.8% |
|
2013 |
$583.5 billion | ↑ $25.9 billion | ↑ 2.8% |
| 2012 | $557.6 billion | ↑ $4.3 billion |
↑ 2.6% |
|
2011 |
$553.3 billion | ↑ $24.5 billion | ↑ 4.6% |
| 2010 | $528.8 billion | ↑ $26.1 billion |
↑ 5.2% |
|
2009 |
$502.7 billion | ↑ $1.2 billion | ↑ 0.2% |
| 2008 | $501.5 billion | ↓ $24.5 billion |
↓ 4.7% |
|
2007 |
$526 billion | ↑ $13.9 billion | ↑ 2.7% |
| 2006 | $512.1 billion | ↑ $16.1 billion |
↑ 3.2% |
|
2005 |
$496 billion | ↑ $28.8 billion | ↑ 6.2% |
| 2004 | $467.2 billion | ↑ $29.6 billion |
↑ 6.8% |
|
2003 |
$437.6 billion | ↑ $21.2 billion | ↑ 5.1% |
| 2002 | $416.4 billion | – |
↑ 2.1% |
- Even though people spend more each year during the holidays, spending on gifts has not increased in every category.
- However, the average spending on gifts for friends, coworkers, and other people has remained mostly unchanged.
- Recent data shows that Americans overestimate their spending on Christmas gifts by more than $100.
- A 2024 survey revealed that US shoppers expected to spend an average of $1,012 on Christmas gifts, which is $110 more than they spent that year.
- The lowest expected spending on Christmas gifts in the 21st century occurred in 2008 ($616) and 2009 ($638).
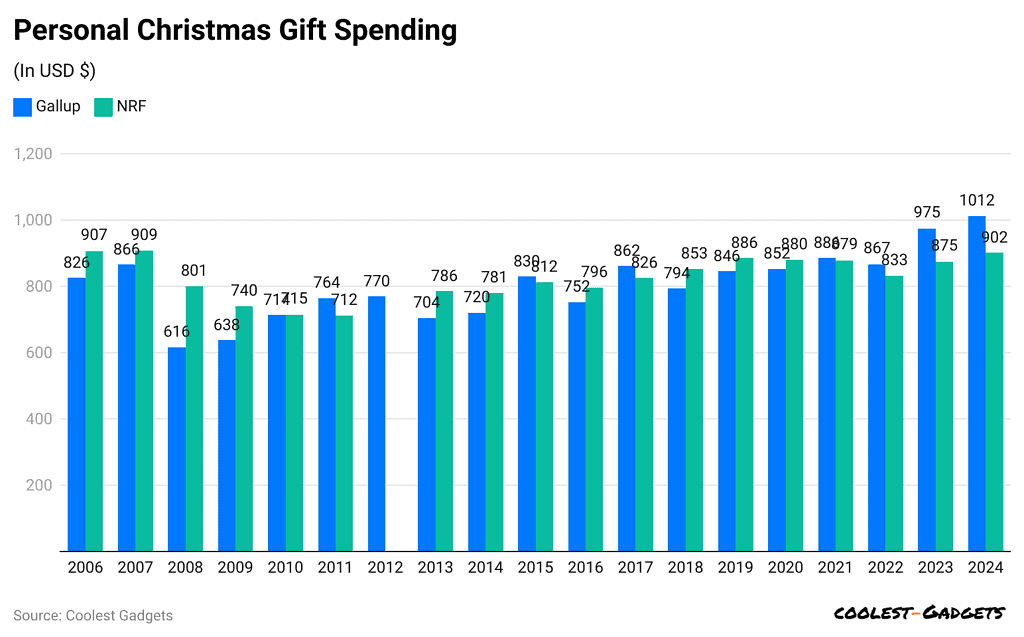
(Reference: explodingtopics.com)
| Year | Personal Christmas Gift Spending Estimate (Gallup) | Personal Christmas Gift Spending (NRF) |
| 2024 | $1,012 | $902 |
| 2023 | $975 | $875 |
| 2022 | $867 | $833 |
| 2021 | $886 | $879 |
| 2020 | $852 | $880 |
| 2019 | $846 | $886 |
| 2018 | $794 | $853 |
| 2017 | $862 | $826 |
| 2016 | $752 | $796 |
| 2015 | $830 | $812 |
| 2014 | $720 | $781 |
| 2013 | $704 | $786 |
| 2012 | $770 | – |
| 2011 | $764 | $712 |
| 2010 | $714 | $715 |
| 2009 | $638 | $740 |
| 2008 | $616 | $801 |
| 2007 | $866 | $909 |
| 2006 | $826 | $907 |
You May Also Like To Read
- Amazon Buy Box Statistics
- Baby Care Products Statistics
- Tripadvisor Statistics
- How Many Employees Does Target Corporation Employs?
- Food Truck Statistics
- Affiliate Marketing Statistics
- Content Marketing Statistics
- Etsy Statistics
Average Shopping Time During Christmas Statistics
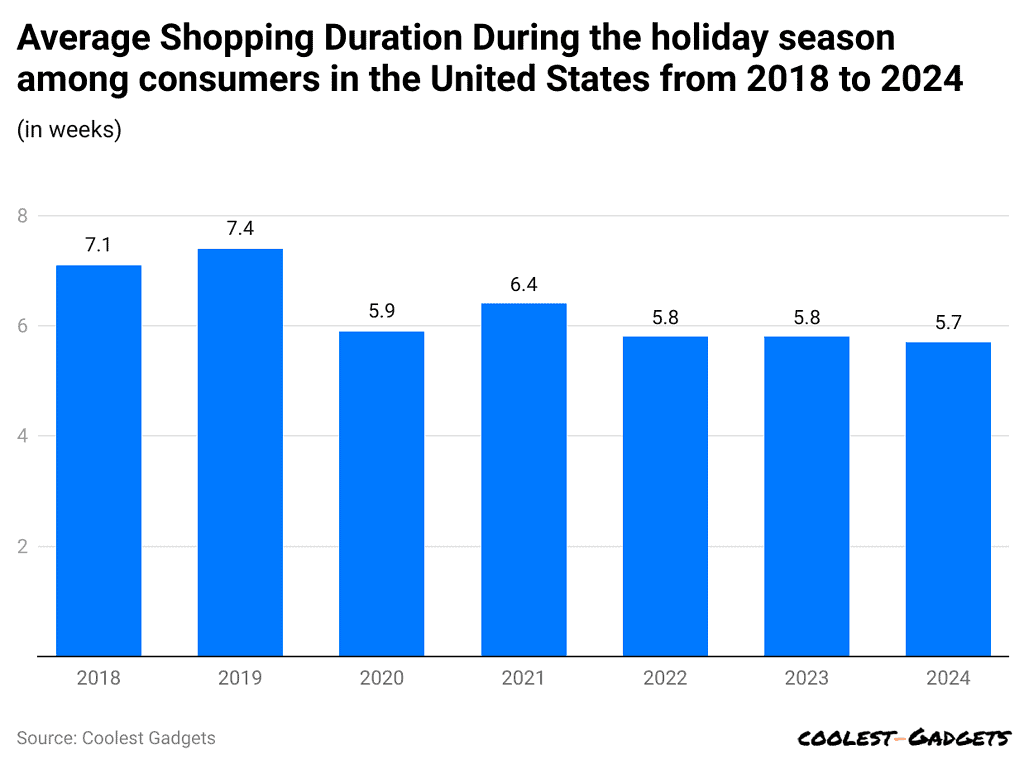
(Reference: electroiq.com)
- Christmas spending statistics indicate that the average time people spend shopping for the holidays has gotten shorter over time.
- In 2018, shoppers spent an average of 7.1 weeks preparing for Christmas.
- By 2023, that shopping period had decreased to 5.8 weeks.
Christmas Spending Habits Statistics
- Almost 75% of shoppers this year will look for affordable options. In addition, 80% of people want to shop in cost-effective ways this holiday season.
- In 2023, 48.9% of people shopped in physical stores for Christmas, while 51.1% shopped online. The top three places where people bought gifts were:
- Online stores
- Department stores
- Discount stores
(Source: enterpriseappstoday.com)
- During the holidays, 43% of Americans spend money on groceries. Other places people spend money include clothing stores, local shops, and electronics stores.
Here’s how US shoppers spent their money during the holiday season:
- Grocery stores/Supermarkets: 43%
- Clothing or accessories: 30%
- Local or small businesses: 24%
- Electronics stores: 20%
- Craft stores: 16%
- Drugstores: 12%
- Speciality stores: 11%
- Outlet stores: 10%
- Thrift stores/Resale shops: 9%
- Catalogues: 5%
- Other: 4%
- 35% of shoppers plan to stay home and save money this Christmas, while 56% will spend the same amount or more than usual on gifts.
- spend $13.7 billion on Cyber Monday sales in 2023.
- AI technology will play a big role in online shopping this holiday season, helping to generate $194 billion in sales for the holidays in 2023.
- 93% of shoppers will buy some of their gifts online this year.
- 41% plan to buy most of their gifts online and 6% will buy all their gifts online.
Here’s how many shoppers plan to buy gifts online this Christmas:
- All of them: 6%
- Most of them: 41%
- About half of them: 29%
- Only a few of them: 17%
- None of them: 7%
- Christmas Spending Statistics stated that nearly 81% of people who shop in stores research products online first.
- 87% of product searches start online, and less than 25% of shoppers go to physical stores to check products.
Famous Shopping Websites for Christmas Shopping Statistics
(Reference: electroiq.com)
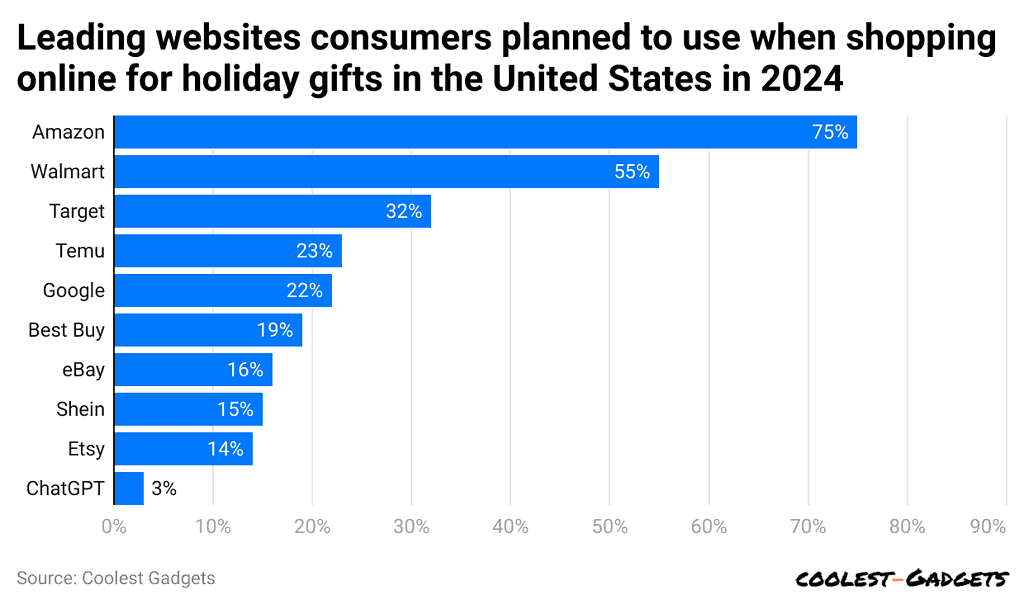
- Amazon is the most popular online store for Christmas shopping, with 75% of people choosing it.
- Walmart comes in second, preferred by 55% of shoppers.
- Target is third, with 32% of people shopping there.
- Temu is the fourth most popular, with 23% of respondents picking it.
- Google ranks fifth, with 22% of people using it for their holiday shopping.
- Best Buy is sixth, with 19% of shoppers selecting it.
Christmas Expenditure Statistics By Borrowing Method
| Credit Card | Bank Loan | Family/Relative | Cash Loan(outside bank) | BNPL( Buy Now Pay Later) | |
| Total | 39% | 36% | 27% | 26% | 12% |
| EUROPE | 37% | 28% | 30% | 25% | 15% |
| LATAM | 43% | 39% | 23% | 23% | 8% |
| USA | 48% | 42% | 36% | 42% | 32% |
| AFRICA | 17% | 49% | 24% | 33% | 4% |
- According to Christmas Spending Statistics, the largest group of shoppers (39%) plans to use credit cards for their holiday purchases.
- Meanwhile, 36% of shoppers are considering taking a bank loan.
- Around 27% of shoppers worldwide plan to borrow money from family or relatives, and 26% are thinking about getting cash loans from places other than banks.
- Christmas Spending Statistics stated that only 12% of shoppers are considering using the Buy Now, Pay Later (BNPL) option.
Christmas Spending Demographics Statistics
(Reference: finder.com)
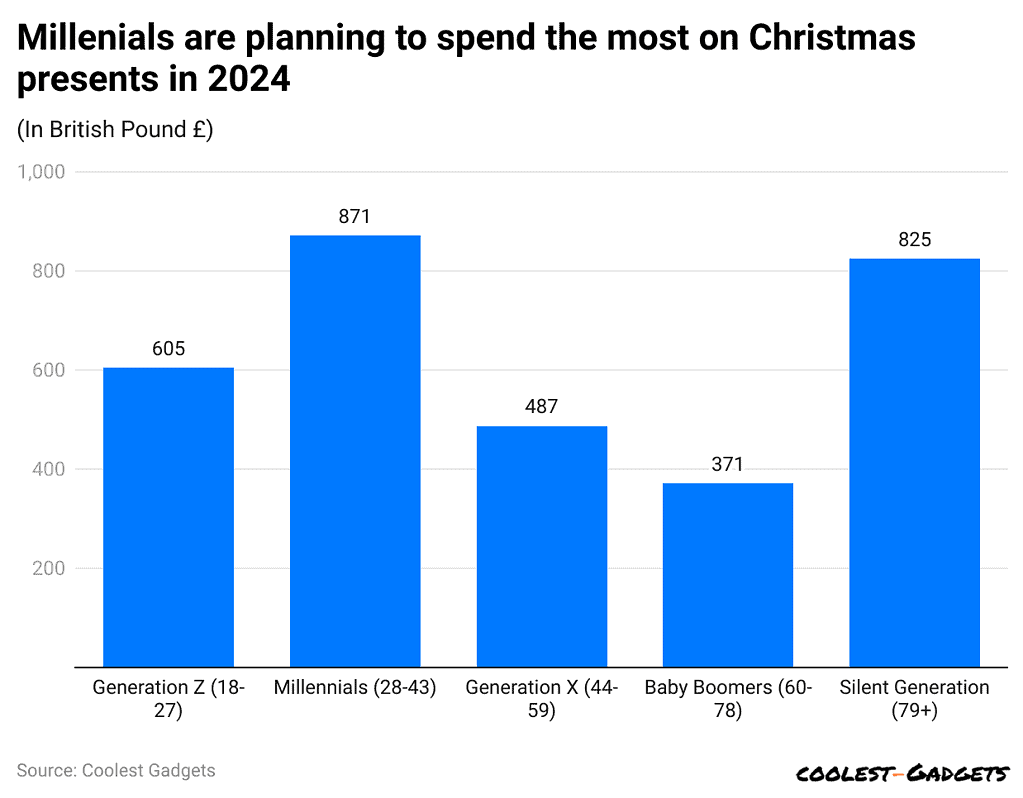
- Millennials (ages 28-43) are planning to spend the most on gifts this Christmas, with an average of $871 each.
- The Silent Generation (ages 79+) is also being generous, with an average spend of $825 each.
- Generation Z (ages 18-27) plans to spend a bit less at $605 each, while Generation X (ages 44-59) is planning to spend more cautiously, with an average of $487 each.
- Baby Boomers (ages 60-78) are spending the least, with an average of just $371 each, as they try to save on gift-giving this year.
| Age Group | Spend |
| 65+ | $1,077.41 |
| 55-64 | $999.22 |
| 45-54 | $1,161.98 |
| 35-44 | $1,083.74 |
| 25-34 | $888.98 |
| 18-24 | $649.81 |
- The average Christmas spending statistics show that shoppers aged 45 to 54 typically spend about $1,161.98 on gifts.
- People aged 35 to 44 spend an average of $1,083.74, while those aged 65 and older spend $1,077.41.
- Shoppers aged 55 to 64 spend around $999.22.
- In addition, people aged 25 to 34 spend $888.98 on average, and those between 18 and 24 spend about $649.81.
Budget For Christmas Gifts Per Child
(Reference: enterpriseappstoday.com)
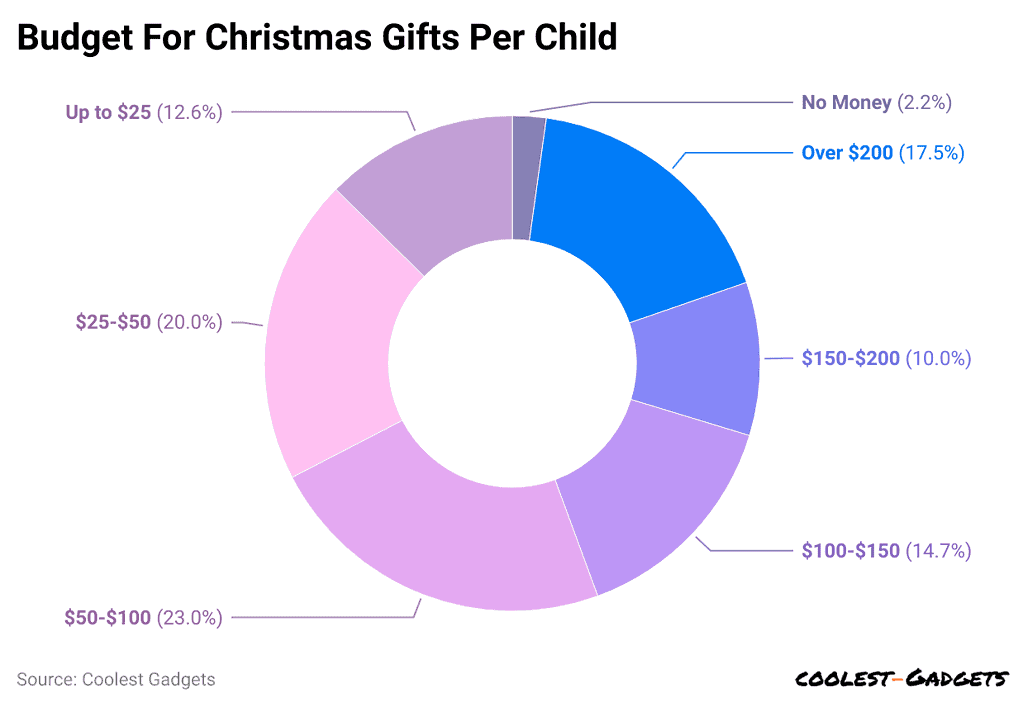
- According to the Christmas Spending Statistics, 23% of US families with one child have a holiday budget between $50 and $100.
- 20% of families plan to spend between $25 and $50, while 14.7% have a budget of $100 to $150 per child.
- Christmas Spending Statistics stated that almost 6% of families plan to spend up to $25, and 10% expect to spend between $150 and $200.
- 5% of families will spend more than $200. Meanwhile, 2.2% of families said they don’t have money for holiday spending and won’t have a budget.
Most Famous Christmas Tree Decoration
(Reference: electroiq.com)
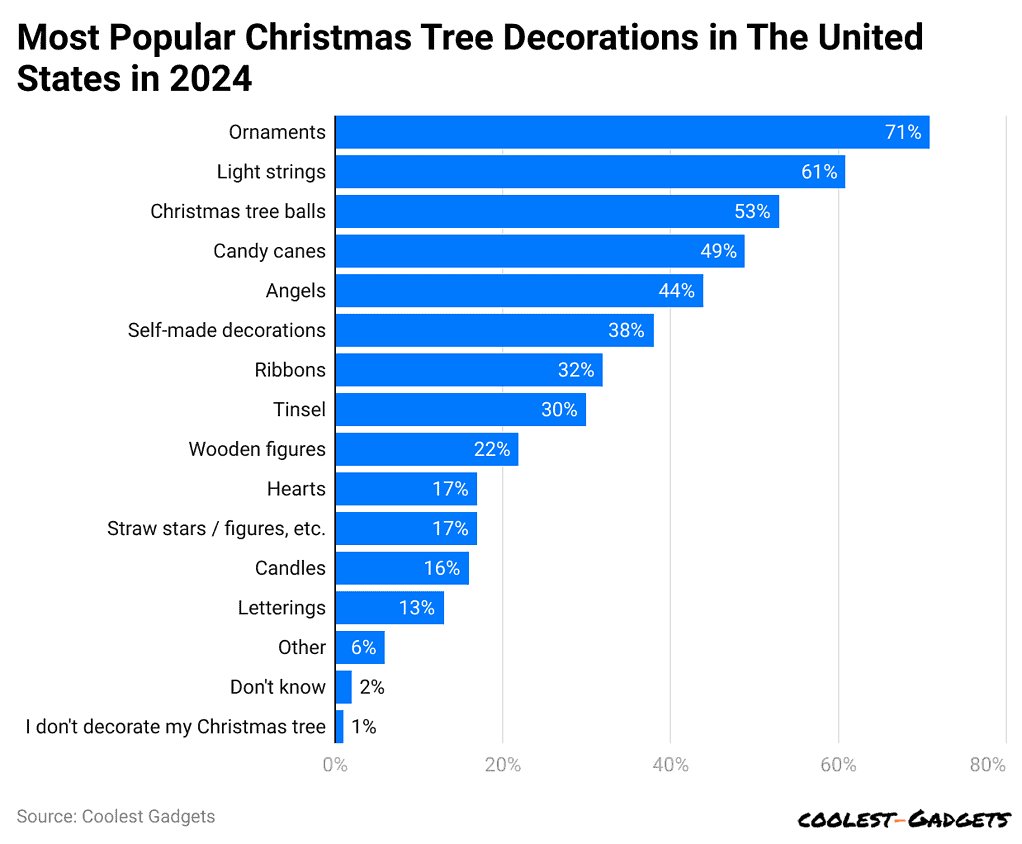
- Christmas Spending Statistics show that the most popular Christmas tree decoration is ornaments, with 71% of people choosing them.
- The second most popular decoration is light strings, selected by 61% of people.
- Christmas tree balls are in third place, with 53% of people preferring them.
- Candy canes come in fourth, with 49% of people picking them.
- Angels are the fifth most chosen decoration, with 44% of people liking them.
- Self-made decorations are the sixth most popular, selected by 38% of people.
Tips to Save During Christmas Time
In many countries, the cost of Christmas items like trees, candles, fairy lights, and food has gone up. Here are some tips to help you save money this Christmas:
Look for Sales!
- Make sure to check out seasonal sales like Black Friday (November 24th) and Cyber Monday (November 27th). Many stores, both online and in person, offer great discounts during these days. It’s a smart way to get ahead on Christmas shopping and save money.
Make a List
- The holiday season can be busy, so making a list is a great way to stay organized and find good deals. Whether you’re shopping for gifts, planning meals, or trying new holiday recipes, having everything written down helps you stay on track.
Stick to a Budget
- While it’s tempting to overspend during the holidays, sticking to a budget will help you see where your money is going and prevent you from spending too much. Break your budget into categories like food, gifts, and decorations.
Beat the Christmas Rush!
- Don’t wait until the last minute to get ready for Christmas. Start your shopping early, and enjoy sales and discounts before prices go up closer to the holidays.
Shop Around for the Best Deals
- If you know you want a specific gift, like a certain brand of pots, add it to your list and budget. Compare prices both online and in stores to find the best deal. If you’re sending money to relatives abroad, make sure to check for the best exchange rates and offers.
Conclusion
Christmas Spending Statistics show that while some habits stay the same, there are noticeable changes in where and how people shop, how long they shop, and what they buy. Online shopping is becoming more popular, competing with traditional in-store shopping, though physical stores are still widely used. Overall, spending continues to rise, showing both the strength of the economy and the importance of holiday gift-giving.
As technology, the economy, and cultural habits change, holiday shopping will keep evolving. Ongoing research is key to understanding how shoppers behave and what influences their spending.
Sources
FAQ.
In 2024, Americans are expected to spend an average of $997.73 each on Christmas. More than half of this will be used for gifts, and around $231 will go towards other costs like food, candy, decorations, cards, and flowers. When including travel, gifts, and entertainment, the total amount spent is projected to be $1,638.
Christmas is one of the most important holidays for over 2 billion people in more than 160 countries worldwide.
Saisuman is a talented content writer with a keen interest in mobile tech, new gadgets, law, and science. She writes articles for websites and newsletters, conducting thorough research for medical professionals. Fluent in five languages, her love for reading and languages led her to a writing career. With a Master’s in Business Administration focusing on Human Resources, Saisuman has worked in HR and with a French international company. In her free time, she enjoys traveling and singing classical songs. At Coolest Gadgets, Saisuman reviews gadgets and analyzes their statistics, making complex information easy for readers to understand.