Alibaba Statistics By Stock Market, eCommerce Platform, Revenue and Facts

Updated · Feb 04, 2025


TABLE OF CONTENTS
Introduction
Alibaba Statistics: Alibaba Group Holding Limited is a company based in the Cayman Islands, created on June 28, 1999, under the Companies Law of the Cayman Islands. The company started as a small business with the idea that the Internet could help small businesses grow and compete both locally and globally. Today, Alibaba is the largest online shopping platform and has many subsidiaries around the world. Its main businesses include online shopping, cloud computing, digital media, entertainment, and innovation projects.
Additionally, Ant Financial, a related company, provides payment and financial services to consumers and businesses. Alibaba has built a digital economy that connects consumers, sellers, brands, retailers, service providers, and business partners. In this article, we will shed more light on Alibaba Statistics.
Editor’s Choice
- Alibaba’s market value ranks it among the top 50 global companies.
- Approximately 17.12% of Alibaba’s desktop website visitors are from the US, and 16.75% are from China.
- For AliExpress, 13.04% of desktop visitors are from Brazil, 8.20% from the US, and 7.49% from Spain.
- Alibaba employs 259,316 full-time workers.
- The company’s Tmall marketplace featured over 17 million products during the Singles Day sale, an increase from 14 million products the previous year.
- Alibaba anticipates the smallest growth in Singles Day sales in its history for the current year.
- The company is enhancing loyalty programs to boost merchant engagement and focusing on VIP customers to ensure the success of Singles Day.
You May Also Like To Read
- Google Shopping Statistics
- Online Shopper Statistics
- Shopify Statistics
- How Late Is The Closest Grocery Store Open?
- Online Food Ordering Statistics
- Kids’ Clothing Statistics
- Jewellery Statistics
- School Uniforms Statistics
- Men’s Clothing Statistics
- Women’s Clothing Statistics
History of Alibaba Group
Alibaba Group Holding Limited, or Alibaba, is a global technology company from China that focuses on online shopping, retail, the Internet, and technology. It was started on June 28, 1999, in Hangzhou, Zhejiang. The company offers a variety of services, including consumer-to-consumer (C2C), business-to-consumer (B2C), and business-to-business (B2B) sales through both Chinese and international platforms. It also provides services like digital media, entertainment, logistics, and cloud computing. Alibaba owns many businesses in different industries around the world.
On September 19, 2014, Alibaba went public on the New York Stock Exchange (NYSE) and raised $25 billion in its initial public offering (IPO), making it the largest IPO ever at that time with a market value of $231 billion. Today, it is one of the top 10 most valuable companies in the world and ranked 31st on Forbes’ 2020 Global 2000 list. In January 2018, Alibaba became the second Asian company to be valued at over $500 billion, after Tencent. As of 2022, Alibaba ranks 9th in global brand value.
Alibaba is one of the biggest online retailers and e-commerce companies worldwide. In 2020, it was also listed as the fifth-largest artificial intelligence company. Additionally, Alibaba is one of the largest venture capital and investment companies in the world, and it’s the second-largest financial services group, after Visa, through its fintech division, Ant Group. The company has also been growing in the media industry, with its revenue increasing significantly year after year. It also broke records on China’s Singles’ Day, the biggest shopping event in the world, both online and offline.
The name “Alibaba” was chosen by the company’s founder, Jack Ma, because it is based on the well-known character Ali Baba from the Middle Eastern story collection One Thousand and One Nights. Jack Ma felt the name was easy to remember, globally recognized, and had a positive meaning. In the story, Ali Baba is a kind character who helps others, which Ma saw as a perfect fit for the company’s mission of helping small businesses succeed. The name was confirmed when a waitress recognized “Ali Baba” from the famous phrase “Open Sesame.”
General Alibaba Statistics
- Alibaba plans to reach $1.4 trillion in total sales (GMV) by 2024. To put this into perspective, in 2015, Alibaba’s sales were only 76 billion yuan. Now, just nine years later, the company is aiming to have 1 billion active users and $1.4 trillion in GMV. This target has been part of their five-year growth plan.
- As part of their five-year plan, Alibaba wants to have 1 billion active customers by 2024. The company’s GMV is growing fast, and if things continue as expected, Alibaba will keep getting even bigger.
- Alibaba Statistics stated that the Alibaba website offers 5,900 different product categories and about 2.8 million storefronts. This large selection helps Alibaba succeed both in China and globally.
- The site is a “one-stop shop” for almost anything you need, and as Alibaba grows, the number of categories and storefronts will likely increase.
- Alibaba employs over a quarter of a million full-time workers—259,316 to be exact. This number doesn’t include freelancers or consultants who may also be part of the company’s network.
(Source: statista.com)
- During the 13th annual 11.11 Global Shopping Festival (China’s version of Black Friday), Alibaba’s GMV reached $84.54 billion over 11 days. Around 290,000 brands took part in the event.
- Alibaba Statistics stated that Online shopping in China is expected to reach $3.6 trillion by 2025.
- Alibaba Statistics stated that China is predicted to be the first country where more than 50% of retail sales happen online.
- Retail sales in China are forecasted to grow by 44.6% in the next four years. Alibaba is expected to make $1.33 trillion in sales in China by the end of 2022.
- At the same time, Amazon is expected to earn three times more than Alibaba by the end of 2022. Alibaba also plans to have 2 billion global customers by 2036.
- Alibaba introduced the “Buy Now, Pay Later” option in Asia, a trend that other companies have since adopted. SoftBank was one of the early investors in Alibaba, originally investing $20 million.
Alibaba Stock Market Statistics
#1. Valuation Measures
| Current | 9/30/2024 | 6/30/2024 | 3/31/2024 | 12/31/2023 | 9/30/2023 | |
|
Enterprise Value/EBITDA |
9.20 | 12.10 | 5.51 | 6.05 | 6.87 | 9.39 |
| Enterprise Value/Revenue | 1.42 | 1.75 | 0.96 | 0.92 | 1.09 |
1.39 |
|
Price/Book |
1.77 | 1.90 | 1.26 | 1.26 | 1.33 | 1.59 |
| Price/Sales | 1.82 | 1.97 | 1.42 | 1.45 | 1.56 |
1.85 |
|
PEG Ratio (5yr expected) |
0.65 | 0.79 | 3.24 | 0.56 | 0.79 | 0.99 |
| Forward P/E | 10.25 | 12.36 | 8.61 | 7.94 | 7.68 |
9.63 |
|
Trailing P/E |
20.14 | 26.65 | 16.73 | 13.51 | 10.86 | 19.65 |
| Enterprise Value | 189.56B | 236.75B | 124.38B | 117.47B | 139.83B |
170.85B |
|
Market Cap |
215.53B | 271.11B | 174.65B | 179.51B | 197.17B |
222.74B |
#2. Stock Price History
(Reference: blog.roboforex.com)
| 200-Day Moving Average | 85.31 |
| 50-Day Moving Average | 86.71 |
| 52 Week Low | 68.36 |
| 52 Week High | 117.82 |
| S&P 500 52-Week Change | 22.21% |
| 52 Week Range | 32.44% |
| Beta (5Y Monthly) | 0.35 |
#3. Share Statistics
| Shares Short (prior month 9/30/2024) | 67.99M |
| Short % of Shares Outstanding (10/31/2024) | 2.61% |
| Short % of Float (10/31/2024) | 3.12% |
| Short Ratio (10/31/2024) | 2.58 |
| Shares Short (10/31/2024) | 62.56M |
| % Held by Institutions | 16.10% |
| % Held by Insiders | 0.01% |
| Float | 16.57B |
| Implied Shares Outstanding | 2.54B |
| Shares Outstanding | 2.38B |
| Avg Vol (10 days) | 29.13M |
| Avg Vol (3 month) | 16.59M |
#4. Dividend &Splits
| Last Split Date | — |
| Last Split Factor | — |
| Ex-Dividend Date | 6/13/2024 |
| Dividend Date | 7/12/2024 |
| Payout Ratio | 51.42% |
| 5 Year Average Dividend Yield | — |
| Trailing Annual Dividend Yield | 0.00% |
| Trailing Annual Dividend Rate | 0.00 |
| Forward Annual Dividend Yield | 2.21% |
| Forward Annual Dividend Rate | 2 |
Alibaba Revenue Statistics
(Reference: oberlo.com)
| Year | Revenue in a million yuan | Annual change |
| 2024 | 941,168 | +8.3% |
| 2023 | 868,687 | +1.8% |
| 2022 | 853,062 | +18.9% |
| 2021 | 717,289 | +40.7% |
| 2020 | 509,711 | +35.3% |
| 2019 | 376,844 | +50.6% |
| 2018 | 250,266 | +58.1% |
| 2017 | 158,273 | +56.5% |
| 2016 | 101,143 | +32.7% |
| 2015 | 76,204 | +45.1% |
| 2014 | 52,504 | +52.1% |
| 2013 | 34,517 |
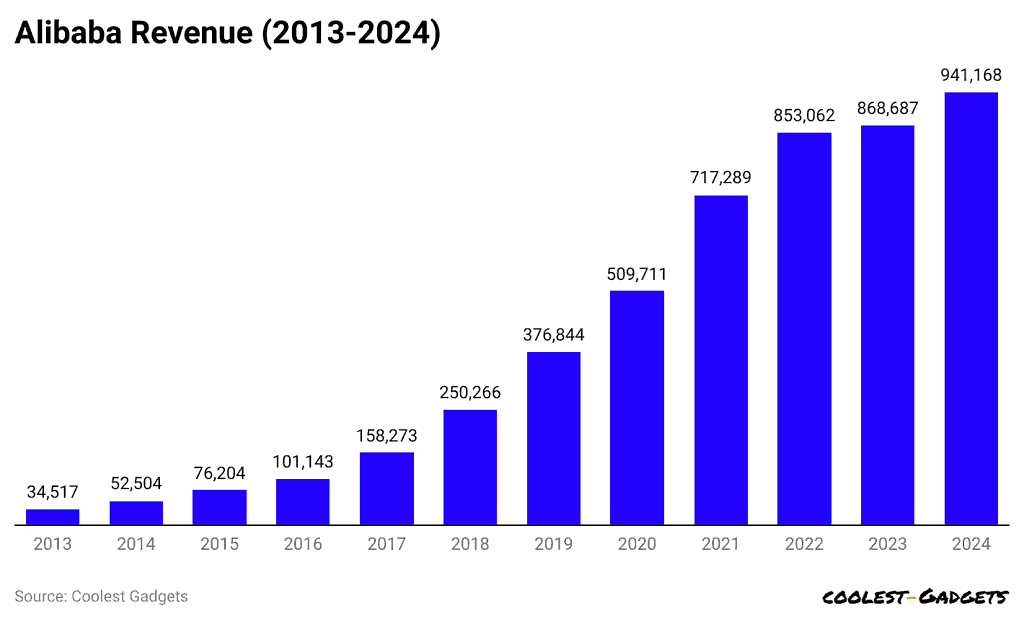
- In Alibaba’s current financial year, which ended on Mar 31, 2024, the company’s revenue grew by 8.3%, reaching 941.2 billion yuan, or about $132.3 billion.
- Alibaba Statistics stated that the largest increase in Alibaba’s yearly revenue occurred in 2018, when it jumped by 58.1%, reaching 250.3 billion yuan.
- From 2013 to 2024, Alibaba has seen an average annual revenue growth of 36.4%.
- Recent data shows that in Alibaba’s financial year ending in March 2024, the company earned 941.2 billion yuan, or about $132.3 billion, which is a 9.3% increase compared to the previous year.
- Looking at Alibaba’s yearly revenue growth, the company has shown steady growth. In 2013, it made 34.5 billion yuan ($4.9 billion). The following year, it grew by 52.1%, reaching 52.5 billion yuan ($7.4 billion).
- In 2015, Alibaba’s annual revenue first crossed the $10 billion mark, growing 32.7% to 76.2 billion yuan. In 2016, it continued growing by 32.7%, reaching 101.1 billion yuan ($14.2 billion).
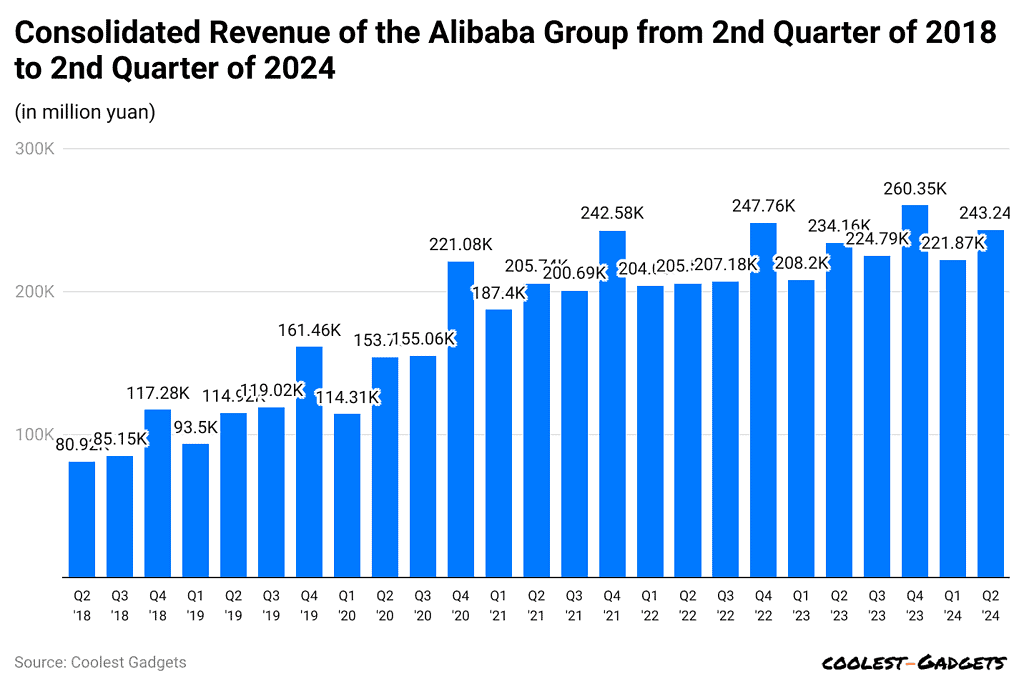
(Reference: statista.com)
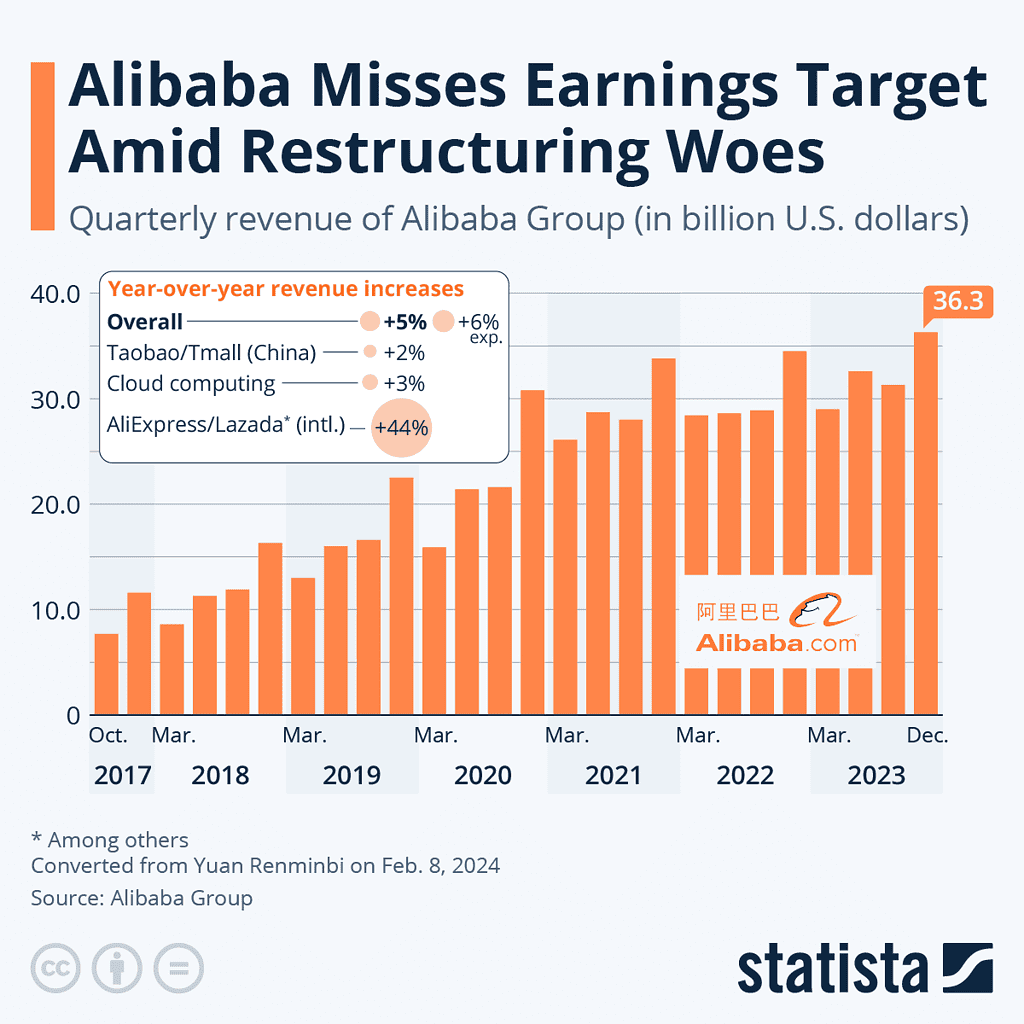
- In the second quarter of 2024, Alibaba earned around 243.24 billion yuan in total revenue.
- The company’s different areas of business include e-commerce, cloud computing, digital media and entertainment, innovation projects, and other services.
- Revenue growth sped up in 2017, increasing by 56.5% to 158.3 billion yuan ($22.2 billion). The company continued to grow strongly in the next few years, and by 2021, its revenue hit 717.3 billion yuan ($100.8 billion), crossing $100 billion for the first time.
- In 2022, despite slower growth of 18.9%, Alibaba’s revenue still reached 853.1 billion yuan ($119.9 billion). In 2023, it grew to 868.7 billion yuan ($122.1 billion), but at a much slower rate of just 1.8%.
- From 2013 to 2024, Alibaba’s annual revenue grew more than 25 times, with an average annual growth rate of 36.4%. The largest increase happened in 2018, with revenue jumping by 58.1%.
- Alibaba’s success goes beyond just revenue. Its shopping app consistently ranks highly on both Apple and Android devices.
- AliExpress, its online store, also gets over 900 million visits each month, making it one of the most visited e-commerce sites worldwide.
You May Also Like To Read
- Amazon Buy Box Statistics
- Baby Care Products Statistics
- Tripadvisor Statistics
- How Many Employees Does Target Corporation Employs?
- Food Truck Statistics
- Affiliate Marketing Statistics
- Content Marketing Statistics
- Etsy Statistics
Future of Alibaba Statistics
- By 2025, Alibaba is expected to be a key player in China’s e-commerce market, with online retail sales in the country reaching $3.6 trillion.
- Retail sales in China are forecasted to grow by 44.6%, which will help Alibaba grow even more. The company plans to have 2 billion customers worldwide by 2036.
- Alibaba is expected to make $1.33 trillion in sales in China by the end of 2022.
- As the company expands globally, its revenue will keep growing, and its market share will increase.
- Alibaba Statistics stated that Alibaba’s platforms, like AliExpress, are also predicted to continue growing internationally.
Alibaba eCommerce Platform Statistics
(Reference: Secommercedb.com)
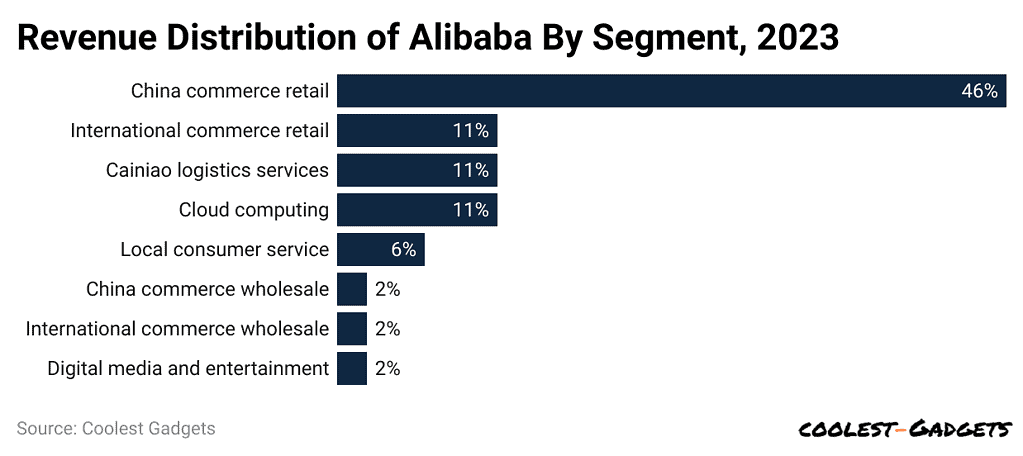
- Most of Alibaba’s revenue comes from its eCommerce platforms, Taobao and Tmall.
- In 2023, 46% of Alibaba’s total revenue came from its China commerce retail business, making it the main source of income for the company.
- Other areas bring in smaller amounts: 11% each comes from international eCommerce (like AliExpress and Trendyol), Cainiao logistics services, and cloud computing.
- Smaller portions come from local consumer services (6%), China commerce wholesale (2%), international commerce wholesale (2%), and digital media and entertainment (2%).
Conclusion
In conclusion, Alibaba has transformed from a small online shopping site into a global tech leader. With strong revenue growth, a wide variety of services, and millions of customers worldwide, the company remains a top player in e-commerce and technology. While growth has slowed recently, Alibaba’s solid financial standing, continued investment in cloud computing, and global expansion plans ensure its ongoing success.
As it moves ahead, Alibaba will likely continue to be a key leader in e-commerce, technology, and logistics worldwide. We have shed enough light on Alibaba Statistics through this article.
Sources
FAQ.
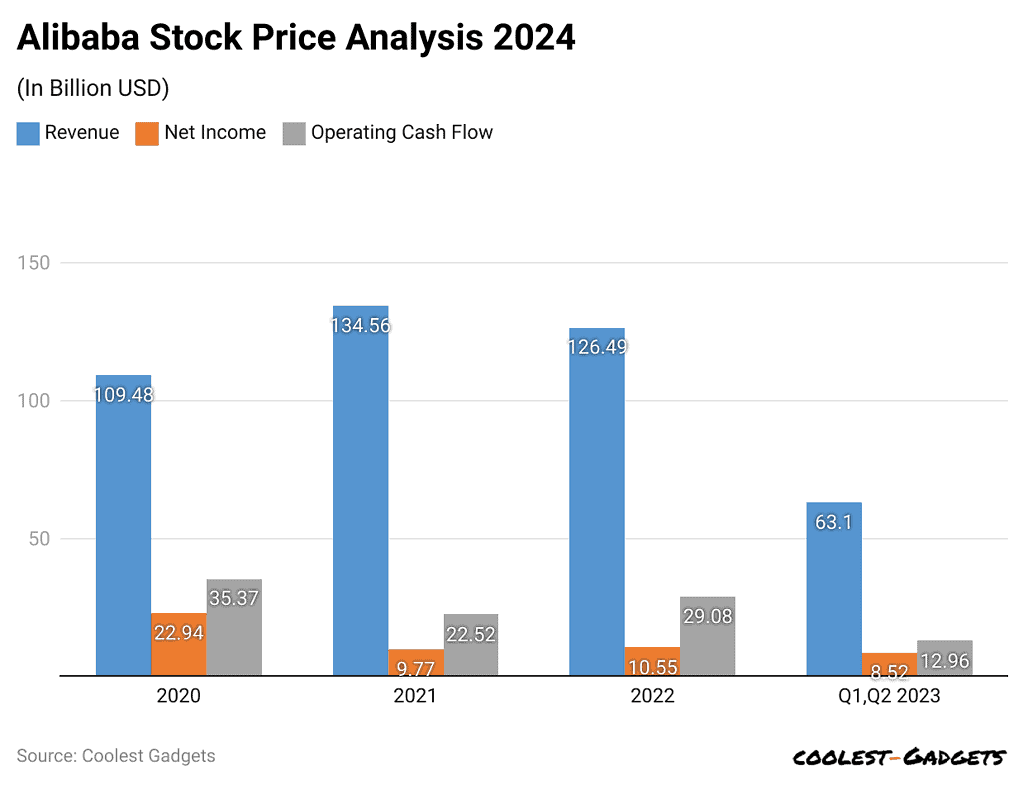
Alibaba’s revenue for 2024 was $130.35 billion, which is a 3.05% increase compared to 2023. In 2023, the company earned $126.49 billion, a 6% drop from 2022. In 2022, Alibaba’s revenue was $134.57 billion, representing a 22.91% rise from 2021.
Alibaba’s cash, cash equivalents, and investments show that the company is still in a strong financial position. However, net cash and free cash flow have decreased because of continued spending on Alibaba Cloud’s infrastructure and refunds to Tmall merchants after the company cancelled the annual service fee.
Jack Ma is one of the co-founders of Alibaba Group, which started as an online shopping platform and has now become a huge global tech company. Before starting Alibaba, Ma was an English teacher. In 1999, he and 17 other co-founders created Alibaba.com in a small apartment in Hangzhou, a city in eastern China.
Saisuman is a talented content writer with a keen interest in mobile tech, new gadgets, law, and science. She writes articles for websites and newsletters, conducting thorough research for medical professionals. Fluent in five languages, her love for reading and languages led her to a writing career. With a Master’s in Business Administration focusing on Human Resources, Saisuman has worked in HR and with a French international company. In her free time, she enjoys traveling and singing classical songs. At Coolest Gadgets, Saisuman reviews gadgets and analyzes their statistics, making complex information easy for readers to understand.