Robocalls Statistics And Facts (2025)

Updated · Mar 07, 2025


TABLE OF CONTENTS
- Introduction
- Editor’s Choice
- General Robocalls Statistics
- Types of Robocalls
- Robocall Demographics
- Victims Of Scam Calls By Gender
- Top Robotext Categories
- Top 5 States for Spam Texts Per Capita in the US
- Top Robocall Categories
- Share Of Robocalls By Level-Rating
- Robocalls By State Per Capita
- Robocalls and Reducing Trust Statistics
- United States Most Affected Cities of Robocalls Statistics, January 2025
- Financial Losses By Robocall Scams
- Robocall Prevention Statistics
- Conclusion
Introduction
Robocalls Statistics: Robocalls are automated phone calls that deliver prerecorded messages to people. Businesses, government agencies, and scammers often use these calls. While some robocalls are helpful, like reminders from banks or hospitals, many are unwanted and annoying. Scammers use robocalls to trick people into giving personal information or money. In recent years, robocalls have increased worldwide, making them a big problem for phone users. Governments and phone companies are working on ways to stop illegal robocalls, such as blocking suspicious numbers and using new technology.
This article explores why robocalls happen, how they affect people, and what steps can be taken to reduce them. Understanding robocalls can help protect you from scams and unwanted calls.
Editor’s Choice
- Robocall Statistics reported that in 2024, Americans received approximately 56 billion robocalls, a 7% increase from the 53 billion recorded in 2023.
- This equates to an average of about 4.7 billion robocalls per month, or roughly 157.6 million calls per day.
- On average, each person in the U.S. received approximately 161 robocalls over the year.
- Texas led the nation with 10.7 billion robocalls in 2024, followed by California and Florida.
- Major metropolitan areas such as Dallas, Atlanta, and Houston were among the most affected, with Dallas receiving approximately 162 million robocalls in November 2024 alone.
- The Federal Trade Commission (FTC) reported a significant decrease in complaints about unwanted telemarketing calls, with a drop of over 50% since 2021.
- As of December 2024, the percentage of signed calls at termination was 47%.
- Scam calls constituted approximately 22% of all robocalls in 2024, while telemarketing calls accounted for 36%, and alerts and reminders made up 25%.
- S. consumers lost an estimated USD 65 billion to robocall scams by December 2023, highlighting the financial impact of these fraudulent activities.
- In 2024, Asia recorded around 25 billion robocalls. India, for example, has become a hotspot, with 20% of calls being spam-related.
- In the U.S. and parts of Europe, the number of robocalls is forecasted to decrease by around 5% by 2025 due to continued advancements in blocking technology and strict enforcement.
- According to a report on 2023 mid-year insights and analysis by Robokiller, the number of robocalls has declined to 5 billion a month due to government strategies.
- As of 2023, Robocalls Statistics reveal that around 34 billion robocalls were made in December, which is 17 spam calls per person in the US.
- Two-thirds of people say that they still receive an equal number of robocalls even after registering for the National Do Not Call Registry (NDNCR).
You May Also Like To Read
- Augmented Reality Statistics
- Metaverse Statistics
- Virtual Reality Statistics
- Quantum Computing Statistics
- Biometrics Statistics
- Ransomware Statistics
- Robocalls Statistics
- Data Breach Statistics
- Laptop Statistics
- Desktops Statistics
- Smartphone Statistics
- VoIP Statistics
General Robocalls Statistics
- In 2024, people in the U.S. received an average of 152.9 million robocalls daily.
- Every hour, about 6.4 million robocalls were placed, and every second, nearly 1,800 robocalls were sent.
- Each person received an average of 14.4 robocalls throughout the year.
- As of 2023, Robocalls Statistics reveal that around 3.34 billion robocalls were made in December, which is 17 spam calls per person in the US.
- Furthermore, 78 billion robotext were received by Americans as of Q1 of 2023.
- According to a report on 2023 mid-year insights and analysis by Robokiller, the number of robocalls has declined to 5 billion a month due to government strategies.
- Compared to 2022, in 2023, Robocalls were increased by +18%.
- Robocalls Statistics estimate that, in Q1 of 2023, USD 13 billion was lost to Robotech scams.
- 90% of people who answer robocalls feel uncomfortable.
- 70% of the people who commonly receive robocalls believe that they have limited choices in fighting against such calls.
- Nearly half of the people who have registered for Do not call say it is not effective.
- Two-thirds of people say that they still receive an equal number of robocalls even after registering for the National Do Not Call Registry (NDNCR).
- There is a possibility that 43% of victims of robocalls will download caller ID apps or spam blockers.
Types of Robocalls
| Type | 2024 Share | 2025 Estimated Share |
| Scams | 22% |
23% |
|
Telemarketing |
36% | 35% |
| Alerts & Reminders | 25% |
25% |
|
Payment Reminders |
16% | 15% |
| Unclassified | 1% |
2% |
(Source: blog.youmail.com)
Robocall Demographics
- In 2024, approximately 56 million Americans were victims of scam calls, resulting in an estimated loss of USD 25.4 billion.
- In 2023, Americans received approximately 53 billion robocalls, an average of 161 calls per person annually. This number is projected to rise to 56 billion in 2024.
- Younger individuals are increasingly targeted, with those aged 18 to 34 accounting for 46% of scam victims and those aged 35 to 44 comprising 51% of victims.
- Men are more frequently victimised by robocall scams, representing 55.6% of victims, while women account for 42.2%.
- About 90.66% of robocalls originate within the United States, while the other 9.34% come from countries such as India, Nigeria, and Egypt.
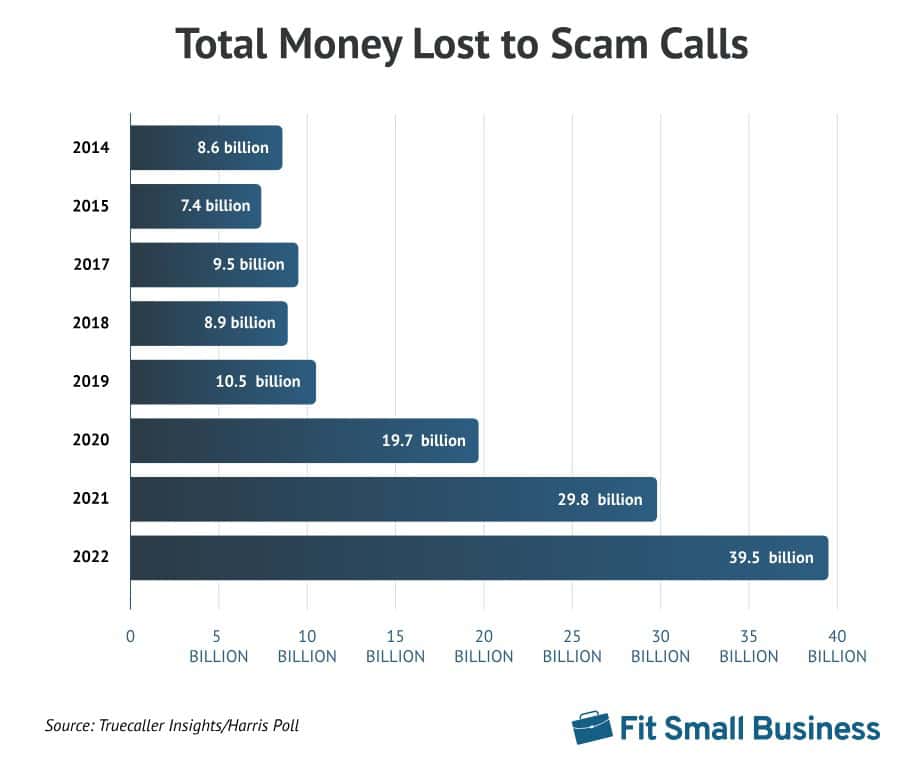
- The average financial loss from phone scams in 2022 was USD 577, a 14.94% increase compared to the USD 502 average in 2021. This rise shows that scammers are becoming more successful in extracting higher sums of money from victims.
- Younger individuals between the ages of 18 to 44 accounted for over half of all victims of robocall scams, with 46% of victims aged 18 to 34 and 51% aged 35 to 44. This suggests that scammers target younger demographics who may be more susceptible to such scams.
- Men were more likely than women to fall victim to robocall scams, with 55.6% of victims being male compared to 42.2% being female. Younger men, in particular, were more frequently targeted.
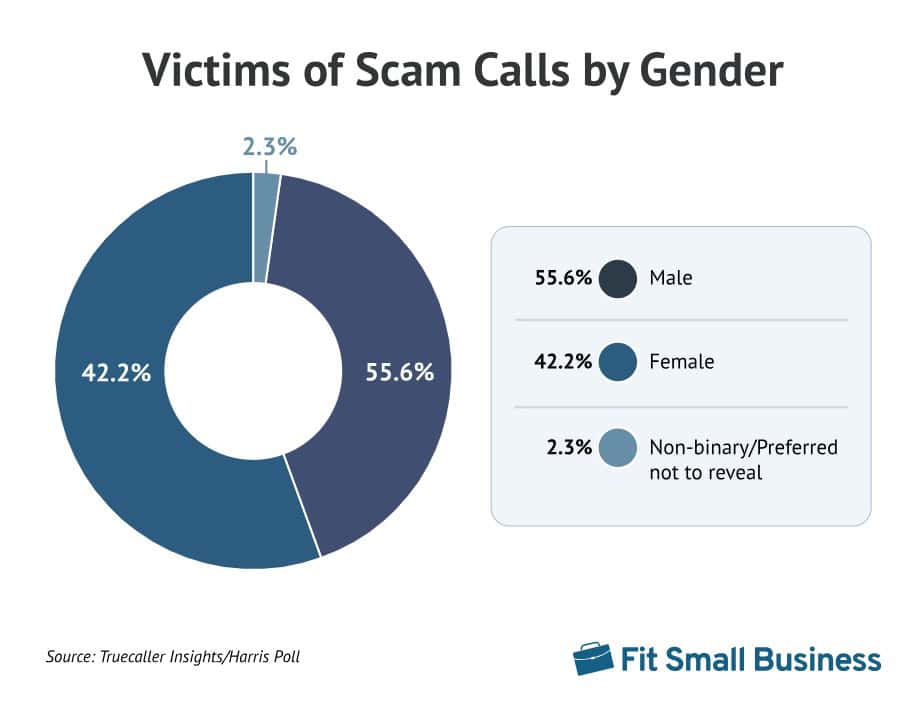
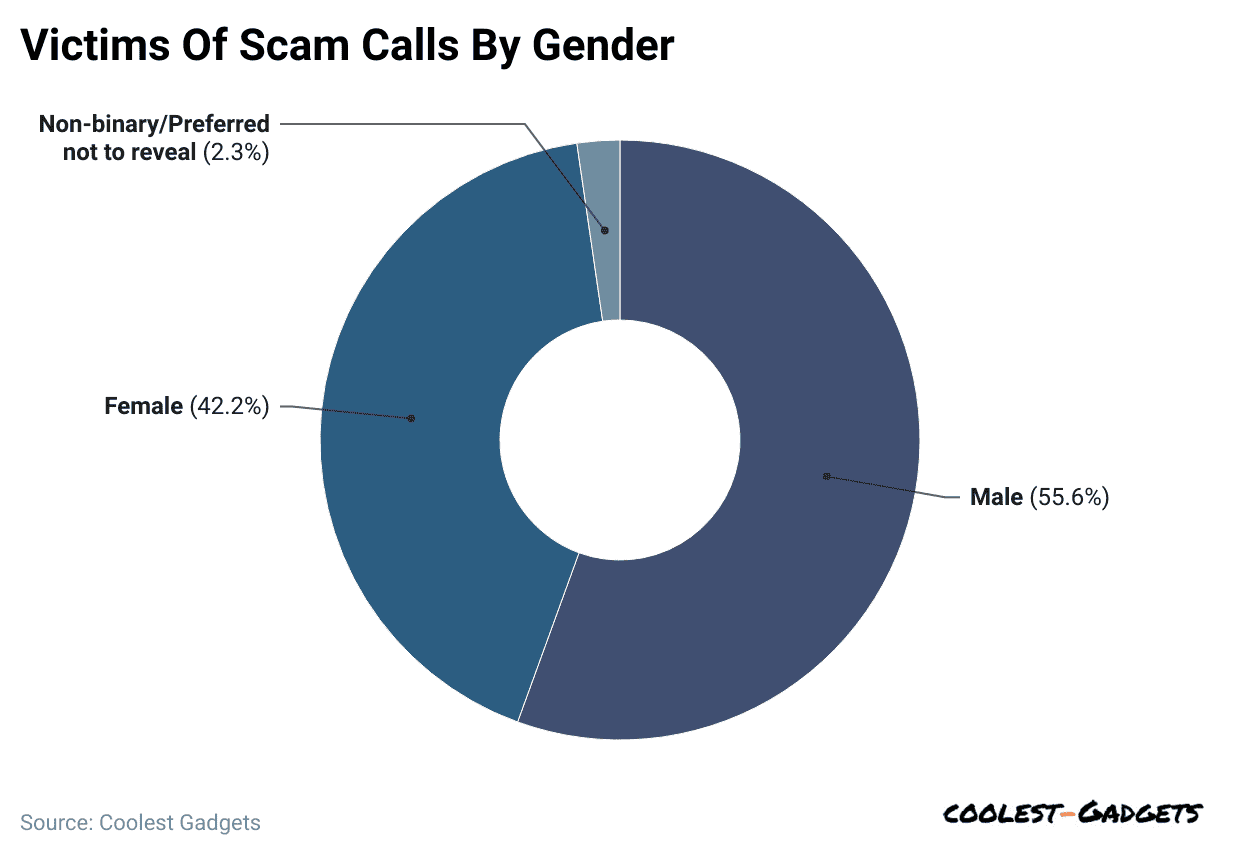
Victims Of Scam Calls By Gender
 (Reference: fitsmallbusiness.com)
- Robocalls Statistics show that 55.6% of people who fall prey to scam calls are males, while females represent 42.2%.
- In addition, 51% of men in middle age groups, i.e., 35 to 44 years, are more likely to be victims.
Top Robotext Categories
 (Reference: cdn.prod.website-files.com)
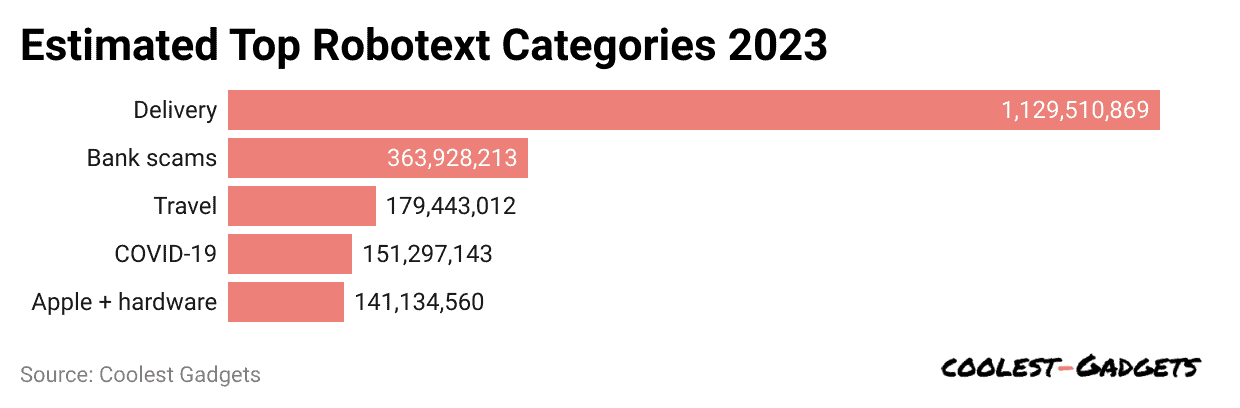
- Robocalls Statistics show that delivery-related robotext is the most common way scammers adopt it.
- In 2023, approximately 1,129,510,869 robotext went sent in the US.
- Bank scams and travel scams hold respective places with 363,928,213 and 179,443,012 estimated scam texts.
You May Also Like To Read
- iPhone Vs. Android Statistics
- Google Pixel Smartphones Statistics
- iPhone vs Android Users Statistics
- Mesh Wi-Fi System Statistics
- Robots Statistics
- Western Digital Statistics
- Cloud Gaming Service Statistics
- Virtual Reality Headset Statistics
- AI in Robotics Statistics
- 3D Printers Statistics
- Smart City Statistics
- 3D Printing Statistics
Top 5 States for Spam Texts Per Capita in the US
| Estimated Robotexts 2023 | State | Texts per person |
|
607,738,414 |
South Dakota | 840 |
| 4,186,613,092 | Missouri |
820 |
|
2,952,218,477 |
South Carolina | 697 |
| 1,681,573,107 |
Utah |
638 |
|
352,124,882 |
Washington, DC |
602 |
Top Robocall Categories
 (Reference: cdn.prod.website-files.com)
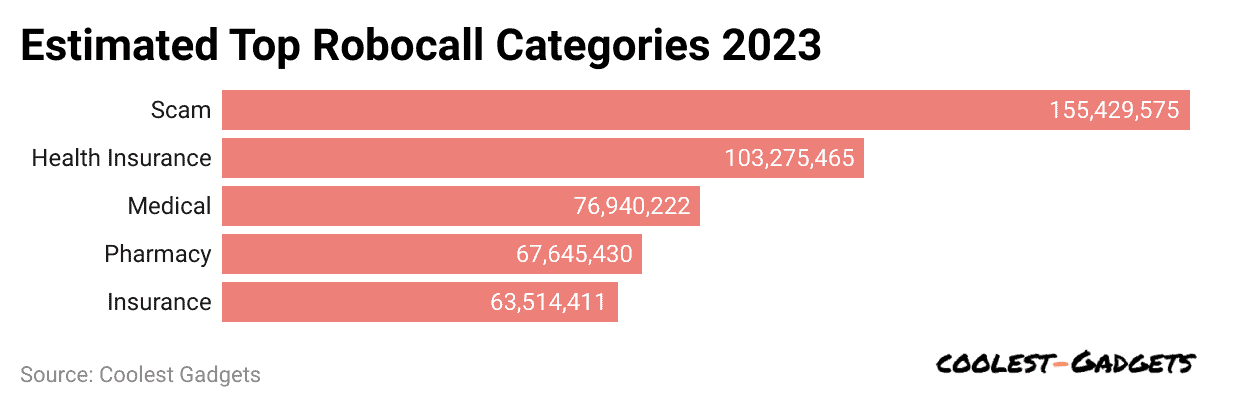
- Scams are a leading robocall category, contributing, on average, 155,429,575 calls, followed by health insurance at 103,275,465.
- Medical robocalls are responsible for 76,940,222, while pharmacy and insurance contribute 67,645,430 and 63,514,411.
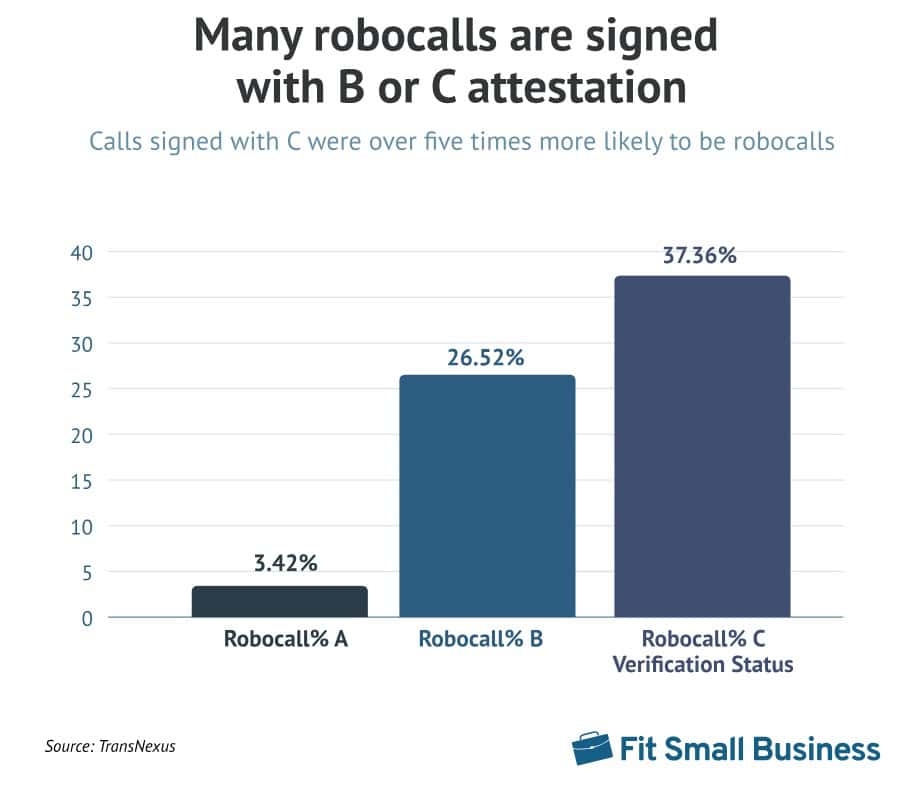
 (Reference: fitsmallbusiness.com)
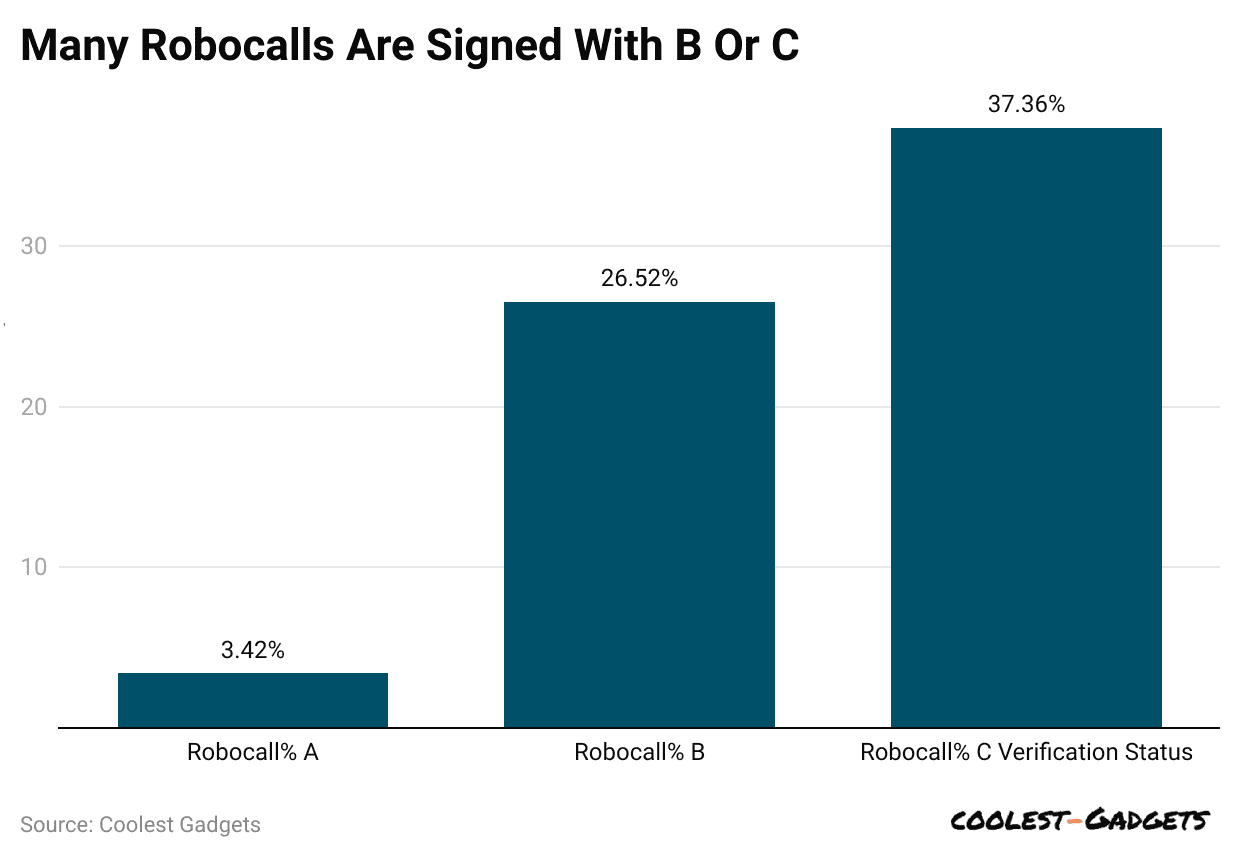
- 37.36% of the calls with C-level ratings are said to be 5 times more likely to be robocalls.
- According to fitsmallbusiness.com, C-type calls are the lowest-rated calls; thus, the call origin can’t be identified.
- Furthermore, there is also a possibility that B-type calls include 26.52% of robocalls.
Robocalls By State Per Capita
- As of 2023, Texas reported a significant amount of spam calls per capita, resulting in 4,334,838,865.
- Arkansas and Oklahoma ranked second and third.
| Estimated Spam calls | Calls per person | State |
|
4,334,838,865 |
181 | Texas |
| 421,413,419 | 168 |
Arkansas |
|
504,568,018 |
153 | Oklahoma |
| 635,332,632 | 150 |
South Carolina |
|
576,909,731 |
149 |
Louisiana |
Robocalls and Reducing Trust Statistics
- Approximately 2,700 robocalls are made every second worldwide, with consumers receiving an average of 28 robocalls and texts each month.
- Global losses from scam calls amount to billions of dollars annually. As of December 2023, U.S. consumers have lost USD 65 billion due to these scam calls.
- The United States accounts for 10% of the world’s phone spam. In comparison, Spain receives 24%, the United Kingdom 22%, Italy 21%, and France 20%.
- In Canada, consumers receive an average of 4 to 5 spam calls per month, which constitutes about 20% of all calls made in the country.
- In Brazil, nearly 50% of all phone calls are classified as spam, with 10% being actual fraudulent calls.
- Canadian scammers are increasingly using AI to remove accents, create convincing scripts, and clone voices to deceive recipients of their calls.
- To combat foreign robocalls, the FCC has proposed regulations that would require U.S. gateway providers to verify calls before passing them onto U.S. networks.
- Spam calls hurt businesses, hospitals, government organizations, and educational institutions by decreasing consumers’ willingness to answer calls from unknown numbers.
United States Most Affected Cities of Robocalls Statistics, January 2025
| Location | Number of Robocalls |
| Atlanta, GA |
164.5M calls (+9% MoM) |
|
Dallas, TX |
156.4M calls (+7% MoM) |
| Houston, TX |
140.1M calls (+7% MoM) |
|
Chicago, IL |
135.5M calls (+8% MoM) |
| New York, NY |
122.4M calls (+7% MoM) |
|
Los Angeles, CA |
109.9M calls (+7% MoM) |
| Baltimore, MD |
86.1M calls (+12% MoM) |
|
Phoenix, AZ |
80.1M calls (+13% MoM) |
| Newark, NJ |
65.5M calls (+8% MoM) |
|
Detroit, MI |
63.5M calls (+6% MoM) |
Financial Losses By Robocall Scams
- Robocalls Statistics state that scammers have stolen over USD 1 trillion globally in the past year, affecting millions of consumers worldwide.
- Americans lost approximately USD 25.4 billion to phone scams over the past 12 months, with more than 56 million U.S. adults affected.
- Fraud losses in the UK, dominated by online scams, grew to £11.4 billion in 2024, a £4 billion increase from the previous year.
- Australians lost USD 2.74 billion to online scams in 2023, with victims over 65 losing USD 120 million. This represents a 13.3% increase in reported losses.
- Only 4% of scam victims worldwide were able to recover their losses, highlighting the urgent need for improved consumer protection mechanisms.
- In 2023, mobile users worldwide lost about USD 58 billion due to scam robocalls. Fraudsters used tricks like fake caller IDs and unauthorised call forwarding, making scams hard to detect.
- North America suffered the most, with over 50% of the total losses; thus, robocall scams have become more advanced. Both individuals and businesses must stay cautious and use stronger security measures to prevent financial harm.
- Robokiller estimates that the total number of robocalls worldwide will reach 82 billion by 2023. These increasing scam calls are expected to cause financial losses of around USD 70 billion by 2027.
You May Also Like To Read
- Network Attached Storage (NAS) Statistics
- Hacking Statistics
- Augmented Reality Glasses Statistics
- Virtual Reality Treadmill Statistics
- Uninterruptible Power Supply Devices (UPS) Statistics
- Social Engineering Statistics
- Podcast Statistics
Robocall Prevention Statistics
- Nearly 49% of individuals who signed up for the Do Not Call Registry believe it is ineffective.
- More than 67% of people registered on the National Do Not Call Registry report receiving the same number of robocalls as they did before.
- Additionally, 19% of those who signed up for the registry claim they receive more robocalls than they did before registration.
- Calls that are signed with a C-level attestation are over five times more likely to be robocalls.
- After being scammed, 43% of victims choose to install a spam blocker or caller ID app to prevent future fraud.
- Also, 37% change their credit card or account details for security.
- Robocalls Statistics Research shows that people with higher incomes are more cautious about robocalls than those earning under USD 50,000 yearly.
Conclusion
Robocalls have become a major issue, disturbing people with unwanted and often fraudulent calls. Many scams use robocalls to trick people into giving personal information or money. Governments and phone companies are working to stop them by using better technology and stricter rules.
However, robocallers keep finding new ways to reach people. To stay safe, people should avoid answering unknown calls and never share personal details over the phone. By staying alert and using call-blocking tools, we can reduce the impact of robocalls and protect ourselves from scams in the future.
Sources
Joseph D'Souza started Coolest Gadgets in 2005 to share his love for tech gadgets. It has since become a popular tech blog, famous for detailed gadget's reviews and companies statistics. Joseph is committed to providing clear, well-researched content, making tech easy to understand for everyone. Coolest Gadgets is a trusted source for tech news, loved by both tech fans and beginners.