Gillette Statistics By Brand Valuation, Demographics, Razor Users and Facts

Updated · Mar 10, 2025


TABLE OF CONTENTS
- Introduction
- Editor’s Choice
- General Gillette Statistics
- Gillette Historical Revenue
- Gillette Annual Growth
- Gillette Annual Revenue Over Time
- By Key Financial Results
- Gillette Brand Value
- Gillette Advertising Cost Statistics
- Gillette Demographics Statistics
- Gillette Brand Profile Among Shaver And Razor Users
- Gillette Razor Usage Frequency Statistics
- Gillette Market Share Statistics By Country
- By Product Launch
- The Most Valuable Cosmetics Brands Statistics
- Gillette’s Website Traffic Statistics By Country
- By Traffic Sources
- Conclusion
Introduction
Gillette Statistics: Gillette, a name synonymous with shaving for generations, boasts a rich history and strong presence in the market. In 2024, Gillette continues to hold a prominent position in the global grooming and personal care market. As a subsidiary of Procter & Gamble (P&G), Gillette has built its reputation on innovation, quality, and consumer trust.
This article will guide you effectively as it includes different current trends and analyses from several insights. Let’s delve into some interesting statistics to understand the brand’s reach and impact.
Editor’s Choice
- In the first quarter of 2024, Gillette, under Procter & Gamble (P&G), reported solid financial performances and overall net sales of USD 21.9 billion, which represented a 6% increase compared to the previous year.
- Gillette’s annual revenue in 2023 was USD 82 billion, a growth rate of 2,27% from 2022.
- Gillette Statistics 2024 further states that in the U.S., Gillette experienced a 3% volume growth, with value share increasing by 50 basis points and volume share rising by 60 basis points.
- Specifically, Gillette India’s revenue from operations rose by 3.4% for the quarter ending December 31, 2023, contributing significantly to the overall performance.
- Gillette India’s profit for the quarter ending December 31, 2023, rose by 39.6% to 1.04 billion rupees (approximately USD 12.5 million).
- P&G’s gross profit margin improved by 460 basis points year-over-year, largely due to higher pricing, favorable commodity costs, and productivity savings.
- The operating margin for P&G, including Gillette, increased by 240 basis points year-over-year, highlighting effective cost management and operational efficiencies.
- The increase in gross profit for P&G included a 330 basis point benefit from increased pricing and a 160 basis point benefit from favorable commodity costs.
- Gillette India declared an interim dividend of 85 rupees per share for the financial year 2023-24, which included a one-time special dividend of 40 rupees per share.
- Gillette, part of Procter & Gamble (P&G), allocated over USD 100 million for advertising in digital, print, and national TV.
You May Also Like To Read
General Gillette Statistics
- As of June 14, 2024, the market capitalization (total market value) of Gillette India is estimated to be around ₹25,348 crore (roughly USD 3.2 billion).
- Gillette holds a dominant position in the global razor market share, with estimates suggesting it holds around 70%. This means for every ten razors sold worldwide, seven are likely to be Gillette!
- While global figures are limited, some information is available for Gillette India. Their stock price experiences fluctuations, with a 52-week high of USD 7,999 and a low of USD 4,460 (as of June 14, 2024).
- Compared to its book value (a measure of net assets), Gillette India’s stock is currently trading at a relatively high price-to-book ratio (P/E ratio) of 65.46.
- In 2023, the Gillette Series was the second most well-known male cosmetic brand in the United Kingdom, with 90% brand awareness.
- Meanwhile, Gillette remained the fifth most popular brand, and 82% of online consumers in the United States recognized it.
Gillette Historical Revenue
- Gillette’s peak revenue was USD 82.0 billion in 2012.
- The peak quarterly revenue was USD 22.2 billion in Q2 2013.
- Gillette’s revenue increased from USD 56.7 billion in 2005 to USD 82.0 billion in 2023, reflecting a 44.53% change in annual revenue.
| Fiscal Year / Year | Gillette Revenue |
| 2009 | $76.7B |
| 2010 | $77.6B |
| 2011 | $81.1B |
| 2012 | $82.0B |
| 2013 | $80.1B |
| 2014 | $74.4B |
| 2015 | $70.7B |
| 2016 | $65.3B |
| 2017 | $65.1B |
| 2018 | $66.8B |
| 2019 | $67.7B |
| 2020 | $71.0B |
| 2021 | $76.1B |
| 2022 | $80.2B |
| 2023 | $82.0B |
Gillette Annual Growth
- The highest annual revenue growth was 20.23% in 2006.
- The lowest annual revenue growth was -7.7% in 2016.
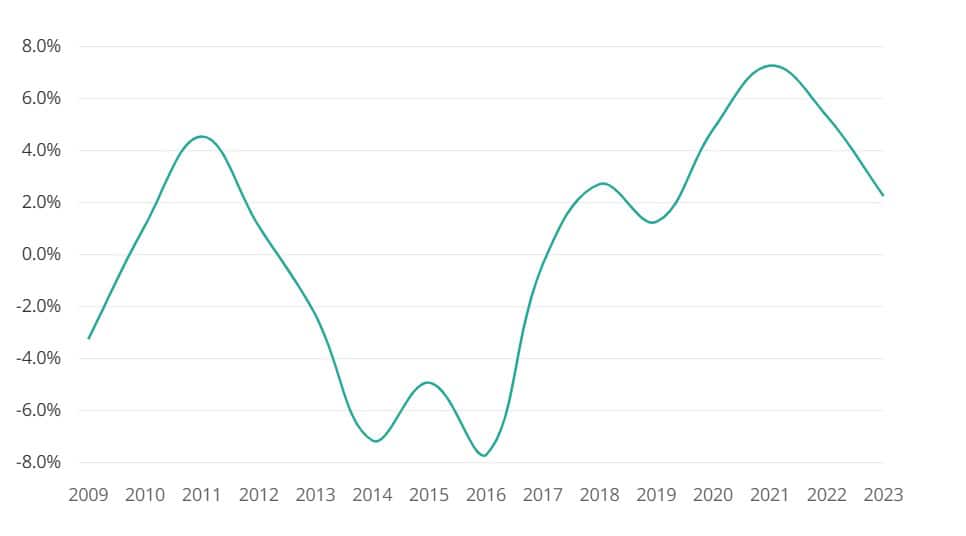
Gillette Annual Revenue Over Time
|
Year |
Gillette Growth |
| 2009 | -3%↓ |
| 2010 |
1%↑ |
| 2011 | 5%↑ |
| 2012 |
1%↑ |
| 2013 | -2%↓ |
| 2014 |
-7%↓ |
| 2015 | -5%↓ |
| 2016 |
-8%↓ |
| 2017 | -0%↓ |
| 2018 |
3%↑ |
| 2019 | 1%↑ |
| 2020 |
5%↑ |
| 2021 | 7%↑ |
| 2022 |
5%↑ |
| 2023 |
2%↑ |
By Key Financial Results
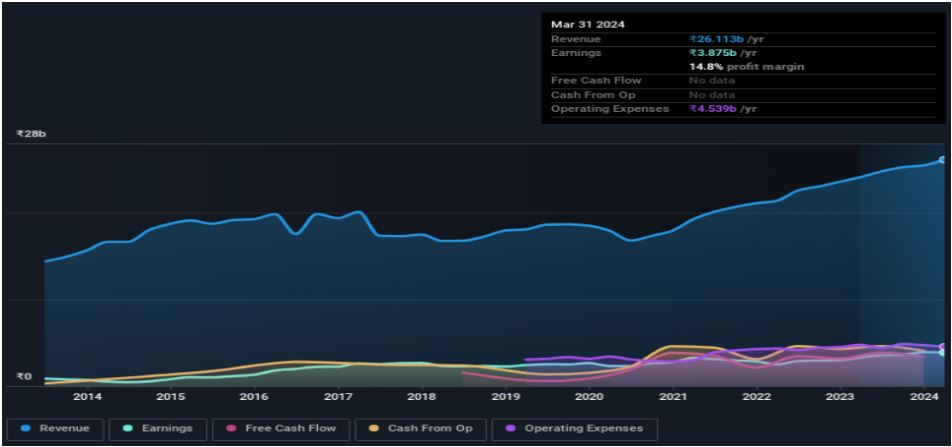
(Source: simplywall.st)
Gillette Statistics further explained that the total revenue generated on March 31, 2024, was ₹26.113 billion (USD 0.31 billion).
Other financial statistics in the Q1, 2024 are mentioned down:
| Details | Information |
| Revenue Contribution | Gillette, part of Procter & Gamble (P&G), contributed significantly to P&G’s total beauty sales, which were reported to be USD 15 billion in 2024 (DemandSage) (Exploding Topics). |
| Market Share | Gillette Statistics also show that the overall U.S. beauty market is valued at approximately USD 50 billion annually, with Gillette’s range of grooming and skincare products being a notable contributor. |
| Product Segments | The global skincare market, which includes products like post-shave balms and moisturizers, is projected to generate USD 161.3 billion in 2024. Skincare accounts for 42% of the beauty market, reflecting its significant share. |
| Consumer Spending | On average, American women spend USD 3,756 per year on beauty products and services, while men spend USD 2,928 annually. |
Gillette Brand Value
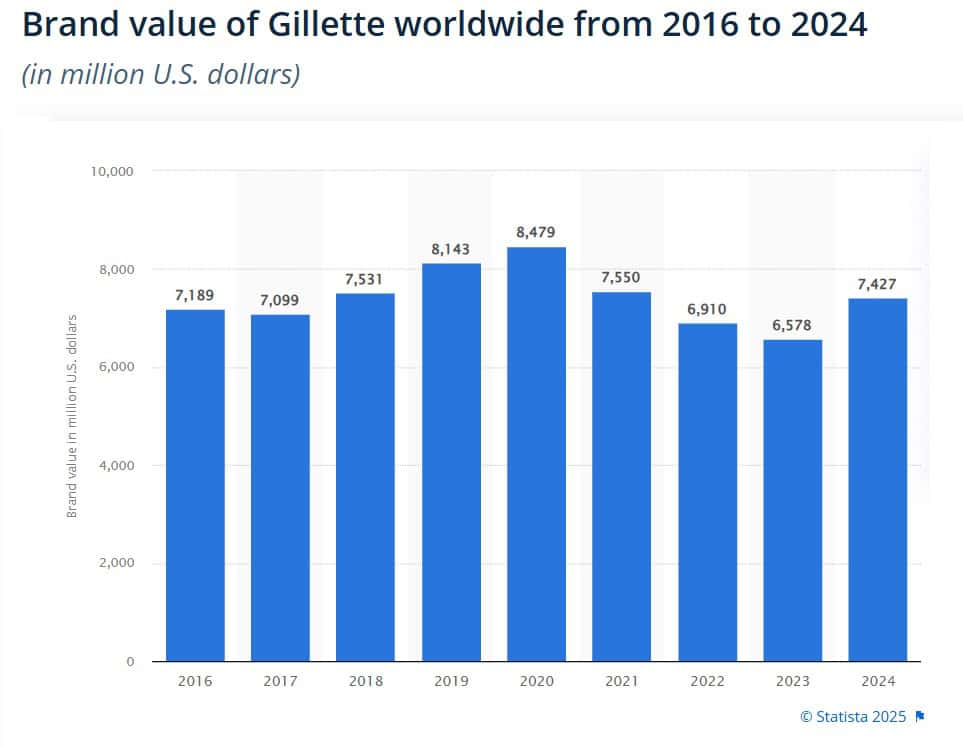
- In 2024, Gillette’s brand value was approximately USD 7.4 billion, increasing from previous years.
- In 2021, Gillette’s brand valuation was around USD 7.55 billion.
- Gillette is a leading brand in the shaving industry, known for its safety razors and shaving supplies.
- Originally owned by The Gillette Company, it became part of Procter & Gamble in 2005.
- Founded in 1901, Gillette has a long history and is widely recognized by consumers in many countries.
- In addition to razors and shaving creams, Gillette’s deodorants are also popular among consumers.
- A significant number of households purchase and use Gillette products, making it one of the top personal care brands worldwide.
- Procter & Gamble is one of the largest consumer goods companies globally, offering a wide range of products, including cosmetics, home care, and laundry supplies.
- The fabric and home care segment is Procter & Gamble’s most profitable business segment, generating over 27 billion USD in net sales in 2022.
- Procter & Gamble’s well-known brands include Ariel, Tide, Head & Shoulders, Herbal Essences, and Old Spice.
- In 2022, Procter & Gamble recorded global net sales of slightly over 80 billion USD, showing an increase from previous years.
Gillette Advertising Cost Statistics
- As per Gillette Statistics 2024, Gillette, part of Procter & Gamble (P& G), allocated over
$100 million for advertising in digital, print, and national TV. - This spend covers campaigns across more than 250 media properties, highlighting the brand’s extensive reach (MediaRadar) (Marketing Week).
- Global Advertising Budget: In 2024, Gillette is reviewing its advertising spend, which has
historically been substantial. For instance, past campaigns have involved budgets as high as $600 million globally.
Gillette Demographics Statistics
- A report published by Zippia states that to date, approximately 101,000 employees are available in the company globally.
- Besides, the average annual salary of each employee is around USD 71,618.
- Gillette Statistics also show that male users dominate the industry, with a share of 59.1%, and female users, with a share of 40.9%.
- The most common ethnicity at Gillette is 65.4% of White people, followed by Hispanic or Latino (14.2%), Asian (8.8%), Black or African American (8.3%), and Unknown (3.3%).
- Almost 30% of employees have been with the company for just 1 to 2 years, and 16% have been employed for more than 11 years.
- 56.6% of Gillette employees are most likely to be members of the democratic party.
Gillette Brand Profile Among Shaver And Razor Users
- Gillette Statistics 2023, Gillette was the shaver & razor brand in the United States, capturing the highest loyalty share of 90% among male consumers and brand awareness of 91%.
- Based on popularity, 54% of the nation’s consumers claimed that they liked using the brand.
- Around 49% of shaver and razor users in the U.S. are using this brand.
- On the other hand, 43% of users are likely to use Gillette’s shaver and razors again.
- In September 2023, around 36% of U.S. consumers had heard about the brand via social media and advertising sites.
Gillette Razor Usage Frequency Statistics
Based on the available data of Gillette Statistics 2024, here are the key numeric statistics regarding the usage frequency of Gillette razors in the United States of America:
| Products | Number of users (million) | Usage |
| Gillette Mach 3 Non-Disposable Razor Blades | 6.24 | Five or more times per week |
| Gillette Sensor Disposable Razors | 2.46 | (same as above) |
| Gillette Venus Embrace Disposable Razors | 1.65 | (same as above) |
- Gillette Statistics 2024, Gillette has an approximate 54% market share in the U.S. razor market.
- Cartridge razors contributed over 40% of the market share, with a revenue of around USD 1.2 billion.
- The mass category, which includes disposable, straight, and Safety razors, accounts for about 50% of the market share.
- In the UK, Gillette held a substantial share of the shaving and hair removal market, accounting for 73% of retail value sales of razors and blades. This was driven by consistent innovation and strong brand loyalty (Mintel Store).
- Gillette India’s revenue from operations rose by 3.4% for the quarter ending December 31, 2023, contributing significantly to the overall performance.
By Product Launch
| Products | Launch Date | Price | Details |
| GilletteLabs with Exfoliating Bar | Early 2024 | USD 24.99 for the razor handle and two-cartridge pack, and USD 34.99 for the premium kit with additional features (P.G. News). |
|
| Gillette Labs Super-Premium Razor | February 2024 | INR 1499 (approximately USD 18.3) (BMI). |
|
| Gillette Gaming Initiative | Early 2024 | – |
|
The Most Valuable Cosmetics Brands Statistics
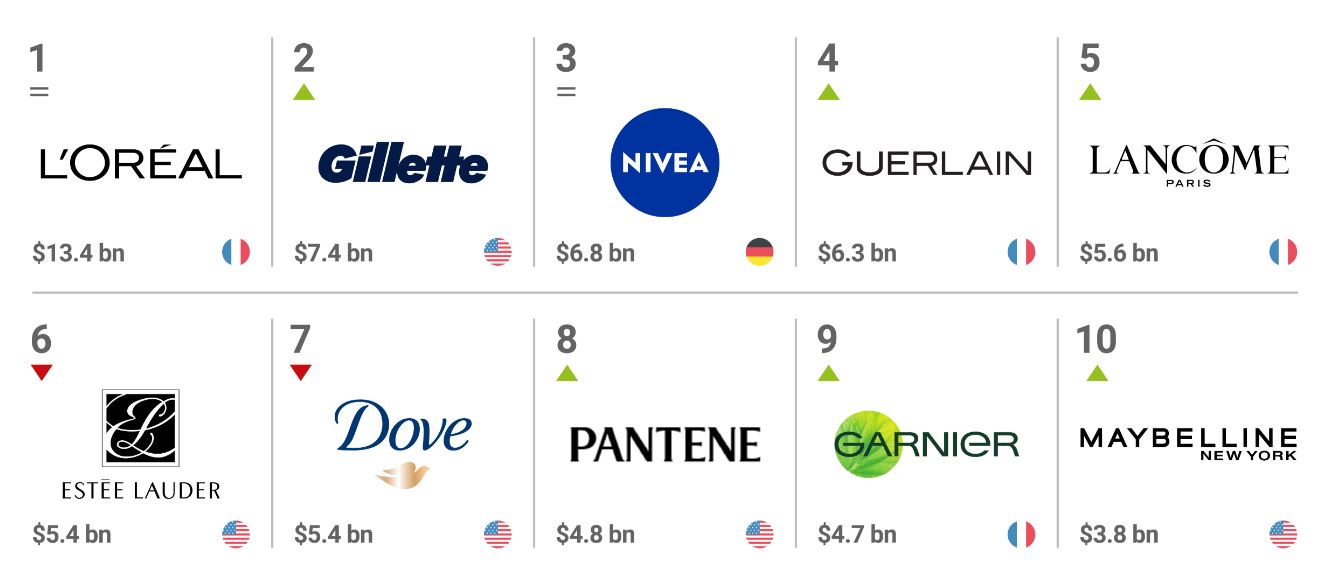 (Source: brandfinance.com)
- Gillette is the second-most valuable brand worldwide, and its valuation is estimated to be USD 7.4 billion by 2024.
- Meanwhile, Gillette’s brand value change increased by 13% between 2023 and 2024.
- During the same duration, the total sustainable perception value is around USD 557 million.
Other brand valuations in 2024 are described below:
| Brands | Valuation (USD billion) |
| L’Oreal | 13.4 |
| Nivea | 6.8 |
| Guerlain | 6.3 |
| Lancome | 5.6 |
| Estee Lauder | 5.4 |
| Dove | 5.4 |
| Pantene | 4.8 |
| Garnier | 4.7 |
| Maybelline | 3.8 |
You May Also Like To Read
- Ralph Lauren Statistics
- The North Face Statistics
- Nike Statistics
- Nikon Statistics
- Canon Statistics
- Adidas Statistics
Gillette’s Website Traffic Statistics By Country
 (Reference: similarweb.com)
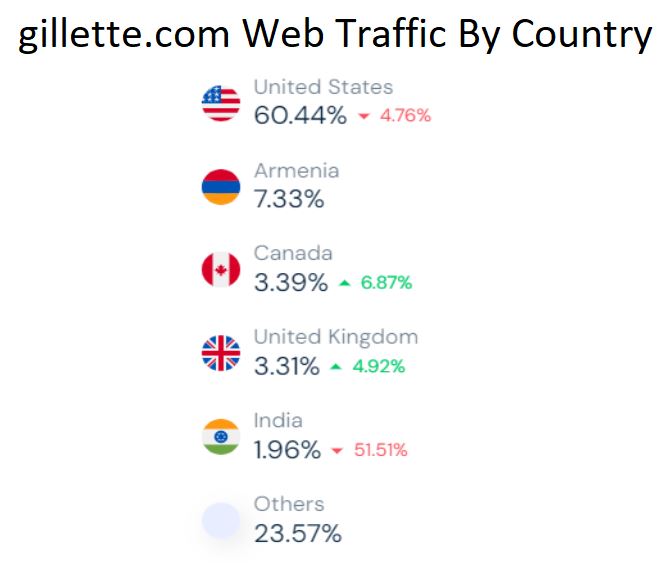
- As explained by Gillette Statistics, total website visits were 787.7K in May 2024, an increase of 33.33% from last month, with a bounce rate of 64.71%.
- The United States of America had 60.44% of total traffic on gillette.com, reduced by 4.76%.
- During the same duration, other countries recorded the following contribution in total traffic: Armenia = 7.33%, Canada = 3.39% (+6.87%), United Kingdom = 3.31% (+4.92%), and India = 1.96% (-51.51%).
- Other countries collectively made around 23.57% of visitor share in gillette.com.
By Demographics
 (Reference: similarweb.com)
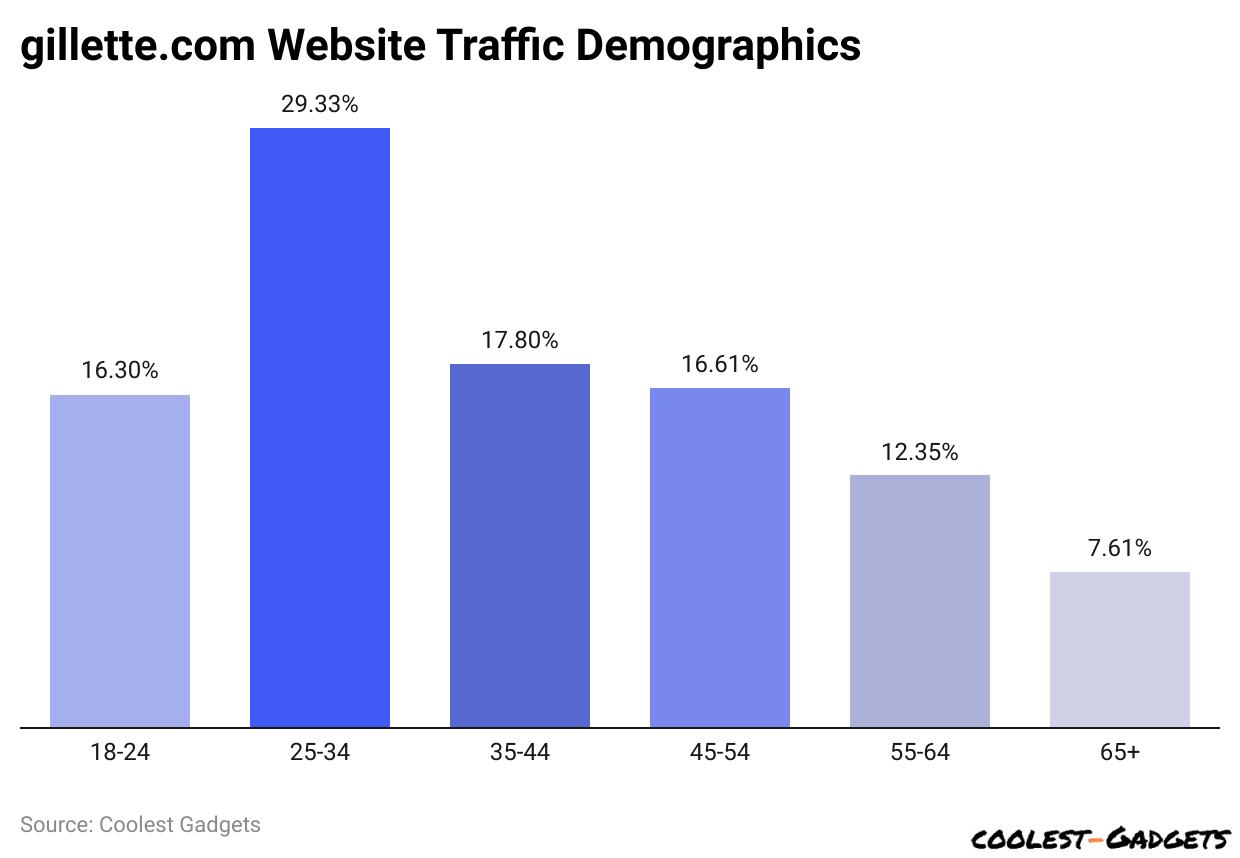
- In May 2024, male and female users of gillette.com were 60.23% and 39.77%, respectively.
- Gillette Statistics by age group states that the highest number of website users observed is between 25 and 34 years old, resulting in 29.33%.
- 17.8% of Gillette’s website users are aged 35 to 44 years.
- 16.61% and 16.3% belong to 45 to 54 years and 18 to 24 years, individually.
- Around 12.35% of website users are aged from 55 to 64 years.
- Nearly 7.61% of user shares of gillette.com contributed from the age group above 65 years.
By Traffic Sources
 (Reference: similarweb.com)
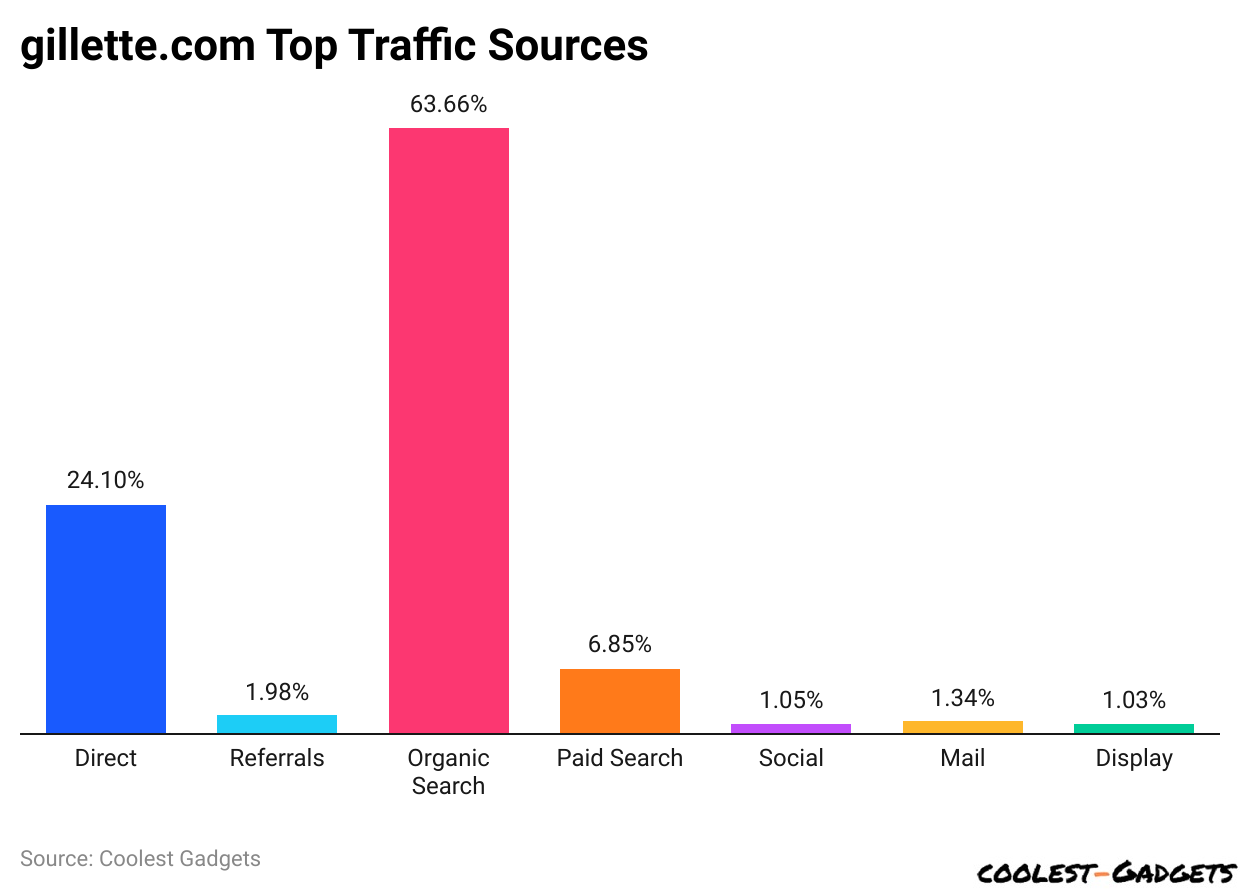
- As per Gillette Statistics, the highest traffic rate towards gillette.com was accounted for by organic search, resulting in 63.66%.
- Almost 24.1% of the share is generated by direct traffic searches, while 6.85% is from paid searches on gillette.com.
- Furthermore, the website’s other traffic sources are referrals (1.98%), social searches (1.05%), Mail (1.34%), and display (1.03%).
By Social Media Referral Statistics
 (Reference: similarweb.com)
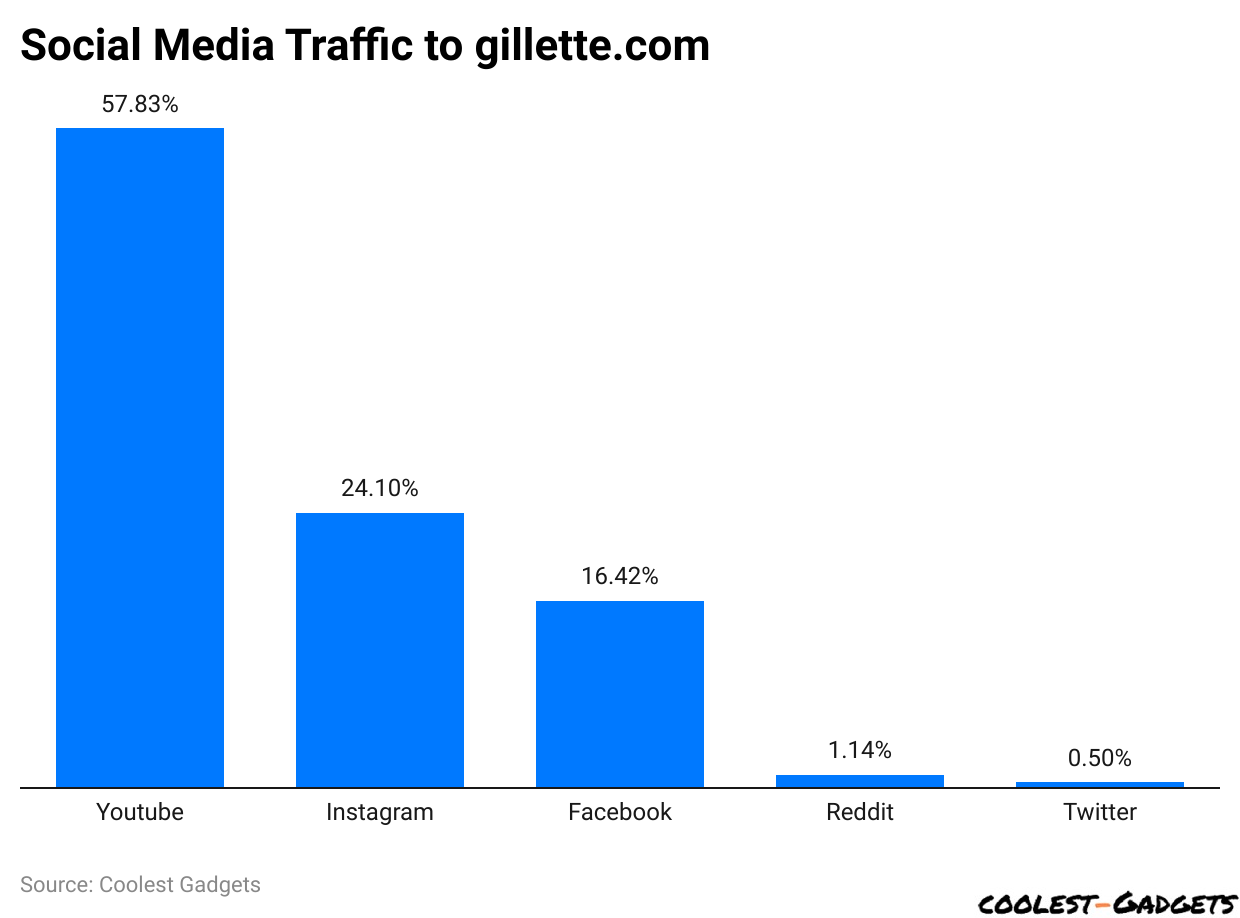
- Gillette Statistics further states that YouTube accounted for the highest social media referral rate, with a 57.83% share compared to other social networks.
- Instagram and Facebook each contributed a share of 24.1% and 16.42% on gillette.com.
- Meanwhile, traffic sent by Reddit is 1.14%, and Twitter contributes 0.5%.
By Devices
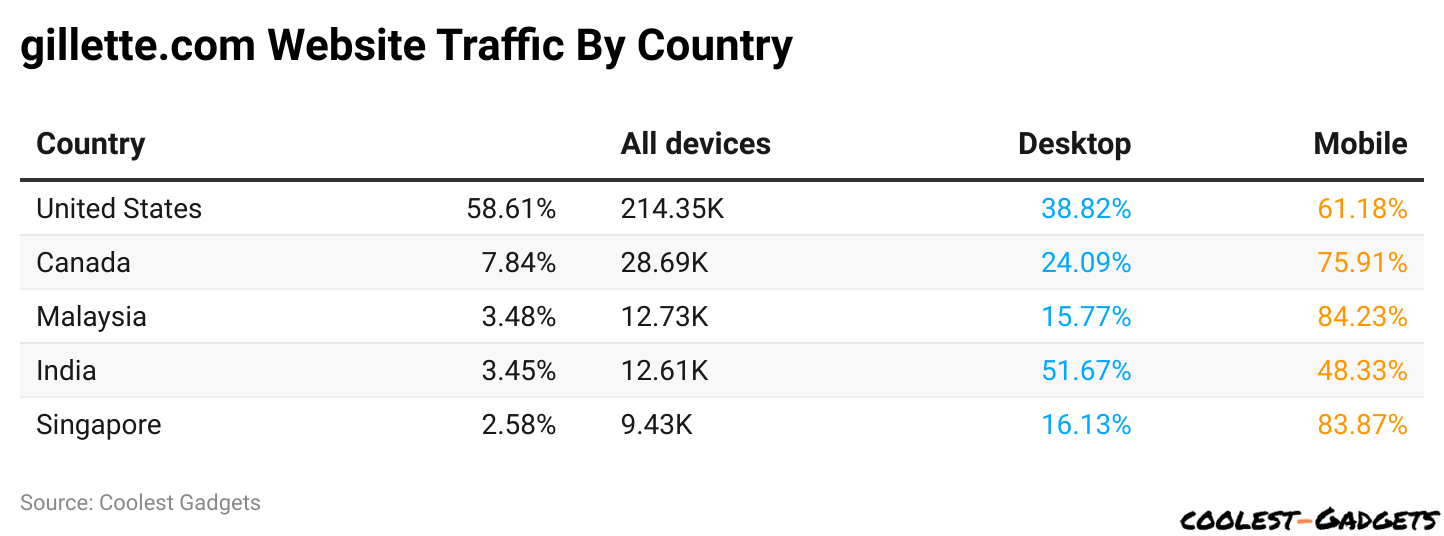 (Reference: semrush.com)
- Based on Gillette Statistics, the total traffic share from desktop and mobile on gillette.com is 35.87% and 64.13% visits, respectively, in May 2024.
- The United States of America has 214.35 thousand users; 58.61% out of these, 38.82% share on desktop, and 61.18% share on mobile devices.
- Of the total, Gillette users share around 7.84% in Canada, resulting in 28.69K, with 24.09% access to the desktop version and 75.91% to mobile devices.
- In Malaysia, the Gillette website had 12.73K users and 3.48% website traffic, with desktop and mobile users being 15.77% and 84.23%, respectively.
- India and Singapore each have around 12.61K and 9.34K users, respectively, and their website traffic is around 3.45% and 2.58%.
- Besides, 51.67% of desktop and 48.33% of mobile users in India accessed the Gillette website. In Singapore, 16.13% of users access it on desktops, and 83.87% access it on mobile devices.
Conclusion
Gillette’s Statistics paint a picture of a well-established brand with a dominant market presence. Their commitment to innovation and responsiveness to consumer needs has been key to their success.
As the shaving landscape evolves, it will be interesting to see how Gillette continues to adapt and maintain its position as a leader in the industry.
Sources
Joseph D'Souza started Coolest Gadgets in 2005 to share his love for tech gadgets. It has since become a popular tech blog, famous for detailed gadget's reviews and companies statistics. Joseph is committed to providing clear, well-researched content, making tech easy to understand for everyone. Coolest Gadgets is a trusted source for tech news, loved by both tech fans and beginners.