The North Face Statistics By Regional Revenue, Direct-to-Consumer Operations, Product Performance, Customer Reviews And Country

Updated · Mar 18, 2025


TABLE OF CONTENTS
- Introduction
- Editor’s Choice
- By Regional Revenue
- By Direct-to-Consumer Operations
- Outdoor Revenue Statistics
- Segmental Profits Statistics of the VF Corporation
- By Product Performance
- The North Face Brand Profile in the United States 2024
- By Customer Reviews
- The North Face’s Google Shopping Campaigns Statistics
- The North Face Products Statistics By Average Price
- Latest Products of The North Face, 2024
- The North Face Website Traffic Statistics By Country
- Conclusion
Introduction
The North Face Statistics: The North Face is a renowned American outdoor product company that specializes in high-performance apparel, outerwear, sportswear, and footwear for men, women, and children. Founded in 1966 by Douglas Tompkins and his then-wife Susie Tompkins Buell, the company began as a small retail store in San Francisco that catered to hiking and camping enthusiasts. The name “The North Face” refers to the colder, more challenging face of a mountain, symbolizing the brand’s commitment to providing gear for serious outdoor adventurers.
This article includes several current trends and analyses of the global market from different perspectives. But how big is The North Face? Who are its typical customers? Let’s examine some interesting statistics to understand this iconic brand better.
Editor’s Choice
- The North Face Statistics reported revenue of $3.6 billion for the fiscal year ending March 2024, a 17% increase from the previous year.
- In the fourth quarter of 2023 alone, the brand saw revenues of USD 859.5 million, a 16% growth in constant currency.
- In Q1 of 2024, the American region captured the highest revenue globally in The North Face, resulting in USD 1.70 billion.
- The North Face achieved its 10th consecutive quarter of double-digit revenue growth in constant dollars, with a 12% increase.
- The North Face markets its products globally through various channels, including specialty outdoor and premium sporting goods stores, department stores, independent distributors, partnership stores, concession retail stores, about 260 VF-operated stores, and online via strategic digital partners and their website.
- VF Corporation operated 1,185 direct-to-consumer stores globally by the end of 2024.
- The total website visits of thenorthface.com in May 2024 were 5.6 million, an increase of 37.38% from last month’s, and secured a 43.04% bounce rate.
- In 2000, VF Corporation acquired The North Face.
- The North Face Statistics further states that the company enjoys a high customer loyalty score, particularly in the Fashion and Beauty industry, where it ranks at 70%.
- For nearly five decades, the market has been transforming outdoor equipment and motivating a worldwide community of explorers.
You May Also Like To Read
By Regional Revenue
- In the first quarter of 2024, the American region captured the highest revenue globally in The North Face, resulting in USD 1.70 billion, slightly decreased from last year’s quarter.
- The company has experienced a 2% increase in global revenues for Fiscal 2024, which includes a 1% boost due to favorable foreign currency effects.
On the other hand, other regional revenue comparisons between 2024 and 2023 are detailed below:
| Region | Year Ended March 2024 (USD million) | Year Ended March 2023 (USD million) |
|
Americas |
1,704.4 | 1,896.4 |
| Europe | 1,312.5 |
1,198.7 |
|
Asia Pacific |
656.4 | 517.6 |
| Global | 3,673.3 |
3,612.7 |
(Source: cloudfront.net)
By Regional Revenue Growth
- The growth for the year ending March 2024 was largely driven by a 35% increase in the Asia-Pacific region despite a 4% negative impact from unfavorable foreign currency exchange rates.
- During the same duration, The North Face’s revenue growth in the Americas and Europe increased by 24% and 4%, respectively.
(Reference: statista.com)
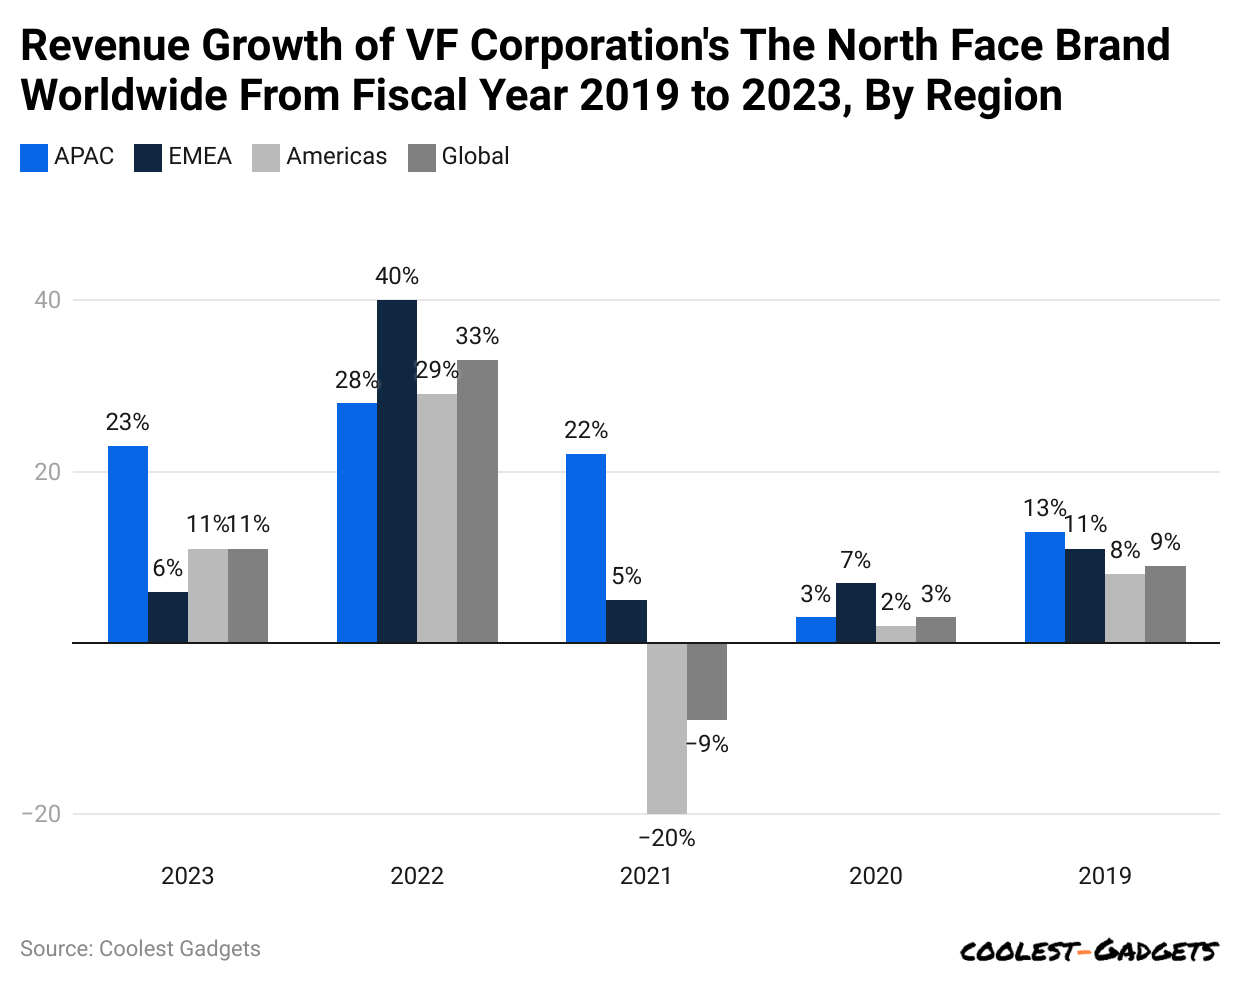
- The North Face Statistics: in the fiscal year ending April 2023, VF Corporation reported a 23% increase in revenues for The North Face brand in the Asia Pacific region, demonstrating significant growth compared to the previous year.
- Other regions’ sales growth includes the Americas, with 11%; Europe, the Middle East, and Africa (6%); and worldwide (11%).
Furthermore, other regional sales growth of The North Face from 2019 to 2022 is detailed in the table below:
|
Year |
APAC | EMEA | Americas |
Global |
|
2019 |
13% | 11% | 8% | 9% |
| 2020 | 3% | 7% | 2% |
3% |
|
2021 |
22% | 5% | -20% | -9% |
| 2022 | 28% | 40% | 29% |
33% |
By Direct-to-Consumer Operations
- VF Corporation operated 1,185 direct-to-consumer stores globally by the end of 2024. These retail locations included brands such as Vans, The North Face, Timberland, Kipling, Icebreaker, Napapijri, Supreme, and Dickies.
- About 65% of our stores are in the Americas, 57% in the US, 25% in Europe, and 10% in the Asia-Pacific region. Additionally, we operate around 840 concession retail stores, mainly in Europe and Asia, selling certain branded products.
- By the end of 2024, e-commerce accounted for about 42% of our direct-to-consumer sales and 20% of the total revenue for VF Corporation.
- The North Face Statistics 2024 shows that DTC sales increased by 19%, driven by strong growth online and in stores.
- Additionally, global wholesale sales grew by 14% in constant currency.
Outdoor Revenue Statistics
- The table below includes Outdoor segmental analyses for brands like The North Face, Timberland, Smartwool, Altra, and Icebreaker.
The fiscal year ending in March 2024 is compared to the fiscal year ending in March 2023.
| (USD million) | 2023 | 2024 | Growth Rate |
|
Total Revenue |
5,647.5 | 5,501.4 | 2.6% |
| Profit | 785.4 | 602.7 |
23.3% |
|
Operating Margin |
13.9 % | 11.0 % |
– |
(Source: cloudfront.ne)
Segmental Profits Statistics of the VF Corporation
 (Reference: statista.com)
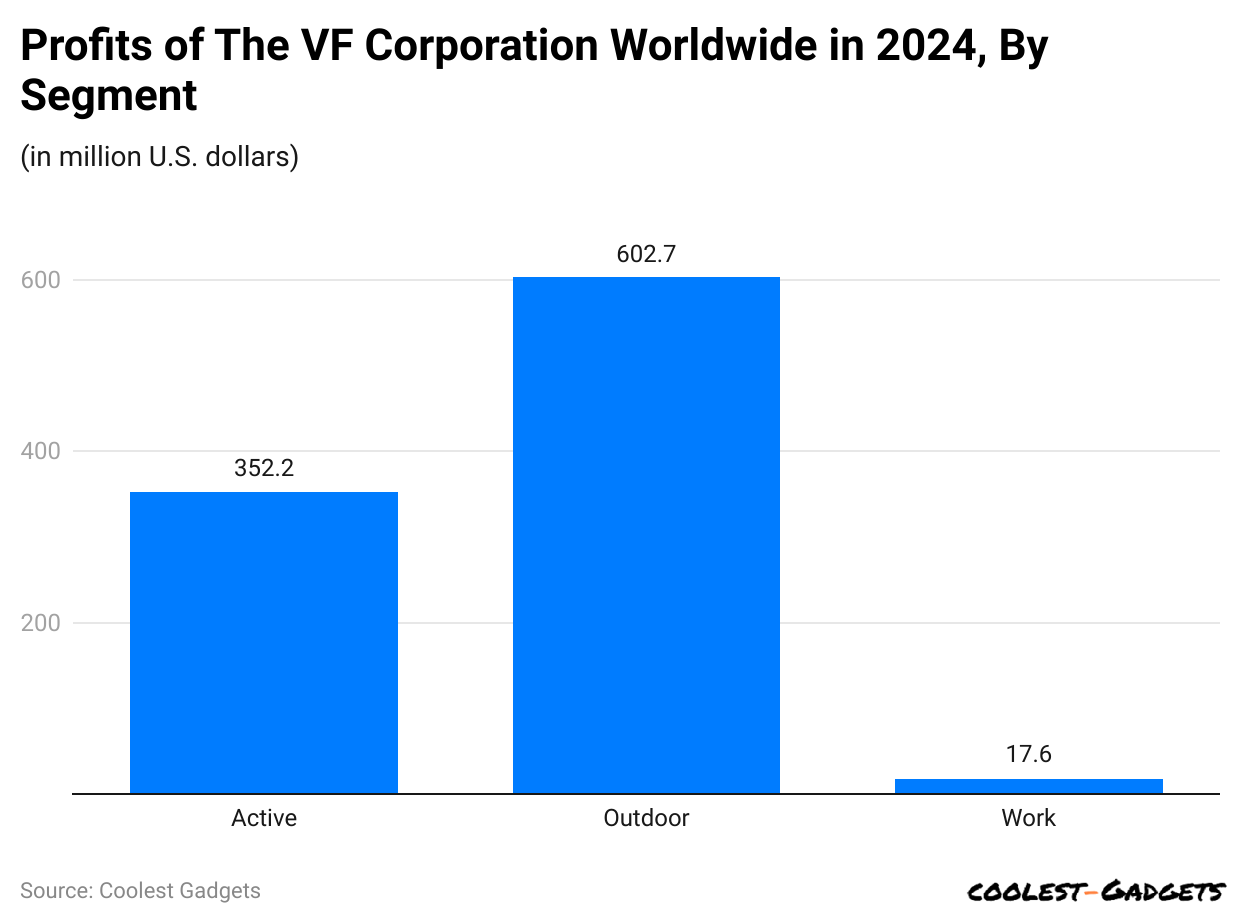
- A report published by Statista states that in 2024, VF Corporation’s outdoor segment will generate the highest global profit globally, with around USD 602.7 million in global profits.
- Meanwhile, the active segment will secure the second position, resulting in USD 352.2 million, followed by the work segment around USD 17.6 million.
By Product Performance
- The snow sports category, particularly the Nuptse Jacket, showed significant momentum in Q4 2023.
- The Vectiv footwear line also performed well, earning 120 race-day podiums and 85 wins.
- The XPLR PASS, global loyalty membership, grew by over one million new members, totaling 18.5 million by the end of Q4.
The North Face Brand Profile in the United States 2024
| Brand Awareness | Usage | Popularity | Loyalty |
Buzz |
|
The North Face statistics state that about 89% of outdoor fashion consumers in the US recognize The North Face. |
Overall, 57% of American consumers own products from The North Face. Of the 89% who are aware of the brand, 64% own their products. | Among US outdoor, 64% of fashion owners express a liking for The North Face. However, this percentage is higher among those familiar with the brand: of the 89% who know The North Face, 72% have a favorable opinion of it. | Approximately 52% of owners in the United States indicate they are likely to purchase The North Face products again. As of March 2024, 57% of these consumers currently use the brand, which reflects a 91% loyalty rate among its users. |
Around 37% of US fashion owners reported seeing The North Face in media or advertising in the past three months. Among the 89% who recognize the brand, this constitutes 42%, indicating a notable level of buzz surrounding The North Face. |
(Source: statista.com)
By Customer Reviews
| Age Group (years) | Product Quality Rating |
| 18-25 | 4.2 out of 5 |
| 26-35 | 3.8 to 3.9 out of 5 |
| 36-45 | 3.3 to 3.4 out of 5 |
| 46-55 | 2.5 to 3.0 out of 5 |
(Source: comparably.com)
The North Face’s Google Shopping Campaigns Statistics
| Revenue Increase | Average Order Value (AOV) | Return on Ad Spend (ROAS) | Cost and Performance | Device Performance |
|
The North Face experienced a 163% increase in revenue from its Google Shopping campaigns. |
The campaigns also resulted in a 20% higher AOV. | The North Face Statistics further represents that the company saw a 16% year-over-year increase in ROAS, highlighting efficiency and profitability. | The cost associated with these campaigns increased by 127%, which corresponds with the significant rise in revenue, suggesting a strong return on investment. |
The revenue share from Google Shopping ads was 48% from desktop users, followed by mobile (42%) and tablets (10%). |
(Source: highstreet.io)
The North Face Products Statistics By Average Price
| Jackets and Outerwear | Backpacks | Footwear | Apparel | Accessories |
|
|
|
|
|
Latest Products of The North Face, 2024
|
Name |
Date | Purpose |
| The North Face x CLOT Collaboration | January 1 |
The Aurora Borealis inspires this collection, which features vibrant colors and cutting-edge technology. Key items include the Aurora Snow Jacket with DRYVENT™ technology and the 2-in-1 Hooded Fleece Top |
|
North Face Transgrancanaria |
February 21-25 | The Canary Guide is an ultra-distance trail race held in Gran Canaria. It features various race categories and attracts participants from around the world. |
| The North Face x Supreme Spring 2024 Collection | February 29 (US.)
March 2 (Japan) |
This collection includes the Taped Seam Shell Jacket, Nuptse Jacket, and various accessories. The Nuptse Jacket features 700-fill-down insulation and a breathable nylon ripstop |
|
Spring/Summer 2024 Collection |
– | Outdoor clothing such as the Men’s Dune Sky Short-Sleeve Crew, Women’s Evolution Shorts, and Men’s Denali Pants is designed to offer both style and functionality for outdoor enthusiasts. |
| New Insulation Technology – Circaloft | – |
This new lightweight and packable synthetic insulation is made from 100% recycled fabrics, emphasizing the brand’s focus on sustainability |
The North Face Website Traffic Statistics By Country
(Source: similarweb.com)
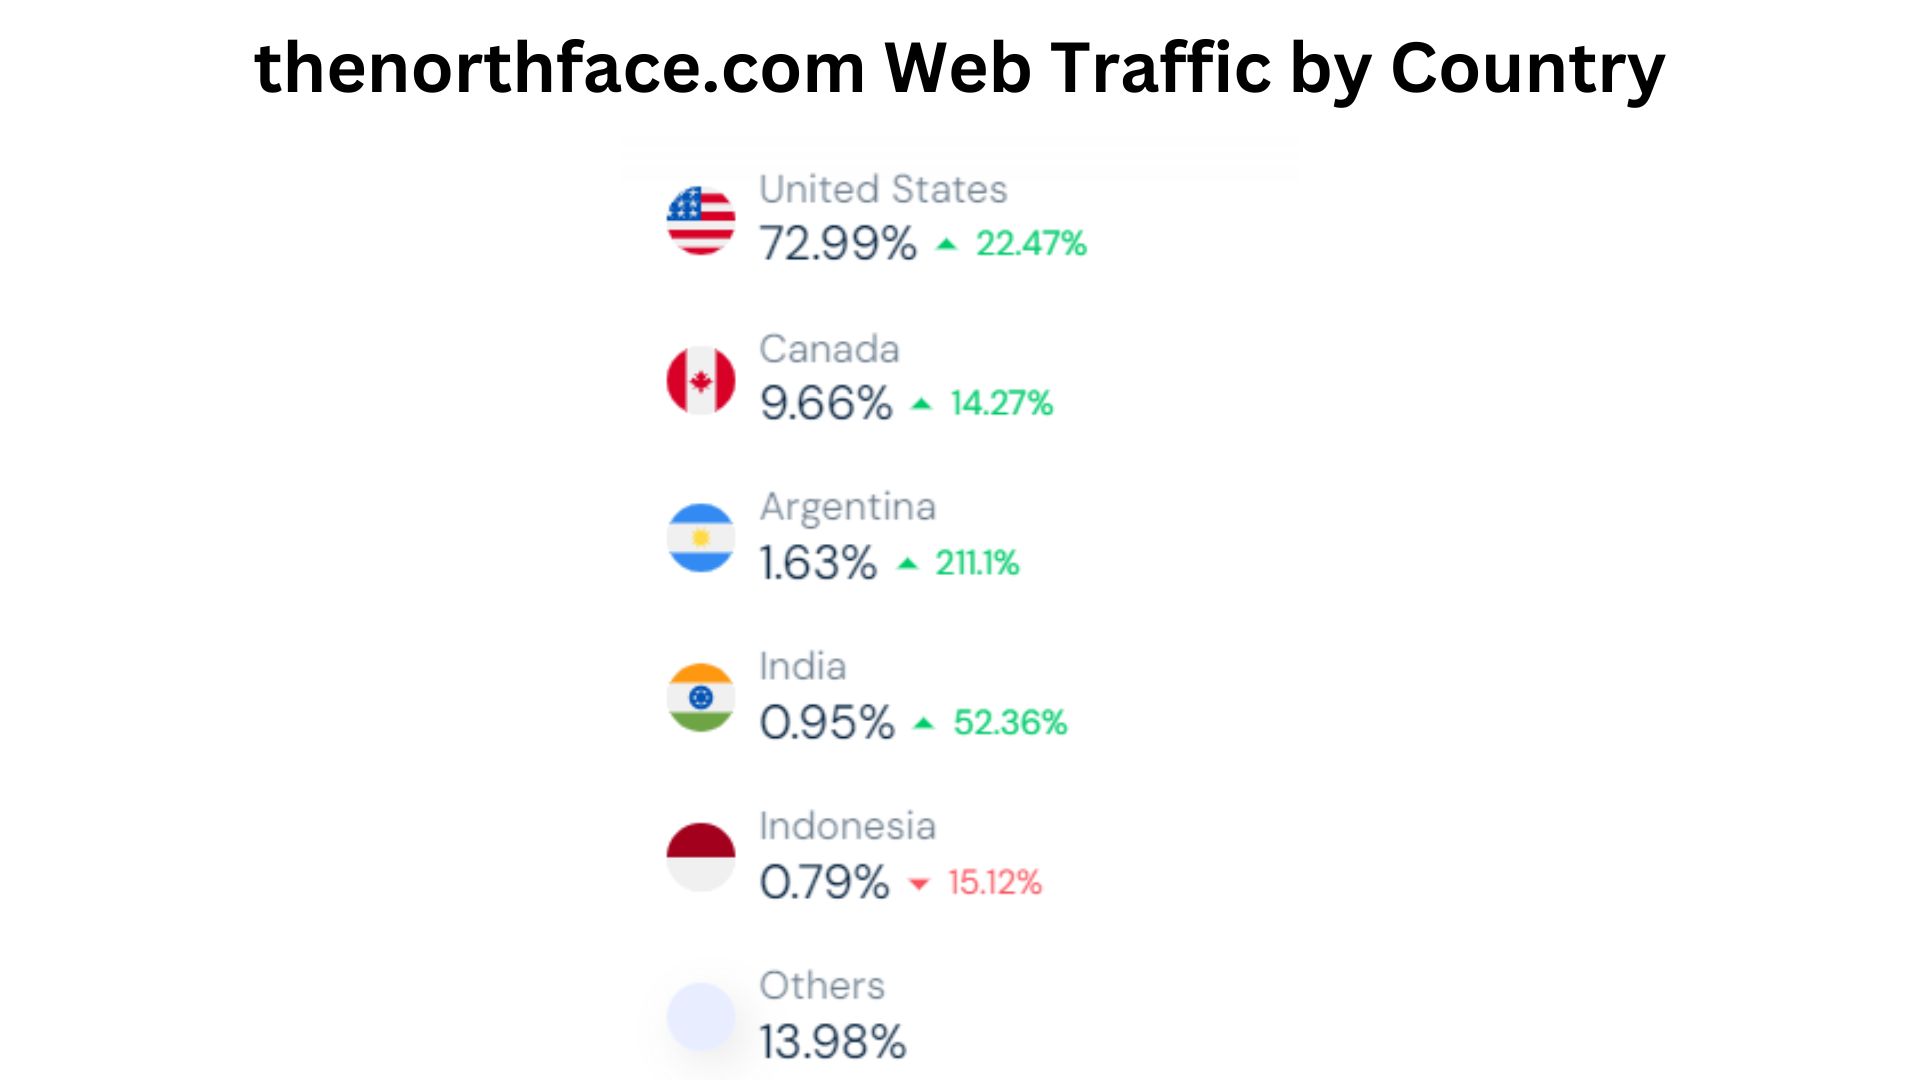
- The North Face Statistics elaborates that the United States of America had 72.99% of the website’s total traffic, up by 22.47%.
- During the same duration, other countries recorded the following contribution in total traffic: Canada = 9.66% (+14.27%), Argentina = 1.63% (+211.1%), India = 0.95% (+52.36%), and Indonesia = 0.79% (-15.12%)
- Other countries collectively made around 13.98% of visitor share in thenorthface.com.
By Demographics
(Reference: similarweb.com)
- In May 2024, male and female users of thenorthface.com were 50.44% and 49.56%, respectively.
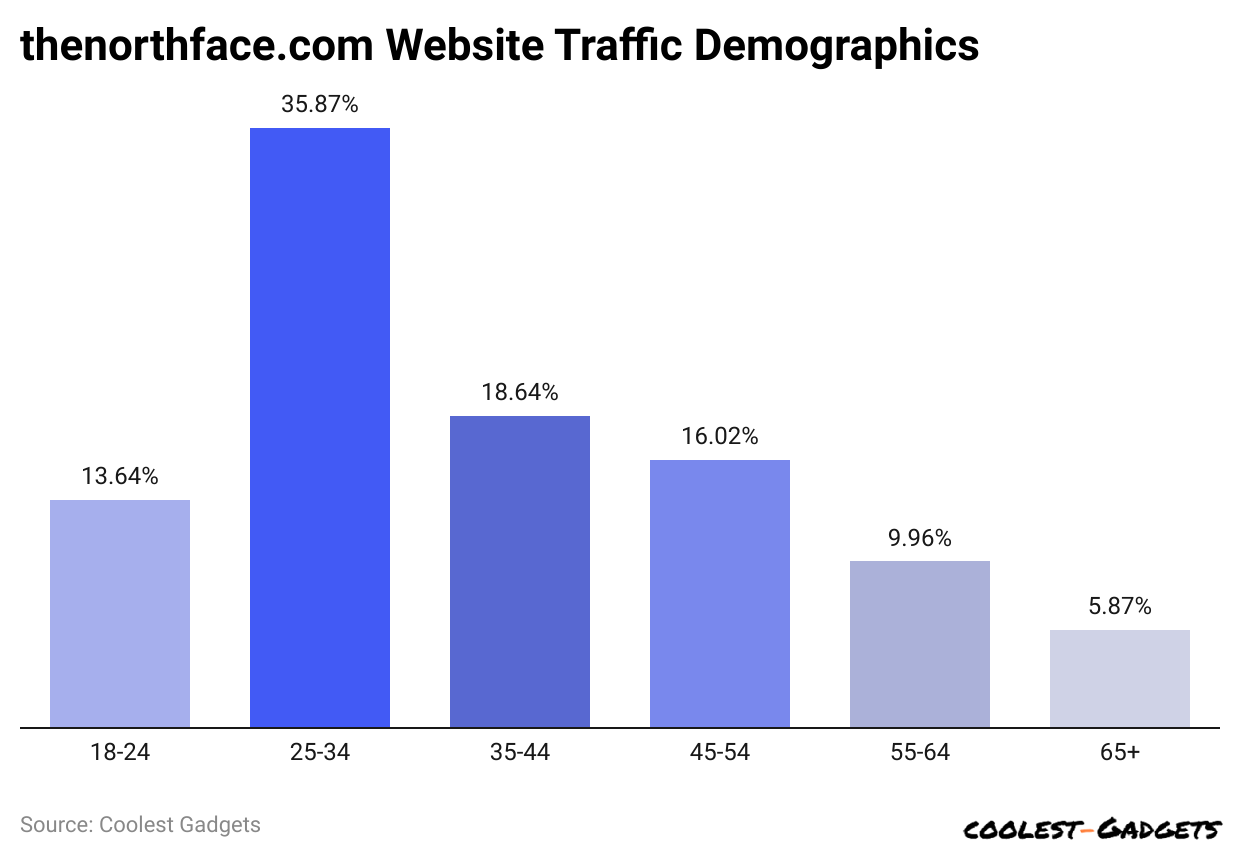
- The North Face Statistics by age group states that the highest number of website users observed is between 25 and 34 years old, resulting in 35.87%.
- 64% of The North Face’s website users are aged 35 to 44 years.
- In contrast, 16.02% and 13.64% belong to individuals aged 45 to 54 and 18 to 24, respectively.
- Around 9.96% of website users are aged from 55 to 64 years.
- Nearly 5.87% of user shares of thenorthface.com contributed from the age group above 65 years.
By Traffic Source
(Reference: similarweb.com)
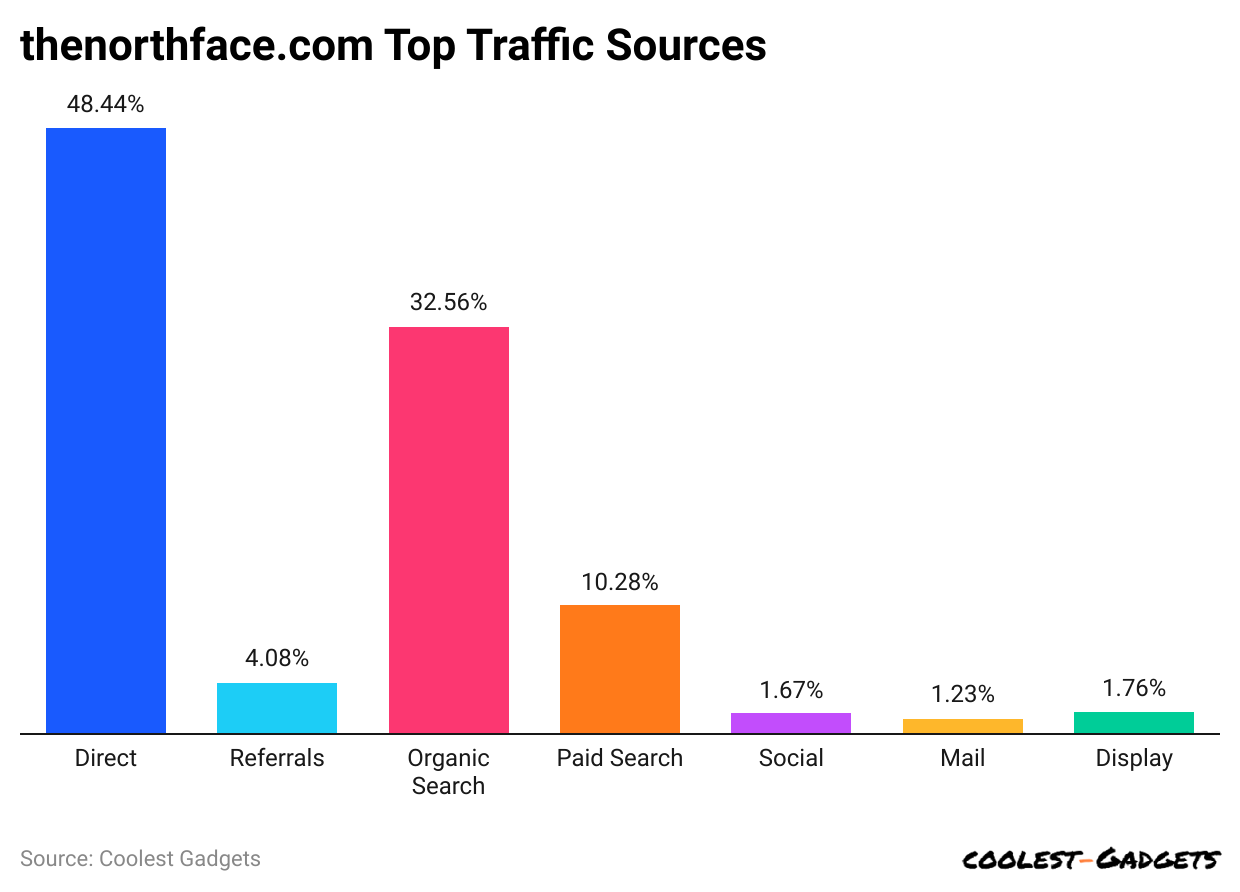
- The North Face Statistics 2024 also shows that direct search generated the highest traffic rate to thenorthface.com, 33.88%.
- Almost 32.56% of the share is generated by organic traffic searches, while 10.28% is from paid searches.
- Furthermore, the website’s other traffic sources are referrals (4.08%), social (1.67%), mail (1.23%), and display (1.76%).
By Social Media Referral Statistics
(Reference: similarweb.com)
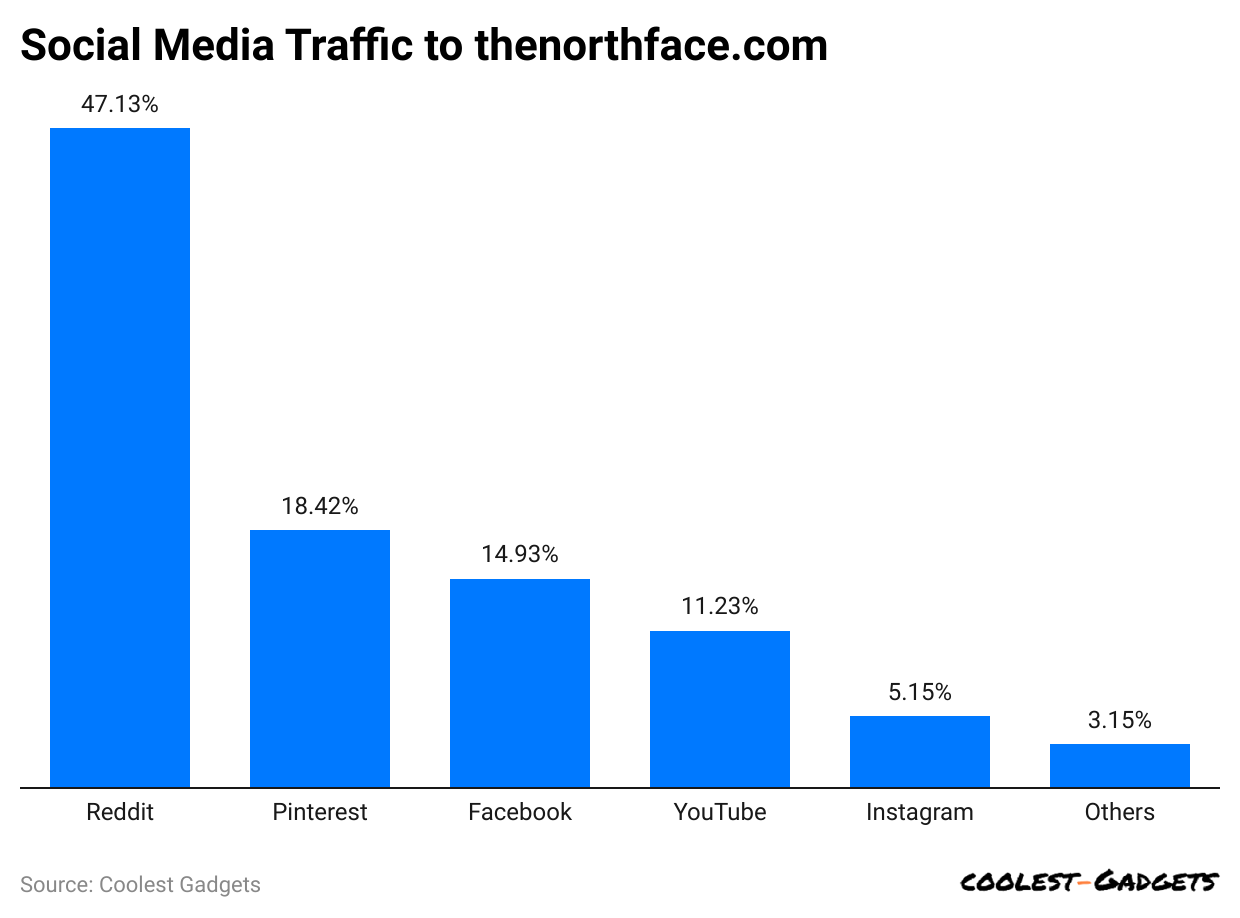
- The North Face Statistics reported that Reddit had the highest social media referral rate, with a 47.13% share compared to other social network traffic.
- Pinterest and Facebook each contributed a share of 18.42% and 14.93% on thenorthface.com.
- Meanwhile, traffic sent by YouTube was 11.23%, and Instagram contributed 5.15%.
- Similarly, the rest of The North Face’s website’s social networks together made up around 3.15% of the traffic share.
By Device
(Reference: semrush.com)
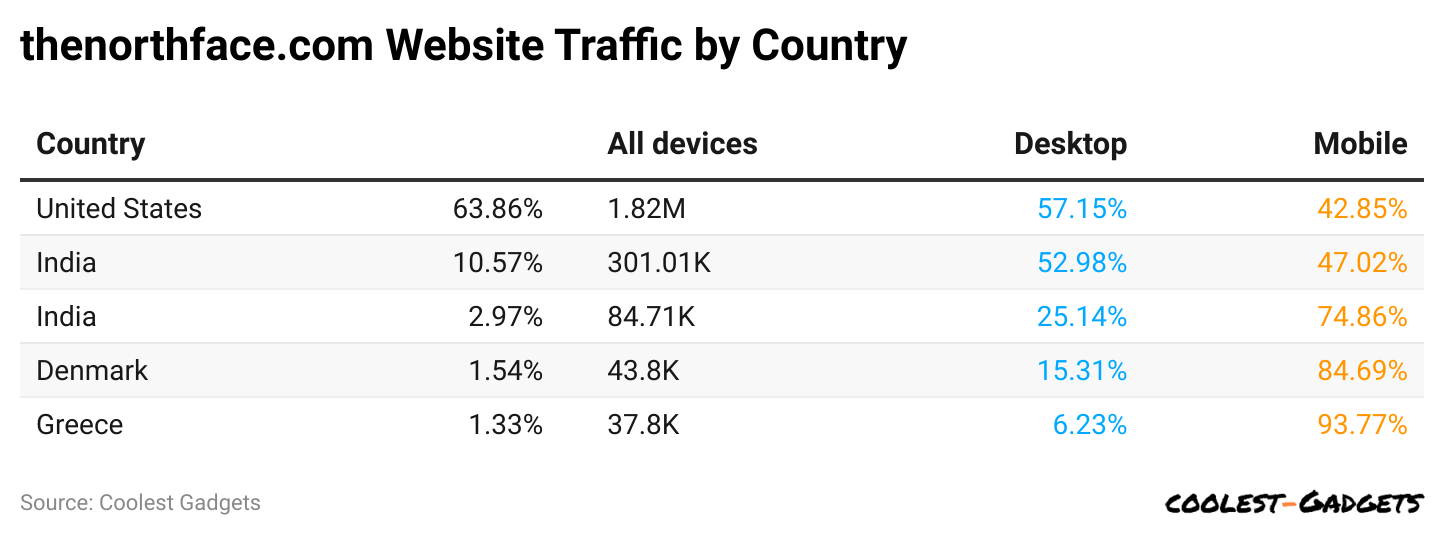
- In May 2024, the United States of America had 1.82 million users on thenorthface.com, with a user share of 63.86%. Meanwhile, around 57.15% of these came via desktop, and 42.85% on mobile devices.
- Website users make up around 10.57% of Canada’s user base, resulting in 301.01K, of which 52.98% have access to the desktop version and 47.02% by mobile devices.
- In India, The North Face’s website had 84.71K users and 2.97% user traffic, with desktop and mobile users being 25.14% and 74.86%, respectively.
- Denmark and Greece each have around 43.8K and 37.81K users, and their website traffic is around 1.54% and 1.33%.
- Besides,15.31% of desktop and 84.69% of mobile users in Denmark accessed thenorthface.com.
- In Greece, around 6.23% of users access the website via desktops, and 93.77% access it through mobile devices.
Conclusion
The North Face is a brand built on a strong foundation of quality, innovation, and a love for the outdoors. Its impressive sales figures and global reach are a testament to its success. But beyond the numbers, The North Face inspires people to get outside and explore while also working to protect the wild places we cherish.
So, the next time you’re planning an outdoor adventure, consider The North Face as your gear partner. They might equip you for your next unforgettable experience.
Joseph D'Souza started Coolest Gadgets in 2005 to share his love for tech gadgets. It has since become a popular tech blog, famous for detailed gadget's reviews and companies statistics. Joseph is committed to providing clear, well-researched content, making tech easy to understand for everyone. Coolest Gadgets is a trusted source for tech news, loved by both tech fans and beginners.