U.S. Death Statistics By Race, Age Group, Demographics, Per Day, Violence and Abuse

Updated · Feb 27, 2025


TABLE OF CONTENTS
- Introduction
- Editor’s Choice
- The U.S. Death Rate Analysis (from 2020 to 2030)
- Shot-to-Death Statistics By Race
- Leading Causes of U.S. Death Statistics
- Gun Deaths Statistics By Age Group
- U.S. Women’s Cancer Death Statistics
- U.S. Men’s Cancer Death Statistics
- U.S. Death Statistics By Demographics
- States with the Highest U.S. Death Rate Statistics
- U.S. Death Statistics By Per Day
- U.S. Overdose Death Statistics
- U.S. Deaths Statistics By Violence And Abuse
- Conclusion
Introduction
U.S. Death Statistics: The death rate in the United States reflects various factors such as health issues, lifestyle changes, and other social factors that impact people’s lives. Life expectancy has generally improved due to advancements in American healthcare, but several causes of death remain significant, including heart disease, cancer, and accidents. The opioid crisis, along with mental health challenges like suicide, also adds to the national death rate.
The COVID-19 pandemic further influenced the death statistics, showing the importance of public health measures. As the population is growing enormously, thus people may pass away from age-related conditions, highlighting the need for better healthcare access and preventive measures to improve overall well-being
Editor’s Choice
- As of 2024, U.S. Death Statistics show that approximately 2,940,209 deaths have been recorded in the U.S. in 2024.
- The death rate is 9.226 per 1,000 population, reflecting a 0.59% increase from the previous year.
- The leading causes of death are Heart Disease (595,016) and Cancer (485,190) deaths.
- Meanwhile, an estimated 108,300 deaths due to drug overdoses have been reported in 2023.
- By the end of 2024, the average life expectancy in the United States is approximately 79.25 years.
- The Infant Mortality Rate is 5.60 deaths per 1,000 live births.
- Similarly, the maternal mortality rate is 23.8 deaths per 100,000 live births.
- COVID-19 has significantly influenced mortality rates, with 49,928 deaths attributed to the virus in 2023.
- U.S. Death Statistics show that the death rate per 1000 people in the United States of America will be 9,226, with an annual growth rate of 0.590%, by the end of 2024.
- As of November 2024, the top two causes of death are heart disease and cancer, accounting for over 40% of all deaths combined.
- Mississippi has the highest death rate in the U.S., with 1,138.7 deaths for every 100,000 people.
The U.S. Death Rate Analysis (from 2020 to 2030)
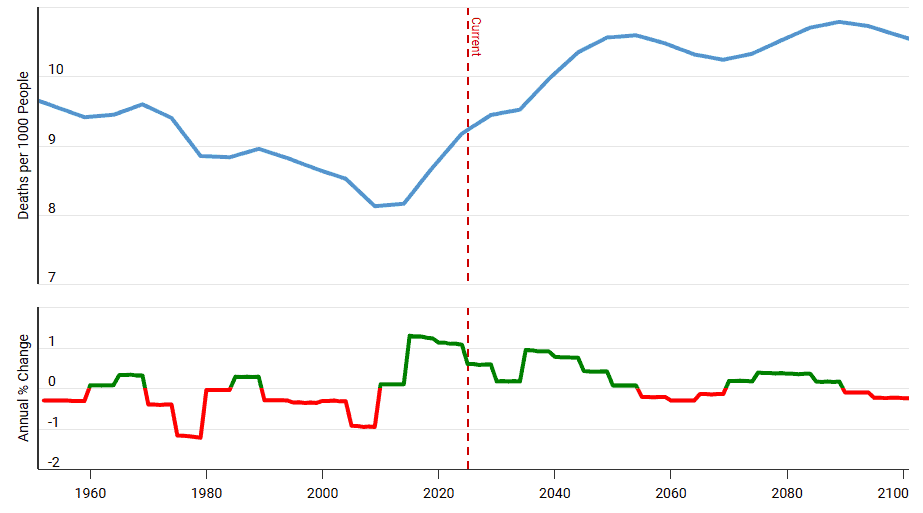
(Source: macrotrends.net)
- The above graph, taken from Macrotrends, shows that by 2024, the death rate per 1000 people in the United States of America will be 9,226, with an annual growth rate of 0.590%.
Furthermore, death analyses of the U.S. in the coming years are represented below:
| Years | Death per 1000 people | Annual growth rate |
| 2025 | 9.280 | 0.590% |
| 2026 | 9.333 | 0.570% |
| 2027 | 9.387 | 0.580% |
| 2028 | 9.441 | 0.580% |
| 2029 | 9.456 | 0.160% |
| 2030 | 9.472 | 0.170% |
Shot-to-Death Statistics By Race
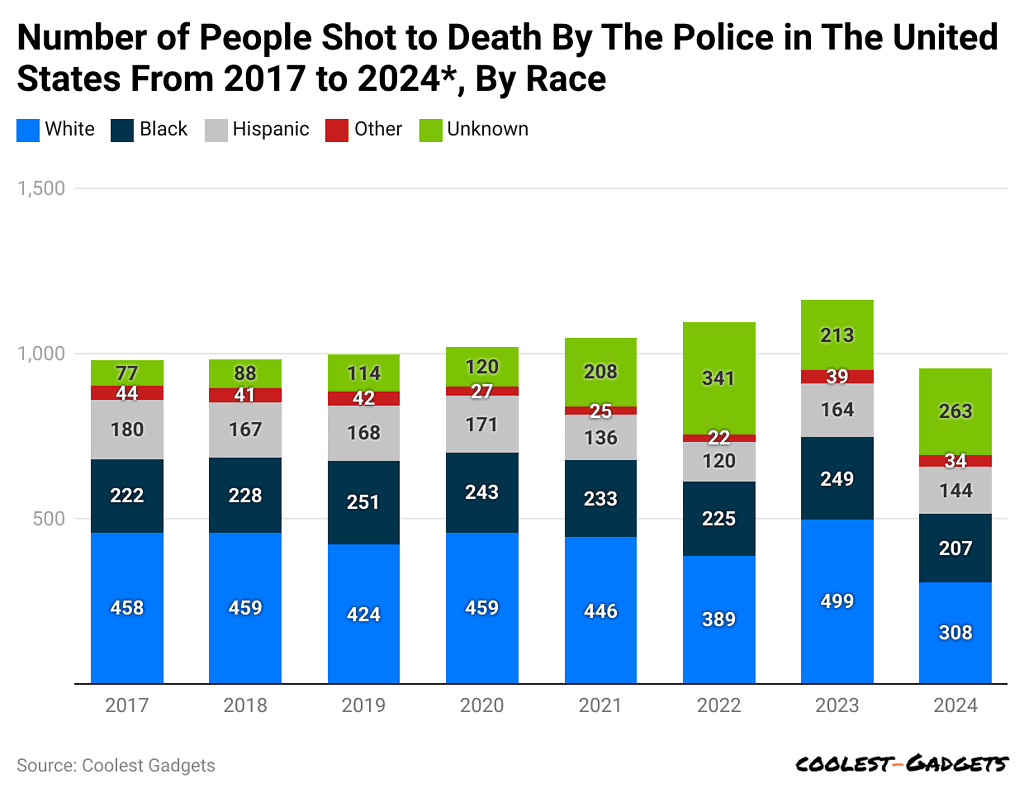
(Reference: statista.com)
- As of October 2024, the number of fatal police shootings in the U.S. is rising, with 956 civilians shot so far.
- Moreover, white Americans have accounted for the highest number of people shot to death by police, resulting in 308 people.
- Furthermore, other numbers of people shot to death by other races are Black (207), Hispanic (144), Other (34), and Unknown (263).
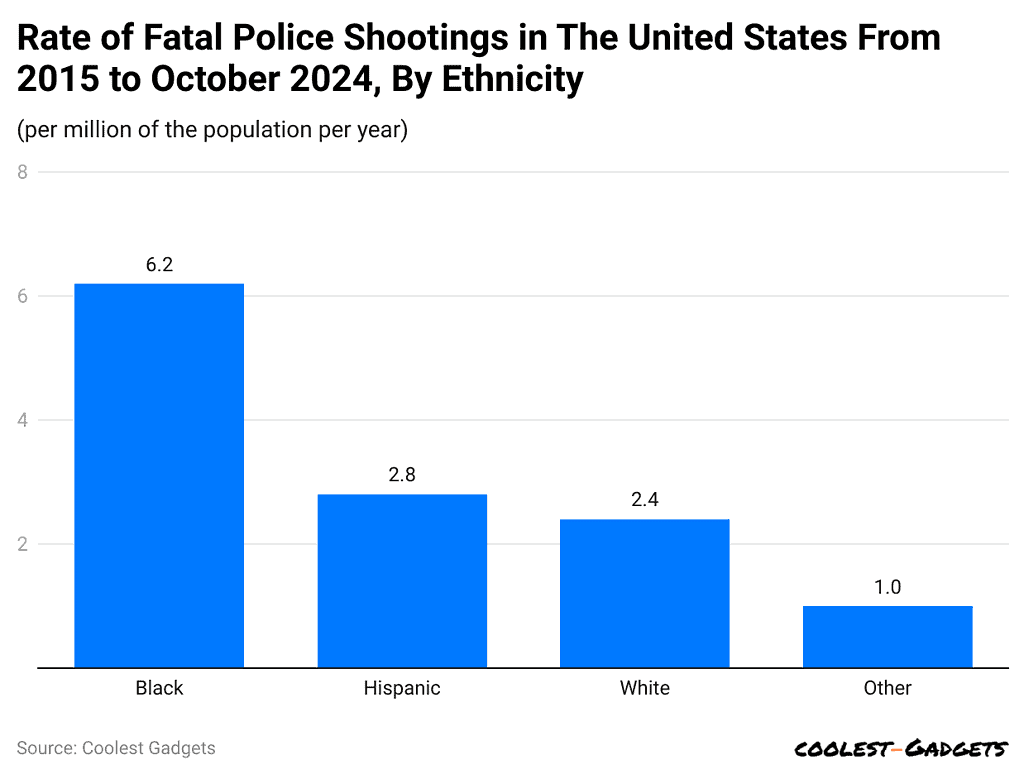
(Reference: statista.com)
- S. Death Statistics report that between 2015 and October 2024, Black Americans faced a fatal police shooting rate of 6.2 per million yearly.
- For Hispanics, there are 2.8 deadly police shootings per million people each year, followed by Whites (2.4) and others (1).
Leading Causes of U.S. Death Statistics
- As of November 2024, the top two causes of death are heart disease and cancer, accounting for over 40% of all deaths combined.
- The total number of American deaths and total share of deaths via heart disease and cancer at the same time is 680,909 (22%) and 613,352 (19.8%), respectively.
Other causes of U.S. Death are detailed in the table below:
| Causes of Death | Total Number of Deaths | Share of Deaths |
| Accidents or Injuries | 222,518 | 7.2% |
| Cerebrovascular Diseases | 165,393 | 5.4% |
| Chronic Lower Respiratory Diseases | 147,382 | 4.8% |
| Alzheimer’s Disease | 120,122 | 3.9% |
| Diabetes | 101,209 | 3.3% |
| Kidney Diseases | 57,937 | 1.9% |
| Chronic Liver Disease and Cirrhosis | 54,803 | 1.8% |
| COVID-19 | 49,928 | 1.6% |
Gun Deaths Statistics By Age Group
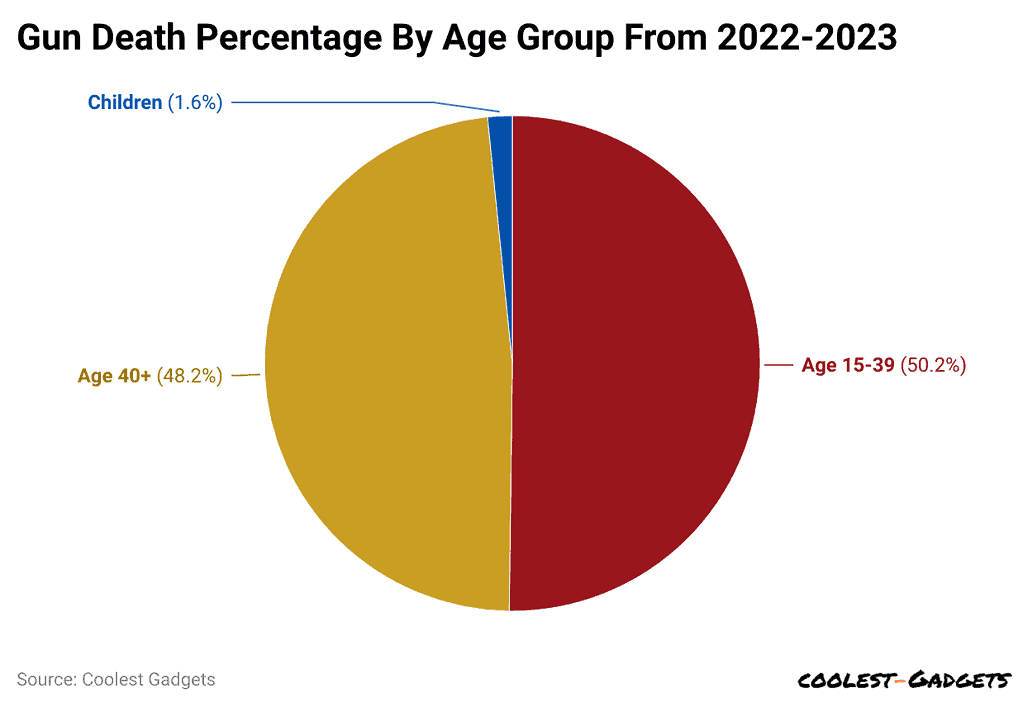
(Reference: legalreader.com)
- By the end of 2023, American people aged from 15 to 39 years faced the highest death rate of 50.2%.
- Furthermore, other gun deaths shared by age group are 40 years and above (48.2%) and children (1.6%).
By Ethnicity
- S. Death Statistics further show that 56% of the total death share belongs to white people in America.
- In 2024, other average shares of gun deaths based on other ethnicities are Black (30.2%), Hispanic (12.6%), and American Indian (1.25%).
By Locations
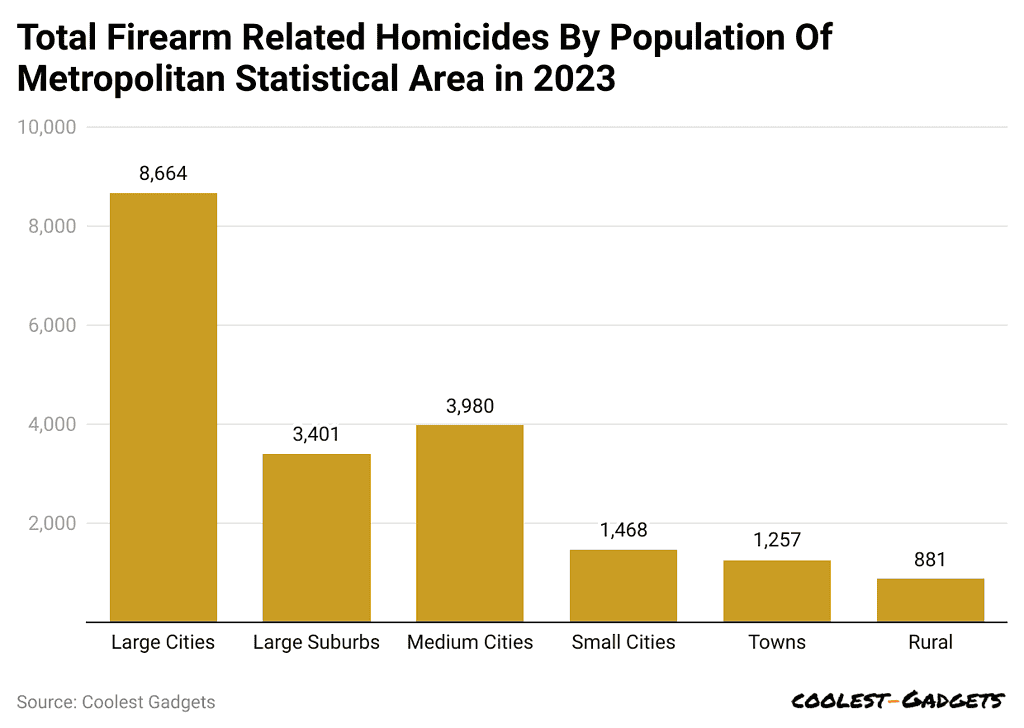
(Reference: legalreader.com)
- As per U.S. Death Statistics in 2024, large cities accounted for the highest number of gunshot deaths in America, resulting in 8,664.
- Furthermore, other gunshot deaths based on locations are followed by medium cities (3,980), large suburbs (3,401), small cities (1,468), towns (1,257) and rural areas (881).
U.S. Women’s Cancer Death Statistics
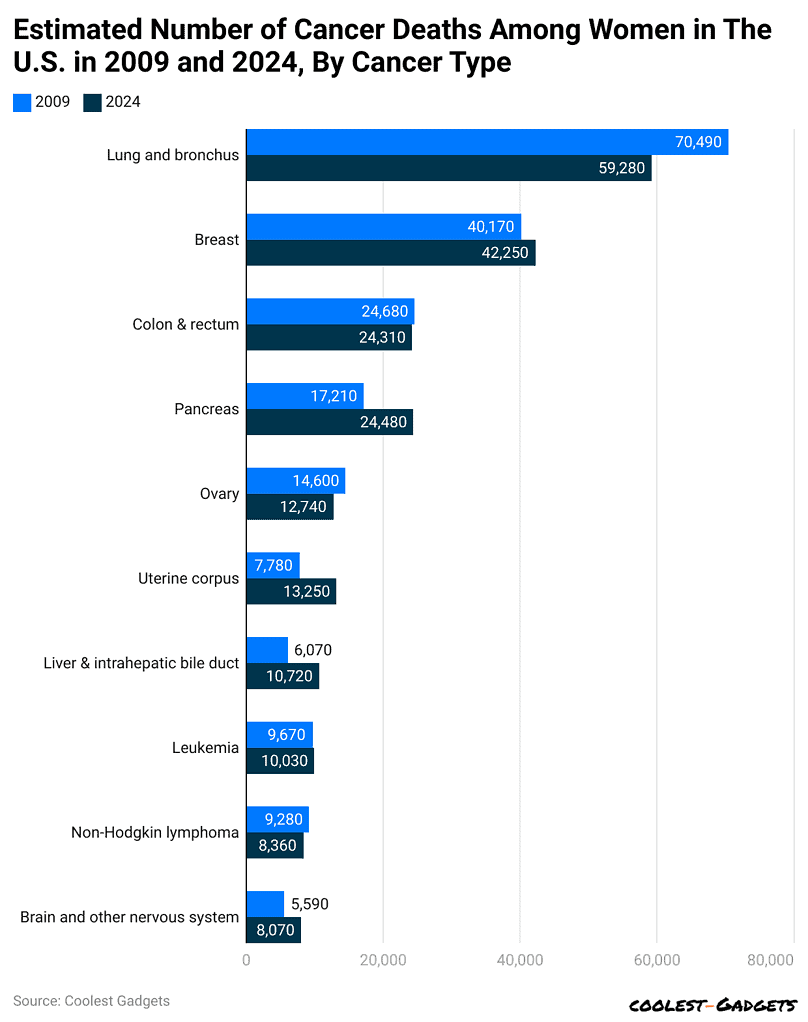
(Reference: statista.com)
- S. Death Statistics in 2024 show that about 59,280 women in the U.S. are expected to die from lung and bronchial cancer.
- At the same duration, the estimated number of women deaths by cancer types is breast (42,250), colon & rectum (24,310), pancreas (24,480), ovary (12,740), uterine corpus (13,250), liver & intrahepatic bile duct (10,720), leukaemia (10,030), non-Hodgkin lymphoma (8,360) and brain & other nervous system (8,070).
U.S. Men’s Cancer Death Statistics
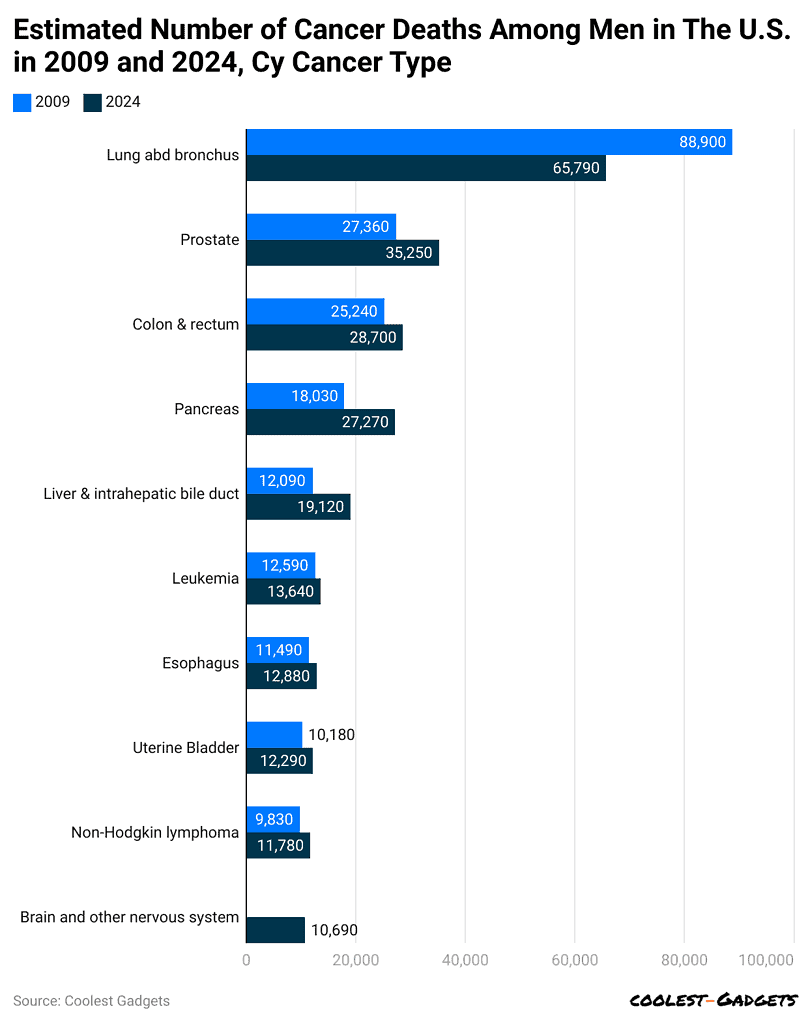
(Reference: statista.com)
- The above Statista graph analyses represent the estimated total number of male deaths by the top three can in 2024: lung and bronchial (65,790), prostate (35,250), and colon & rectum (28,700).
- Moreover, other types of cancer by the number of men’s deaths are pancreas (27,270), liver and intrahepatic bile duct (19,120), leukaemia (13,640), oesophagus (12,880), urinary bladder (12,290), non-Hodgkin lymphoma (11,780), and brain and other nervous systems (10,690).
U.S. Death Statistics By Demographics
- American male and female-adjusted death rates per 100k population are 884,2 and 632.8, respectively.
- As of 2024, the United States has experienced the highest death rates globally, in which 85 years and above age groups made up 15,743.3 deaths rate per 100,000 population.
Other age group death rates are elaborated below:
| Age (years) | Death rate per 100k population |
| 75 to 84 | 5,119.4 |
| 65 to 74 | 2,151.3 |
| 55 to 64 | 1,117.1 |
| 45 to 54 | 531 |
| 35 to 44 | 287.9 |
| 25 to 34 | 180.8 |
| 15 to 24 | 88.9 |
| 5 to 14 | 14.3 |
| 0 to 4 | 25 |
- Meanwhile, the U.S. death rate per 100k by race or ethnicity is Non-Hispanic Black or African American (924.3), Non-Hispanic White (750.4), Hispanic or Latino (552.6), and Non-Hispanic Asian (352.1).
States with the Highest U.S. Death Rate Statistics
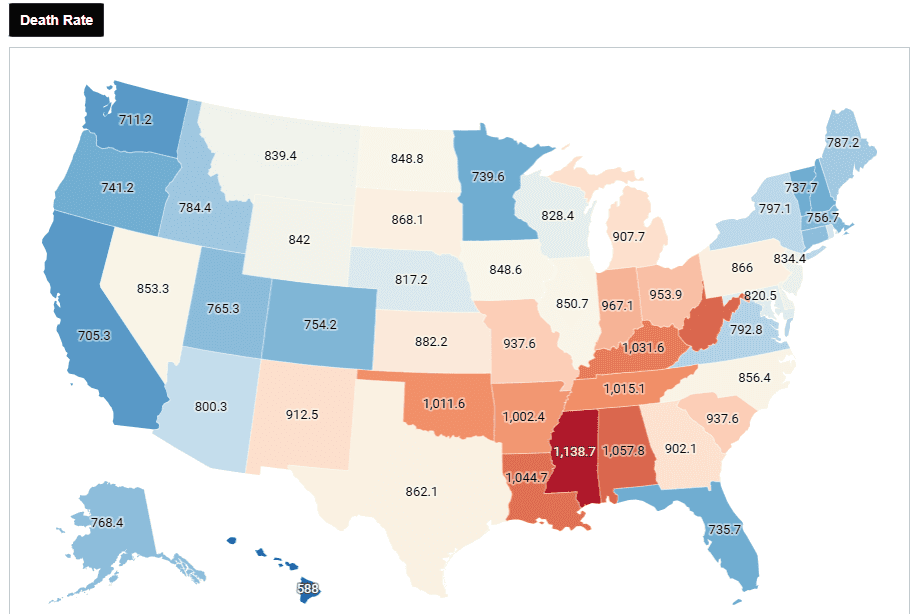
(Source: datapandas.org)
- To date, in 2024, Mississippi secured the highest death rate in the U.S., with 1,138.7 deaths for every 100,000 people.
- States with the lowest death rates are in the West and Northeast, especially Hawaii (705.3) and California (588).
Furthermore, other state’s date rate analyses per 100K are detailed in the table below:
| States | Death Rate |
| Alabama | 1057.8 |
| West Virginia | 1055.8 |
| Louisiana | 1044.7 |
| Kentucky | 1031.6 |
| Tennessee | 1015.1 |
| Oklahoma | 1011.6 |
| Arkansas | 1002.4 |
| Indiana | 967.1 |
| Ohio | 953.9 |
| Missouri | 937.6 |
| South Carolina | 937.6 |
| New Mexico | 912.5 |
| Michigan | 907.7 |
| Georgia | 902.1 |
| Kansas | 882.2 |
| South Dakota | 868.1 |
| Pennsylvania | 866 |
| Texas | 862.1 |
| North Carolina | 856.4 |
| Nevada | 853.3 |
| Illinois | 850.7 |
| North Dakota | 848.8 |
| Iowa | 848.6 |
| Wyoming | 842 |
| Montana | 839.4 |
| Delaware | 835.9 |
| New Jersey | 834.4 |
| Wisconsin | 828.4 |
| Maryland | 820.5 |
| Nebraska | 817.2 |
| Rhode Island | 806.6 |
| Arizona | 800.3 |
| New York | 797.1 |
| Virginia | 792.8 |
| Maine | 787.2 |
| Idaho | 784.4 |
| Connecticut | 769.1 |
| Alaska | 768.4 |
| Utah | 765.3 |
| Massachusetts | 756.7 |
| Colorado | 754.2 |
| Oregon | 741.2 |
| Minnesota | 739.6 |
| New Hampshire | 737.8 |
| Vermont | 737.7 |
| Florida | 735.7 |
| Washington | 711.2 |
U.S. Death Statistics By Per Day
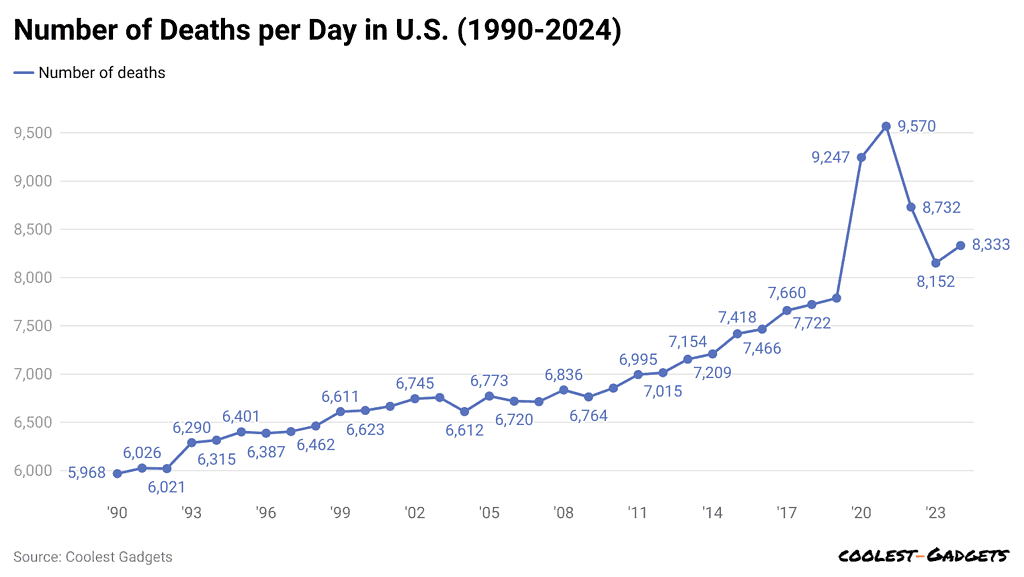
(Reference: consumershield.com)
- In the U.S., daily deaths averaged about 4,054 in 1950.
- After three years of daily deaths being 18% above average, they sharply dropped to 8,152 in 2023.
- It is estimated that by the end of 2024, the nation will account for 8.33K deaths every day.
U.S. Overdose Death Statistics
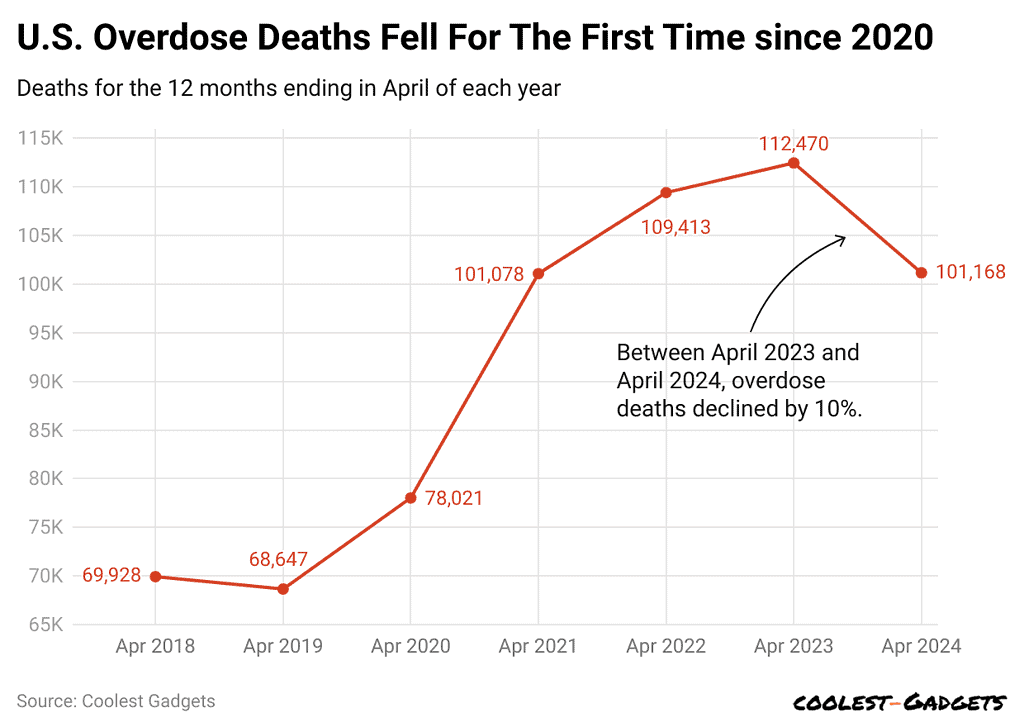 (Reference: npr.org)
- The above graphical representation shows that between April 2023 and 2024, the overdose death rate has declined by 10%.
- Meanwhile, in April 2023, the total number of deaths due to overdose was around 112,470 and in April 2024 (101,168).
- S. Death Statistics show that Ohio has seen a 31% drop in overdose deaths, showing a positive trend in reducing fatalities.
- Drug deaths in Missouri fell by 10% last year and dropped about 34% in the second quarter of 2024.
U.S. Deaths Statistics By Violence And Abuse
- In 2024, around 48,000 people may die from suicide, making up about 1.6% of all deaths.
- Meanwhile, drug overdoses led to around 106,000 deaths or 3.5% of all death rates.
- These death statistics reveal that illness from economic or social stress leads to USD 70 billion in productivity loss yearly.
- Homicides and violent crimes are costing the U.S. over USD 250 billion each year, impacting the economy significantly.
- The yearly cost of care, legalisation issues, and lost work from drug overdose deaths is nearly USD 1 trillion.
- About 20,000 people were murdered in the USA, making up 0.7% of all deaths.
Conclusion
In recent years, the causes of U.S. death rates include severe health issues, accidents, and ageing. Heart disease, cancer, and COVID-19 have been leading causes in recent years, significantly impacting overall life expectancy. Due to medical advancements having improved survival for many, lifestyle choices and access to the healthcare segment are playing a crucial role in these outcomes.
Accidents, particularly vehicle-related and gunshots, also contribute to death rates. The nation has launched many programs that promote healthier lifestyles, safer roads, and preventive healthcare, which are essential in reducing preventable deaths. Addressing health disparities across different regions and communities can further improve public health and lower mortality rates, helping people live longer, healthier lives.
FAQ.
Lifestyle factors, like diet, exercise, smoking, and alcohol use, greatly impact U.S. mortality rates, influencing heart disease, cancer, and diabetes.
Each year, about 3.4 million people die in the United States. The leading causes of death include heart disease, cancer, and unintentional injuries.
The lower socioeconomic status often leads to higher mortality rates due to limited access to healthcare, nutrition, and resources.
Barry Elad is a tech enthusiast passionate about exploring various technology topics. He collects key statistics and facts to make tech easier to understand. Barry focuses on software and its benefits for everyday life. In his free time, he enjoys creating healthy recipes, practicing yoga, meditating, and walking in nature with his child. Barry's mission is to simplify complex tech information for everyone.