Speakers Statistics By Sales, Brands and Usage

Updated · Mar 05, 2025


TABLE OF CONTENTS
- Introduction
- Editor’s Choice
- Facts About Speakers
- General Speakers Statistics
- Speaker’s Statistics By Country
- Speaker’s Statistics By Region
- Wireless Speaker Market Statistics
- Smart Speaker Statistics By Revenue
- Smart Speaker Statistics By Party
- Smartphone Speaker Statistics
- Waterproof Speaker Statistics
- Stereo Speaker Statistics
- Speaker Statistics By Country
- Voice Search Statistics By Device
- Top Speakers Of 2024
- Conclusion
Introduction
Speakers Statistics: Speakers are important for listening to music, watching movies, and many other activities. They come in different types, sizes, and qualities. Some speakers are small and portable, while others are big and powerful. People use speakers at home, in cars, and at events. The market for speakers is growing as technology improves. Wireless and smart speakers have become more popular because they are easy to use.
Statistics show that more people are buying speakers, especially those with advanced features. The demand for high-quality sound is increasing, and companies are making better products to meet customer needs. In this article, we will look at speaker statistics, including market trends, sales growth, and popular brands, to understand how the industry is changing.
Editor’s Choice
- The worldwide revenue generated by the speakers market is projected to reach USD 46.7 billion by 2024, with a revenue change of 6.8%.
- The market’s annual growth rate is anticipated to experience a 5.92% CAGR from 2024 to 2028.
- As mentioned in Speaker Statistics, the global speaker market is expected to generate approximately USD 49.6 billion in revenue by 2025. China is anticipated to contribute the highest revenue, around USD 13.34 billion.
- The speaker market is expected to generate about USD 6.35 in revenue per person, considering the total population, by 2025.
- During the same period, the expected total revenue earned by the stereo speaker industry and smart speaker market will be around USD 26.5 billion and USD 20.18 billion, respectively.
- The projected market will grow by 7.7% share in 2025.
- By the end of this year, China will generate the highest speaker revenue, up to USD 12,420 million, and per-person revenue will be USD 6.02.
- The forecasted volume of the speaker market will reach 626.7 million pieces by 2028.
- Worldwide, voice assistance users will turn 8 billion by 2024.
- As of 2023, there were approximately 146 million voice Assistance users in the United States.
- In the United States, almost 47.3 million adults use smart speakers.
- The global installed base of smart speakers in the U.S. and China will grow to 640 million units by 2024.
Facts About Speakers
- The first electric loudspeaker was patented by Alexander Graham Bell in 1876.
- A speaker’s essential feature is to produce sound in response to an electric, digital, or wireless signal.
- The most expensive speaker, Hart Audio D and W Aural Pleasure, costs USD 5 million.
- A typical speaker might cover frequencies from 40Hz to 25kHz.
- Impedance measured in ohms (Ω), this indicates how much a speaker resists electrical current. Common values are 4Ω or 8Ω.
- This tells how loud a speaker will be with a given power input, usually measured in decibels (dB) with 1 watt of power at 1 meter distance.
You May Also Like To Read
- Headphone Statistics
- Bluetooth Shower Speaker Statistics
- Smart Speaker Statistics
- Bluetooth Speakers Statistics
- Computer Speakers Statistics
- Wireless Adapter Statistics
- Running Headphones Statistics
General Speakers Statistics
- The global speaker’s market valuation was worth up to USD 31.2 billion in 2023 and will reach USD 46.7 billion by 2024.
- In the last five years, the prices of speakers have been reduced by 20%, boosting the demand for speakers.
- Based on Speaker Statistics By technology, the market is segmented into wired and wireless, with wired and wireless holding a market share of 28% and 72%, respectively.
- Based on product type, the wireless stereo segment will contribute the highest share at a CAGR of 40.8% from 2022 to 2030.
- Medium-sized speakers will be the highest contributors, with a CAGR of 14.1% during the same forecasted period.
- The personal segment will grow the highest with 30.8% CAGR, and the online segment will grow with 31.6% CAGR.
- As per the price range, speakers from USD 100 to USD 200 will capture the highest CAGR of 2.8%.
Speaker’s Statistics By Country
- China is expected to generate the highest speaker revenue, up to USD 12,420 million; per-person revenue will be USD 6.02 by the end of 2024.
- Furthermore, other countries by revenue and revenue change are the United States of America USD 10.8 billion and 8.4%), Germany (USD 2.2 billion and 7.5%), India (USD 2.06 billion and 6.2%), and Japan (USD 1.7 billion and 3.6%).
Speaker’s Statistics By Region
Asian Pacific Region
- The total revenue captured by the speaker in 2024 is estimated to be USD 20.1 billion, with a 7% revenue change.
- The market growth will be 5.91% of CAGR from 2024 to 2028.
- The revenue generated per person will be USD 4.70 in 2024, and the volume growth will be 8.4% by 2025.
Europe, The Middle East, And Africa
- The expected revenue generated in the speaker market of this region will be USD 12.3 billion in 2024.
- The annual growth rate of speakers will grow by 5.61% of CAGR (between 2024 to 2028).
- The revenue generated per person will be USD 5.05 in 2024, and the volume growth will be 6.4% by 2025.
Latin America
- The expected revenue generated by the LATAM speaker market will be USD 3 billion by 2024, with a growth rate of 3.31% CAGR from 2024 to 2028.
- The per-person generated revenue will be USD 4.63 in 2024, and the volume growth will grow by 4.5% by 2025.
Wireless Speaker Market Statistics
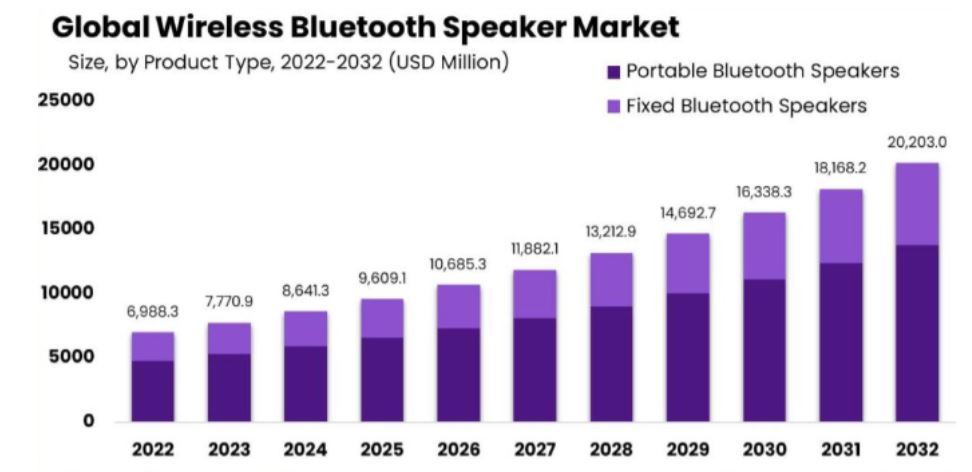 (Source: market.us)
- The global market is segmented into Bluetooth speakers and fixed Bluetooth speakers.
- As of 2023, the market size of global wireless Bluetooth speakers generated USD 7,770.9 million.
- The forecasted market valuation in coming years is followed by 2024 (USD 8,641.3 million), 2025 (USD 9,609.1 million), 2026 (USD 10,665.3 million), 2027 (USD 11,882.1 million), 2028 (USD 13,212.9 million), 2029 (USD 14,692.7 million), 2030 (USD 16,383.3 million), 2031 (USD 18,168.2 million), and 2032 (USD 20,203 million).
- Meanwhile, sales of wireless Bluetooth speakers are estimated to surge at 12.2% CAGR FROM 2023 to 2032.
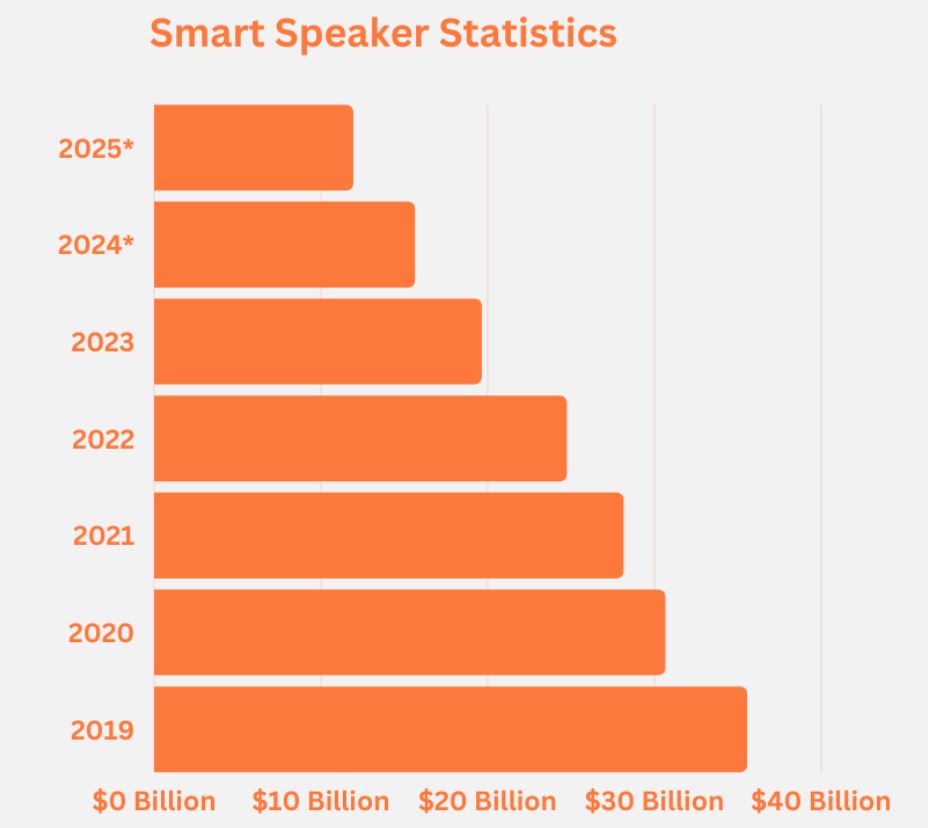
Smart Speaker Statistics By Revenue
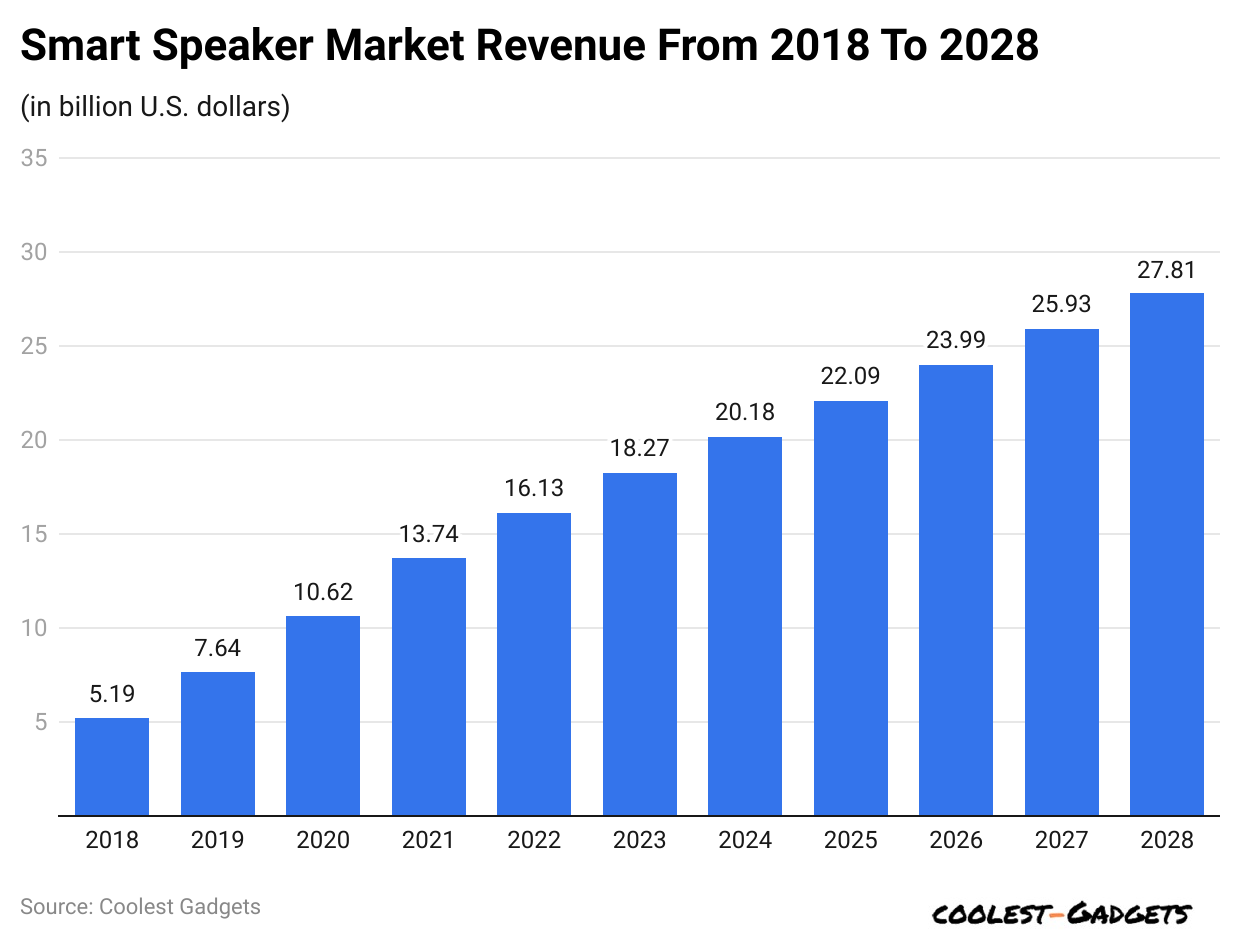 (Reference: statista.com)
- Global revenue is supposed to increase from 2024 to 2028 in the smart speaker segment, accounting for USD 7.6 billion and a share of 37.66%.
- Revenue earned by smart speakers in 2023 was USD 18.27 billion.
- The expected revenue in the coming years is USD 20.18 billion (2024), USD 22.9 billion (2025), USD 23.99 billion (2026), USD 25.93 billion (2027), and USD 27.81 billion (2028).
By Shipment
- Speaker Statistics also stated that The global shipment of smart speakers in 2023 was around 107 million units, and they held a share of 12% of the smart home device market.
- By 2027, shipment is estimated to increase, resulting in 122.5 million units.
By Brands
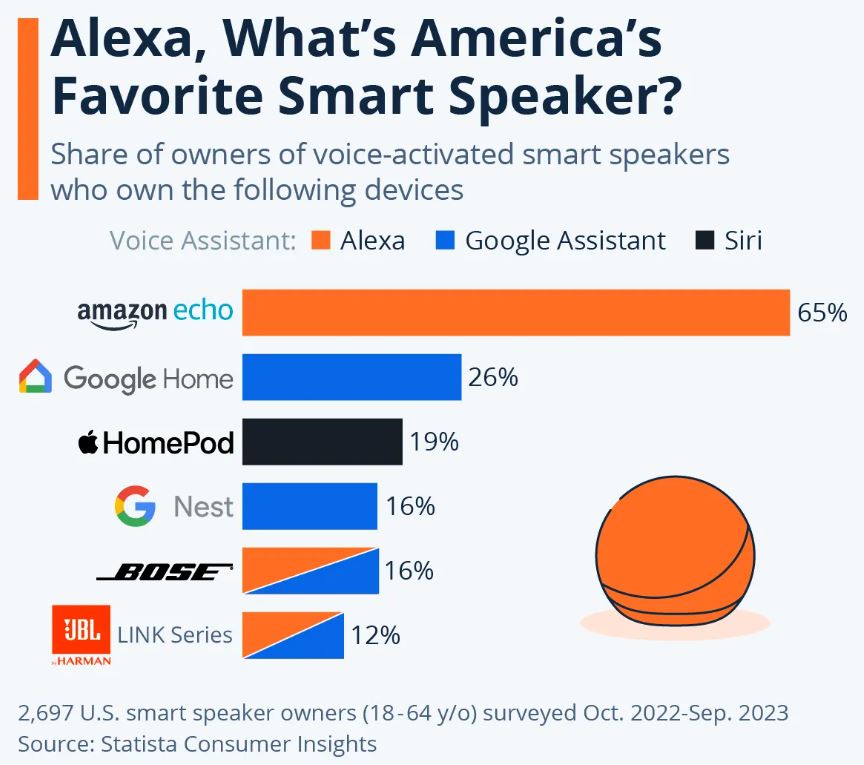
(Source: i0.wp.com)
- In the U.S., Amazon Echo had the highest market share of 65% in September 2023.
- This was followed by Google Home, which had a market proportion of 26%, Apple HomePod (19%), Google Nest (16%), Bose (16%), and JBL link series (12%).
- In Europe, Amazon leads with a marketplace share of 23.1%, followed by Google (16.7%).
 (Reference: statista.com)
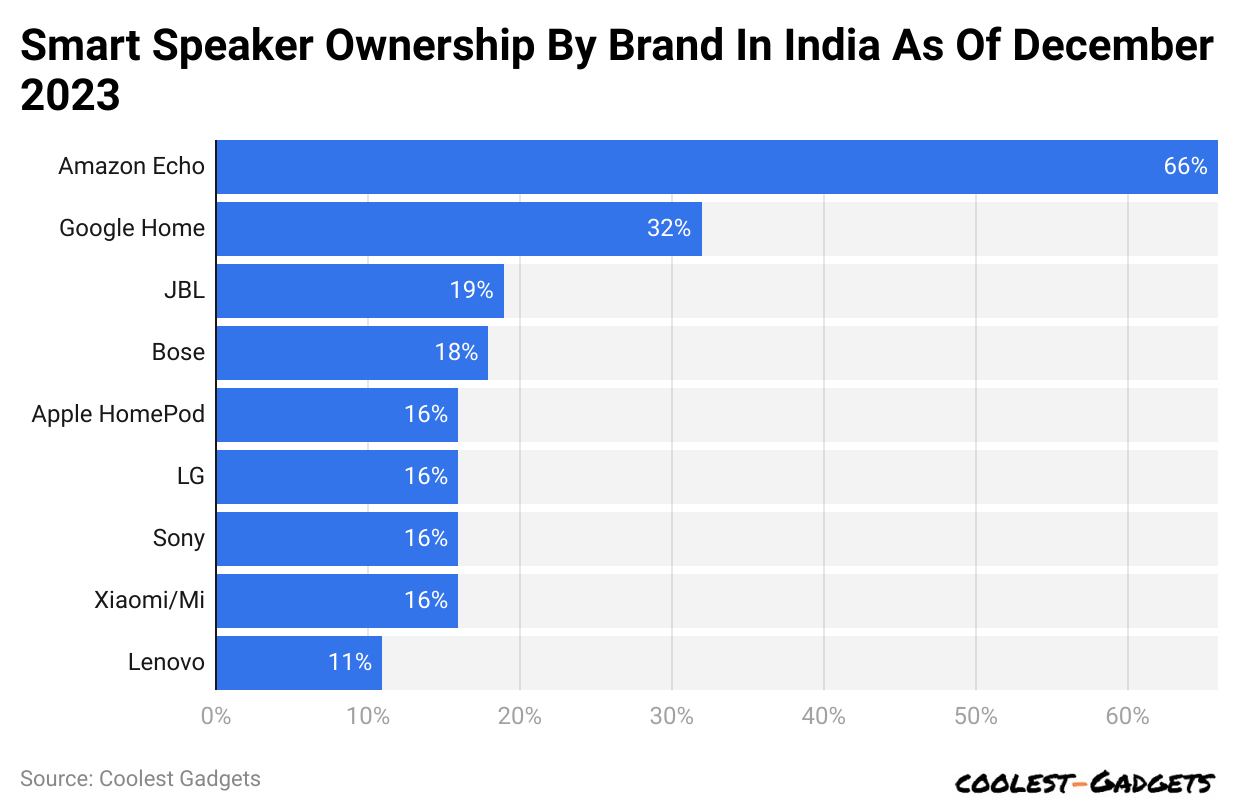
- By June 2023, Amazon Echo will have captured India's highest market share of 66.6%.
- Furthermore, others are Google Home (32%), JBL (19%), Bose (18%), Apple HomePod (16%), LG (16%), Sony (16%), Xiaomi/Mi (16%), Lenovo (11%), Eufy Genie (9%), Harman Kardon (9%), Sonos (6%), Yamaha (6%), Motorola (5%), Noise Zest (5%), Zebronics (5%), and others (2%).
By Uses
 (Reference: smit.vub.ac.be)
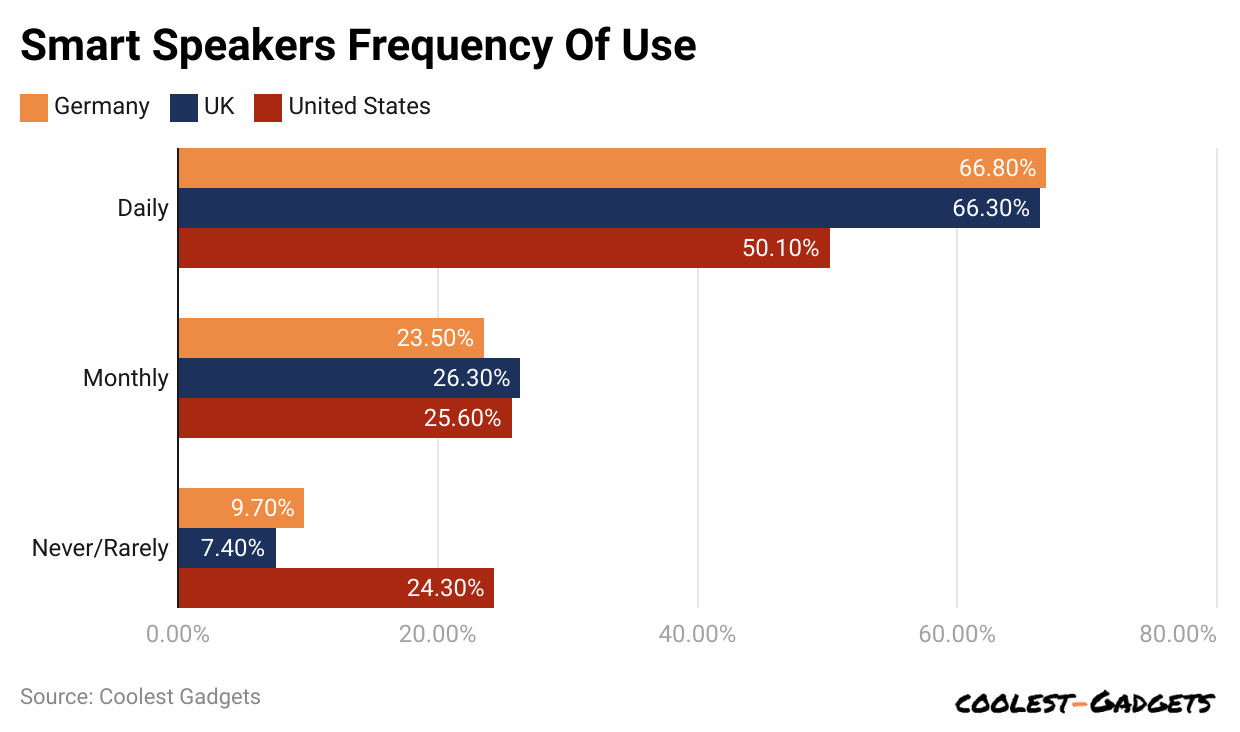
- In 2023, the usage frequency of smart speakers in Germany was daily (66.80%), monthly (23.50%), and never/rarely (9.70%).
- In the United Kingdom, usage frequencies are daily (66.30%), monthly (26.30%), and never (7.40%).
- In the United States, usage frequency is daily (50.10%), monthly (25.60%), and never (24.30%).
Smart Speaker Statistics By Party
 (Reference: statista.com)
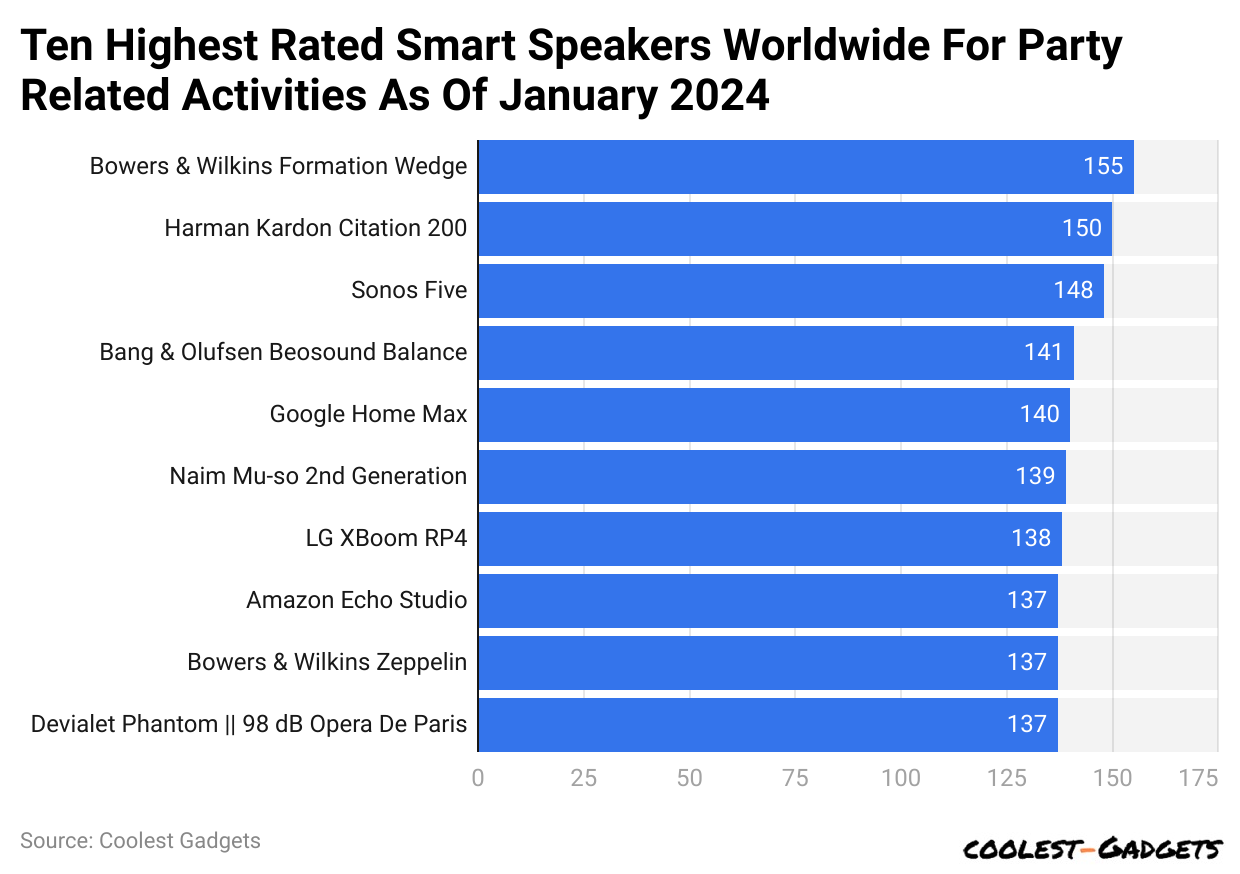
- The above graph describes the ten highest-rated bright smart speaker brands used globally for party-related activities in January 2024.
- Bowers and Wilkins Formation Wedge secured the highest position with the highest-rated piece of home tech for parties with 155 DXO marks in performance and quality score.
- The following top brands' speakers DXO marks performance and quality score are Harman Kardon Citation 200 (150), Sanos Five (148), Bang & Olufsen Beosound Balance (141), Google Home Max (140), Naim Mu-so 2 nd Generation (139), LG XBoom RP4 (138), Amazon Echo Studio (137), Bowers and Wilkins Zeppelin (137), and Devialet Phantom II 98 dB Opers De Paris (137).
Smartphone Speaker Statistics
(Source: answeriq.com)
- The global market size of smartphone speakers in 2023 accounted for USD 19.6 billion.
- It is expected that by 2024 end, the market valuation will reduced to USD 15.6 billion, and by the end of 2025, it will turn up to USD 11.9 billion.
- In the U.S., 55% of households (87.7 million) have purchased smartphone speakers, holding a market share of 5.6%.
- Amazon Echo and Google Home are significant players, with a market penetration of 70.6% and 23.8%, respectively.
- The adoption rate of smart speakers users is increasing rapidly, with 34.4%
By Uses
- In 2023, 90% of people used smart speakers for playing music.
- Other common usages are for weather information (81%) and factual information (75%).
You May Also Like To Read
- Keyboards Statistics
- Gaming Keyboard Statistics
- Wireless Keyboard Statistics
- Mice/Mouse Statistics
- Digital Picture Frame Statistics
Waterproof Speaker Statistics
- In 2023, the market valuation of waterproof speakers will account for USD 9.22 billion and reach up to USD 19 billion by 2033 end.
- The market is predicted to grow at a CAGR of 7.5% from 202 to 2033.
- The United States has the highest market share, more than 79%, in 2023.
- In East Asia, the sales of waterproof speakers will register a CAGR of 7.1%, and in UAE (6.7% CAGR) from 2023 to 2033.
- Based on product type, the CAGR of the ultra-portable speaker with 7.9% share and 360 degrees waterproof speakers (7.7%)
Stereo Speaker Statistics
- In 2024, the total revenue earned by the stereo speaker industry will be around USD 26.5 billion.
- Revenue is supposed to increase by USD 4.4 billion, with 16.6% of the share, during the forecasted period from 2024 to 2028.
- By 2028, the expected revenue is supposed to reach USD 30.94 billion.
- In the global market, the price of stereo speakers per unit is estimated at USD 106.93.
- The segment’s global volume will increase by 16.16% from 2024 to 2028, resulting in 40.7 million pieces, and it is expected to be 290.96 million pieces by 2028.
Speaker Statistics By Country
By Website Traffic
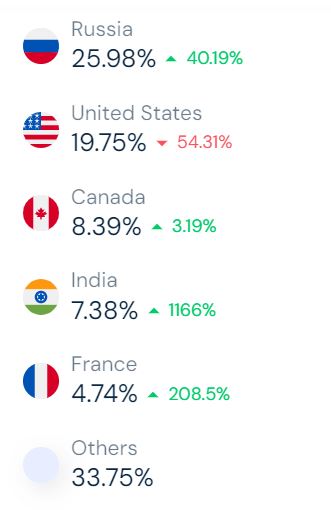
(Source: similarweb.com)
- The total website visits were 104.7K, which decreased by 18.46% from the previous month in January 2024.
- Russia had 25.98% of the total traffic on speakerdecision.com, but it recorded a 40.19% increase in website visitors.
- During the same duration, other countries recorded the following contribution in total traffic: the United States of America = 19.75% (-54.31%), Canada = 8.39% (+.19%), India = 7.38% (+116.6%), France = 4.74% (+208.5%).
- Other countries collectively made around 33.75% of visitor share in speakerdecision.com.
By Device
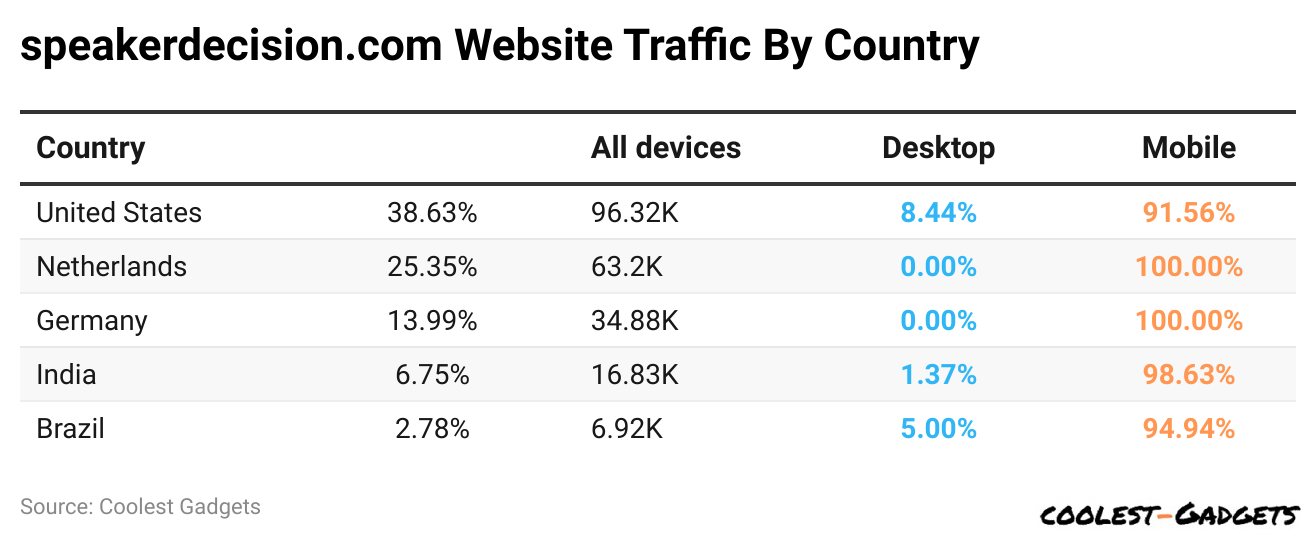 (Reference: semrush.com)
- Worldwide, 89.6% are mobile speaker users, and 10.4% are desktop users.
- 38.63% of speaker users belong to the United States, resulting in 96.32K; 8.44% are desktop, and 91.56% are mobile users.
- Sweden has 63.2 K users, resulting in 25.35% share out of these, 100% share comes from mobile devices.
- Of the total players, 13.99% are from Finland, resulting in 34.88K; 100% belong to mobile devices.
- Poland and Japan have around 16.83K and 6.92K users, respectively, which results in 6.75% and 2.78%.
- Of these, 1.37% are desktop users, and 98.63% are mobile users in Poland, whereas in Japan, 5.06% of users access the website on desktop, and 94.94% are mobile users.
By Age Distribution
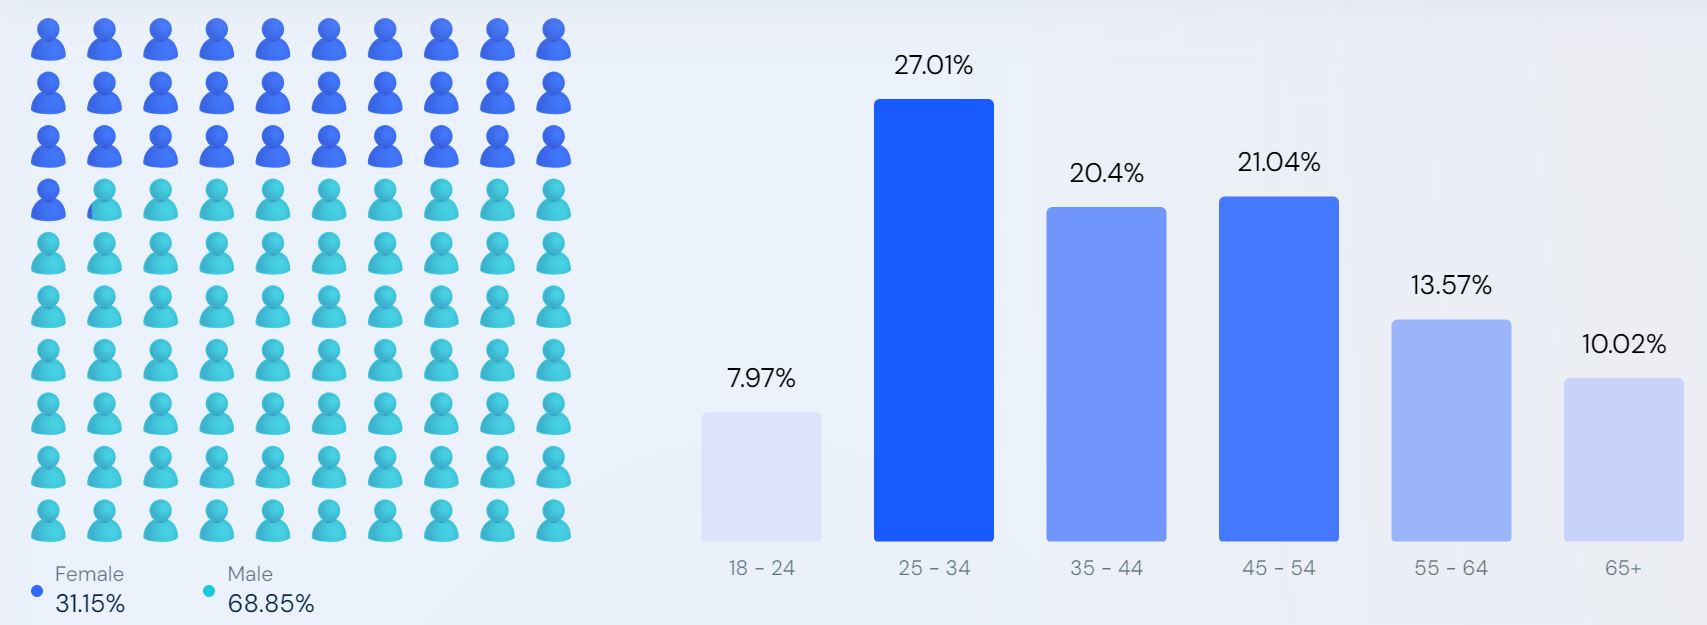 (Source: similarweb.com)
- According to speaker statistics by age group, the highest number of website users observed is between 25 and 34 years old, resulting in 27.01%.
- Out of total users, 21.04% are aged 45 years and 54 years.
- 20.4% and 13.57% belong to 45 to 54 years and 55 to 64 years respectively.
- 10.02% of website users are aged above 65 years and above.
- Nearly 7.97% of people contributed a share from 18 to 24 years.
- Male users are the highest, holding 68.85% of the share, and females have 31.15%.
By Traffic Source
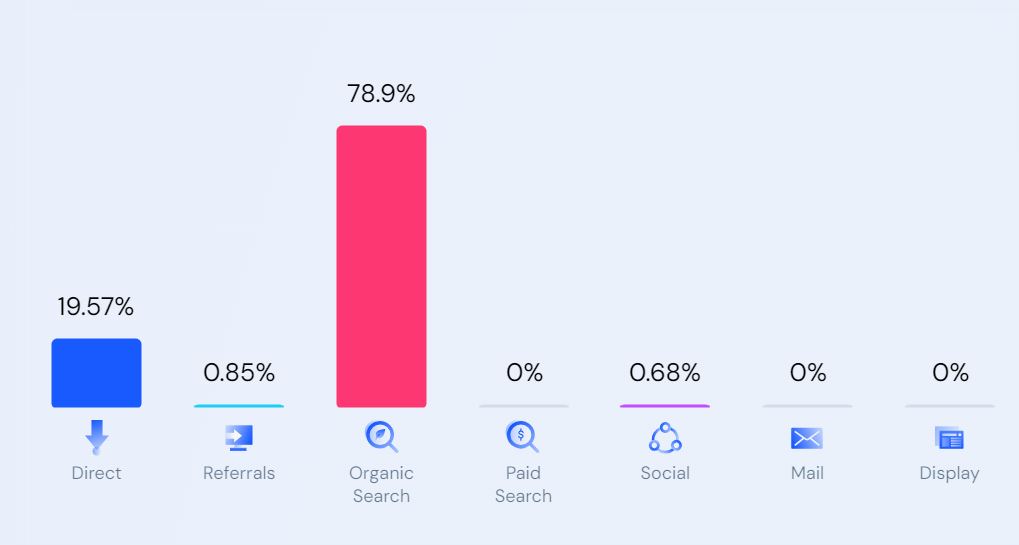
(Reference: similarweb.com)
- The highest traffic rate towards speakerdecison.com in January 2024 was by organic search, resulting in 39.61%.
- 19.57% of the share is generated by direct search, while 0.85% and 0.68% are from referral search and social search on the website, respectively.
- In social searches, Twitter and Reddit contribute 62.77% and 37.23%, respectively.
Voice Search Statistics By Device
 (Reference: answeriq.com)
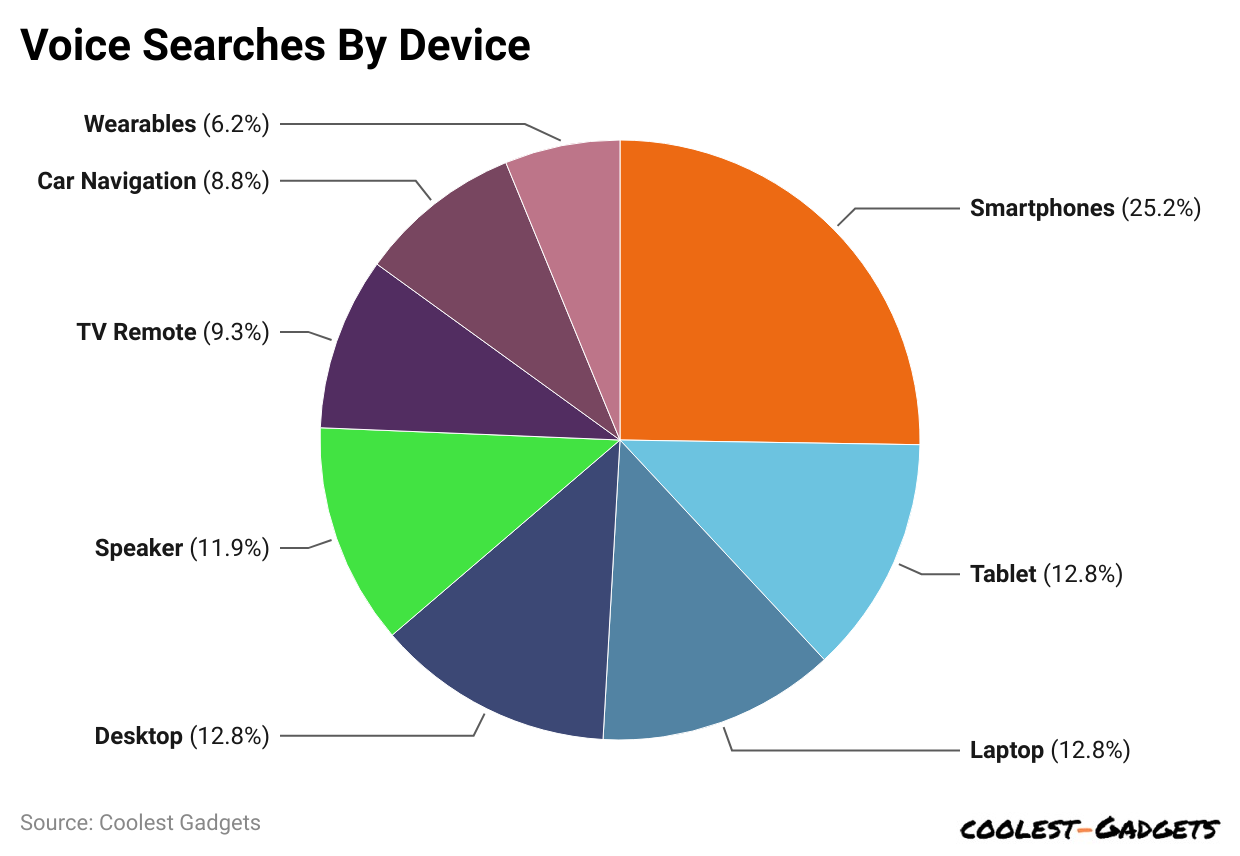
- Speaker Statistics also show that Speakers’ voice search will be less popular than smartphones in 2023.
- Only 27% of people were using voice searches by speaker.
- Usage share of other devices are smartphones (25.2%), tablets (12.8%), laptops (12.8%), desktops (12.8%), TV Remote (9.3%), car navigation (8.8%), wearables (6.2%).
- Smart Speaker voice search usages by age group are 18 to 34 years (34%), 35 to 54 years (19%), and more than 55 years (4%).
By Consumer Behavior
- 18% of speaker users use voice searches for information related to brands and businesses.
- 35% of Americans utilized voice search via smart speakers to buy online products.
- In the United States, 11.5% of customers (5.44 million adults) purchased by voice searches per month.
- 65% of owners of smart speakers felt comfortable using voice searches for shopping.
By Users
 (Reference: answeriq.com)
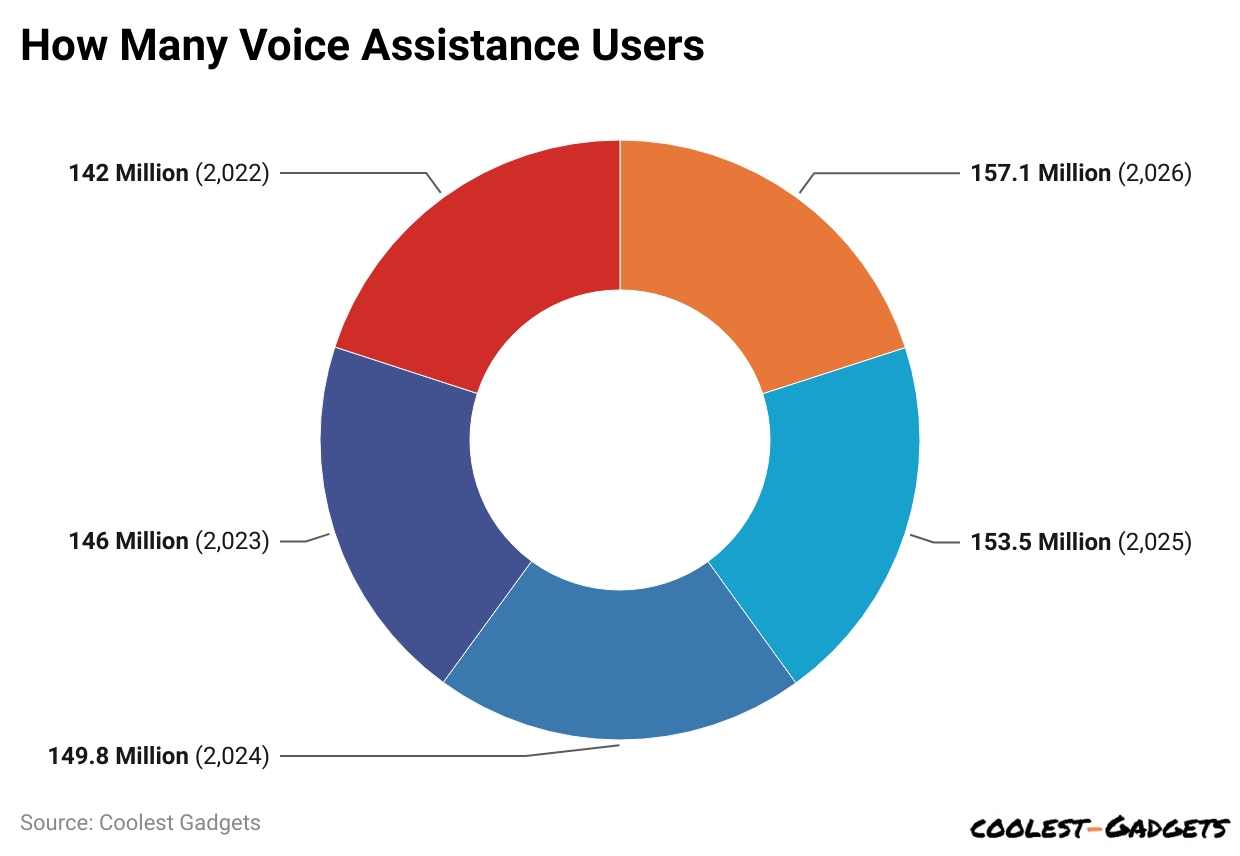
- In the United States, there were approximately 146 million voice Assistance users in 202.
- Furthermore, the number of users is projected to increase in the coming years, such as 2024 (149.8 million), 2025 (153.5 million), and 2026 (157.1 million).
Top Speakers Of 2024
- Sonos Era 100 is the best-sounding smart speaker, which costs USD 245 at Amazon.
- Elac Debut 2.0 B6.2 is the best bookshelf speaker for the money (USD 400).
- Fluance XL8F is the best tower speaker (USD 600).
- Tribit Storm Box Micro is the best budget Bluetooth speaker (USD 50).
- Roku Streambar is best budget soundbar (USD 130).
Conclusion
Today, after completing the article on Speaker Statistics, it can be stated that the market has witnessed steady growth in 2023 and the coming years. The leading sector was captured by smart speakers with voice assistants and is dominated by Amazon.
The market’s future seems promising as speakers now play a crucial role in providing immersive audio experiences. So, go through all the above analyses. I hope you get a clear idea about the market. Let us know which speaker you are going to invest in this year.
Sources
Barry Elad is a tech enthusiast passionate about exploring various technology topics. He collects key statistics and facts to make tech easier to understand. Barry focuses on software and its benefits for everyday life. In his free time, he enjoys creating healthy recipes, practicing yoga, meditating, and walking in nature with his child. Barry's mission is to simplify complex tech information for everyone.