Fitness Equipment Statistics By Market Size, Types and Facts

Updated · Jan 30, 2025


TABLE OF CONTENTS
- Introduction
- Editor’s Choice
- General Fitness Equipment Statistics
- Fitness Equipment Market Forecast
- Fitness Equipment Shoppers Statistics
- Fitness Equipment Company Statistics
- Nautilus Inc.net Sales Statistics by-Products
- Sports Equipment Statistics by Revenue
- By Functional Fitness Equipment
- By Virtual Fitness
- By Home Fitness Equipment
- Fitness Equipment Statistics by Treadmills
- Fitness Equipment Statistics by Exercise Bike
- Best Exercise Bikes for 2024
- Fitness Equipment Statistics By Rubber Dumbbells
- Best Treadmills For Your Home in 2024
- Best Dumbbells for 2024
- Best Fitness Equipment For 2024
- Conclusion
Introduction
Fitness Equipment Statistics: The fitness equipment industry has undergone substantial growth over the past two years, largely fueled by the pandemic’s impact on people’s lifestyle changes. With the closure of gyms and limited access to public sporting facilities, many individuals turned to home fitness solutions to continue their exercise routines. This shift has sparked a significant demand for exercise equipment and accessories tailored for home use. To grasp the scope, expansion, and evolving trends of this market, we’ve analyzed and compiled over 90 statistics focusing on both general and home-specific fitness equipment.
According to Statista, In 2024, the global exercise equipment market reached a revenue of USD 46.7 billion, with an anticipated compound annual growth rate (CAGR) of 6.22% projected from 2024 to 2028. Notably, China emerged as the leading market, generating USD 12,960.0 million in revenue in 2024. Additionally, the average global per capita spending on exercise equipment was USD 6.03 in the same year.
In the United States, the wholesale sales of home-use fitness equipment totaled approximately USD 6.5 billion in 2023, indicating a stable increase from previous years and highlighting a sustained consumer interest in maintaining fitness activities at home.
Editor’s Choice
- The total global revenue of the fitness equipment industry is projected to reach $14.3 billion by the end of 2024.
- The largest share was captured by the home fitness segment, with 84%.
- In 2023, cardiovascular equipment accounted for $6,919.92 million in revenue, and Strength training equipment for $4,649.71 million.
- Around 66% of fitness equipment purchases are made online, and retail stores make up 26% share.
- In September 2023, Amazon was the top retailer of fitness equipment in the United States, with a market share of 34%.
- The most popular fitness equipment manufacturer brand was Peloton, with 11% unit share and 25% dollar share.
- Fitness Equipment Statistics further states that the revenue from the global fitness tracker market will be $74.61 billion by 2024.
- 69% of homeowners purchase fitness equipment, a decrease of 1.4% from last year.
- The exercise equipment market is expected to generate $47 billion in global revenue in 2024, with a revenue change of 6.9%.
- In the U.S., Nautilus Inc. has sold various fitness equipment and generated revenue of around $232.14 billion in 2023.
General Fitness Equipment Statistics
- The fitness equipment market grows at 3.7% each year, which is slower than the fitness and gym market.
- Fitness Equipment Statistics by industries state that in 2023, the net worth of the home fitness equipment market was $11.6 billion.
- A report published by Gitnux.org predicted that the home fitness equipment market will generate $14.2 billion in revenue by 2028, with a CAGR of 3% from 2021 to 2028.
- On the other hand, the commercial fitness equipment market’s value was $2.2 billion, with a 16% share.
- The revenue growth of the connected fitness and gym equipment market will be $3.7 billion by 2028.
- The United States sports equipment market is supposed to reach more than $20 billion in revenue by the end of 2025.
- From 2021 to 2028, the Asia-Pacific home fitness equipment market will grow at a CAGR of 4.1%.
- In 2024, the global fitness equipment markets were segmented into cardiovascular training equipment and weight lifting machines, with 37% and 29.7% share, respectively.
- In the United States, San Fransisco in California is known as the healthiest city, as almost every individual works over 90 minutes or more each week.
- Monthly, an average American spends between $20 to $100 on gym membership.
Fitness Equipment Market Forecast
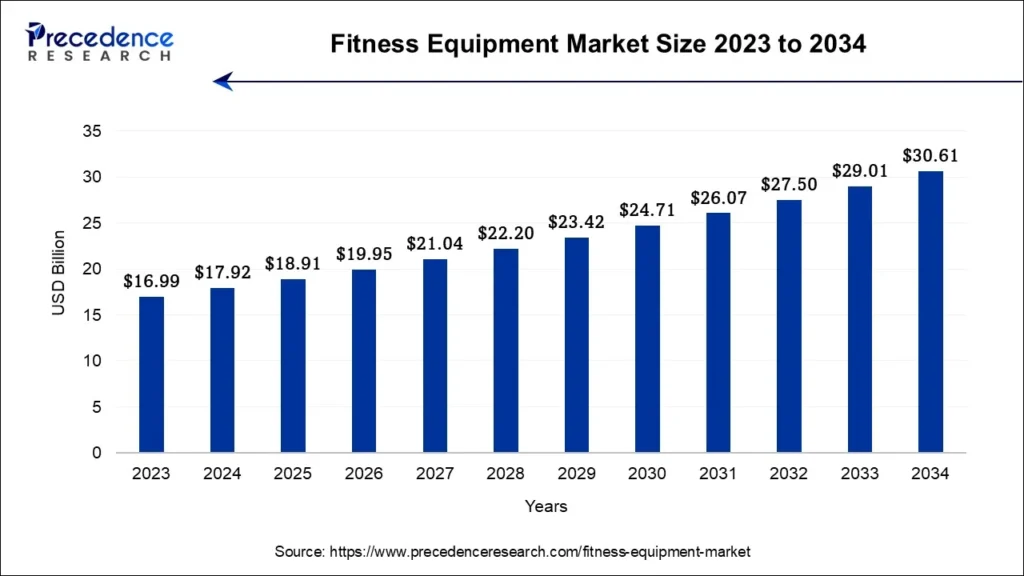
(Source: Precedence Research)
- The global fitness equipment market is estimated to be valued at USD 17.92 billion in 2024 and is projected to reach approximately USD 30.61 billion by 2034, with a compound annual growth rate (CAGR) of 5.5% from 2024 to 2034.
- The North American fitness equipment market accounted for USD 13.88 billion in 2024 and is expected to grow at the fastest CAGR of 6.97% during the forecast period.
- North America contributed more than 39% of the revenue share in 2023.
- The Asia-Pacific region is expected to experience the fastest growth, expanding at the highest CAGR during the forecast period.
- In 2023, the cardiovascular training equipment segment held over 59% of the revenue share.
- The strength training equipment segment is projected to grow at a significant CAGR of 3.5% during the forecast period.
- More than 53% of the revenue share in 2023 was generated by the home consumer segment.
- The healthcare segment is anticipated to expand at the fastest rate over the forecast period.
- The standard price point segment dominated the market with a 63% share in 2023.
- The premium/luxury segment is expected to grow at the quickest CAGR throughout the forecast period.
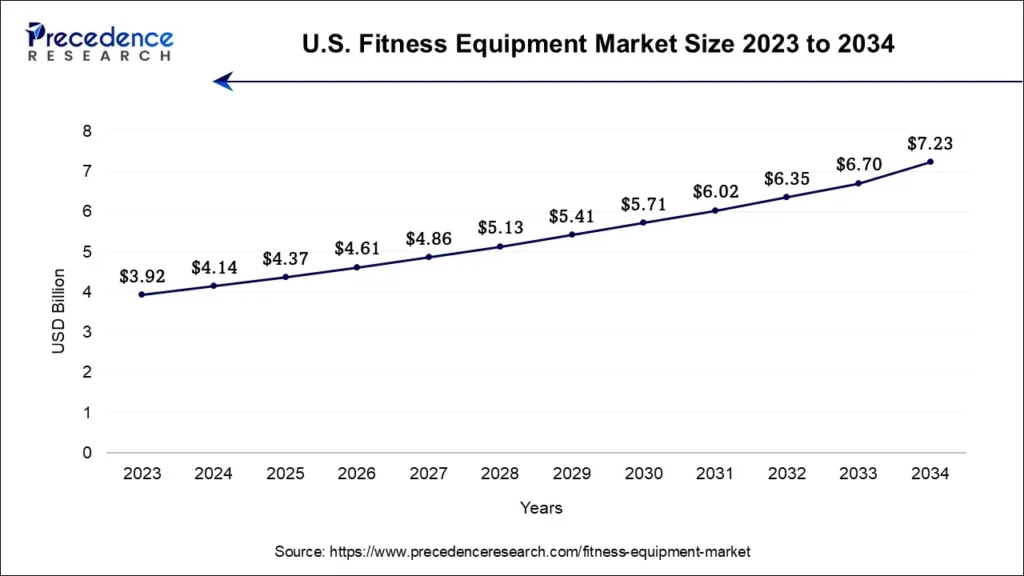
(Source: Precedence Research)
- The U.S. fitness equipment market size was valued at USD 4.14 billion in 2024 and is expected to increase to around USD 7.23 billion by 2034, growing at a CAGR of 5.73% from 2024 to 2034.
By Types
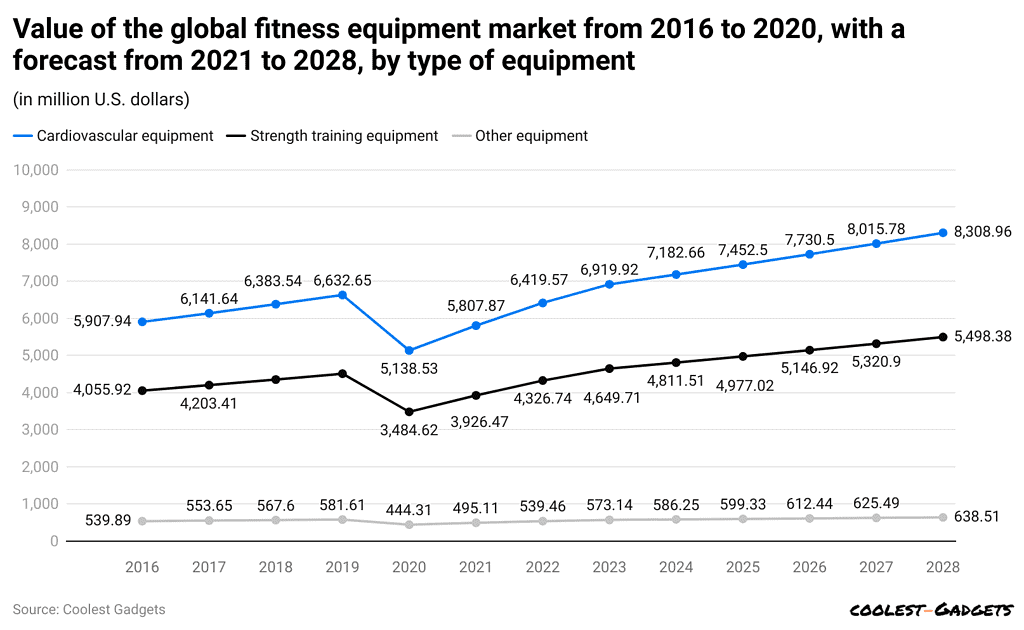
(Reference: statista.com)
- According to global Fitness Equipment Statistics, the market is segmented into cardiovascular, strength training, and other equipment.
- In 2023, revenue accounted by cardiovascular equipment was $6,919.92 million, Strength training equipment was $4,649.71 million, and other equipment (was $573.14 million).
- Furthermore, in coming market valuations of three different equipment segments are described below respectively such as 2024 ($7,182.66 million, $4,811.51 million, and $586.25 million), 2025 ($7,452.5 million, $4,977.02 million, and $599.33 million), 2026 ($7,730.5 million, $5,146.92 million, and $612.44 million), 2027 ($8,015.78 million, $5,320.59 million, and $625.49 million), and 2028 ($8,308.96 million, $5,498.8 million, and $638.51 million).
By Top Retailers Share
- In September 2023, Amazon was the top fitness equipment retailer in the United States, withheld a market share of023.
- The next highest retailer unit share was enjoyed by Dick’s with 6.8% and Peloton with 6.6%.
- If compared with dollar share, Amazon took the lead over Peloton in 2023 with 23.5%, and Peloton lost 6% points from last year, resulting in 18.3%.
- However, the average price paid for fitness equipment by the retailers is Peloton with $1,525.
- Average fitness equipment prices by top outlets are Amazon and Walmart at $364 and $296, respectively.
By Brands
- Fitness Equipment Statistics show that in 2023, the most popular fitness equipment manufacturer brand was Peloton, with an 11% unit share and 25% dollar share.
- The second famous brand is NordicTrack, which has a 5% unit share and a 10% dollar share.
- Bowflex secured the third brand position with a 5% unit share and a 6% dollar share.
- Based on brand consideration rates, Peloton is the most considered brand, with a 15% share, followed by NordicTrack (8%) and Bowflex (7%).
By Region
- As of 2024, the North American fitness equipment market will capture the highest market share, accounting for over 39%.
- The fastest-growing market of fitness equipment is Asia Pacific, which is anticipated to have a 21% share.
- Europe is known to be the second-largest market for fitness equipment, with over 15% of the market share.
By Demographics
- In 2023, around 69% of homeowners are the purchasers of fitness equipment, which has reduced by 1.4% from last year.
- Meanwhile, other purchasers’ shares are renters (28%) and married (53%).
- Male and female buyers of fitness equipment are 45% and 34%, respectively.
- Equipment buyers based on age group are Millennials (36%), Gen X (28%), and Gen Z (17%).
By Purchase Drivers
- According to Fitness Equipment Statistics, the top three reasons consumers purchase fitness equipment are’ first-time purchase’ (46%), ‘replacement of broken’ (13%), and ‘gift for someone’ (10%).
- The top reasons for purchasing from a specific retailer are a ‘competitive price’ (59%), a ‘good selection of products’ (33%), ‘previous experience with the store’ (14%), and a convenient location’ (14%).
- Reasons for purchasing a specific brand are ‘competitive price’ (46%), ‘features desired’ (39%), ‘quality product’ (31%), and ‘good brand name’ (20%).
Fitness Equipment Shoppers Statistics
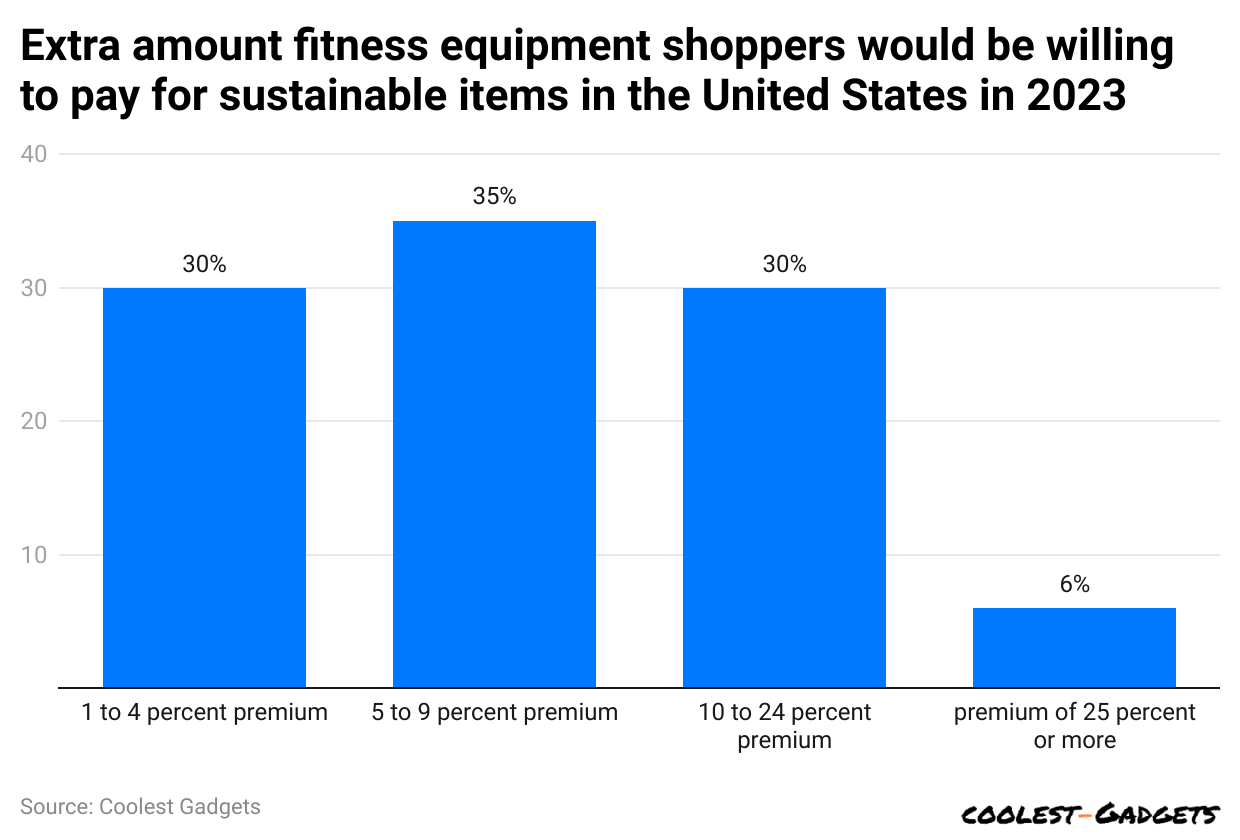
(Reference: statista.com)
- As of 2023, almost 35% of fitness equipment shoppers have paid 5% to 9% extra premiums for buying sustainable fitness products.
- Other percentages of shoppers by paid amount are 30% (1 to 4% premium), another 30% (10 to 24% premium), and 6% (more than 25%).
Fitness Equipment Company Statistics
Nautilus Inc.net sales statistics by Region
(Reference: statista.com)
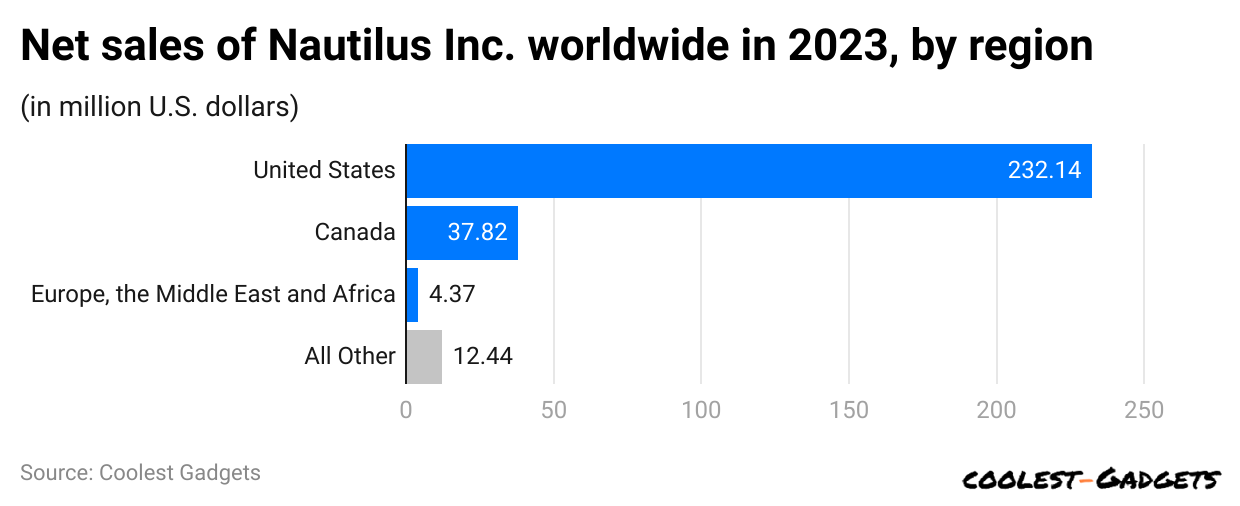
- In the United States, Nautilus Inc. has sold out different variations of fitness equipment and, in 2023, generated revenue of around $232.14 billion.
- Moreover, the company’s revenue was divided by other regions: Canada (437.82 billion), Europe, the Middle East, and Africa ($4.37 billion), and others ($12.44 billion).
Nautilus Inc.net Sales Statistics by-Products
(Reference: statista.com)
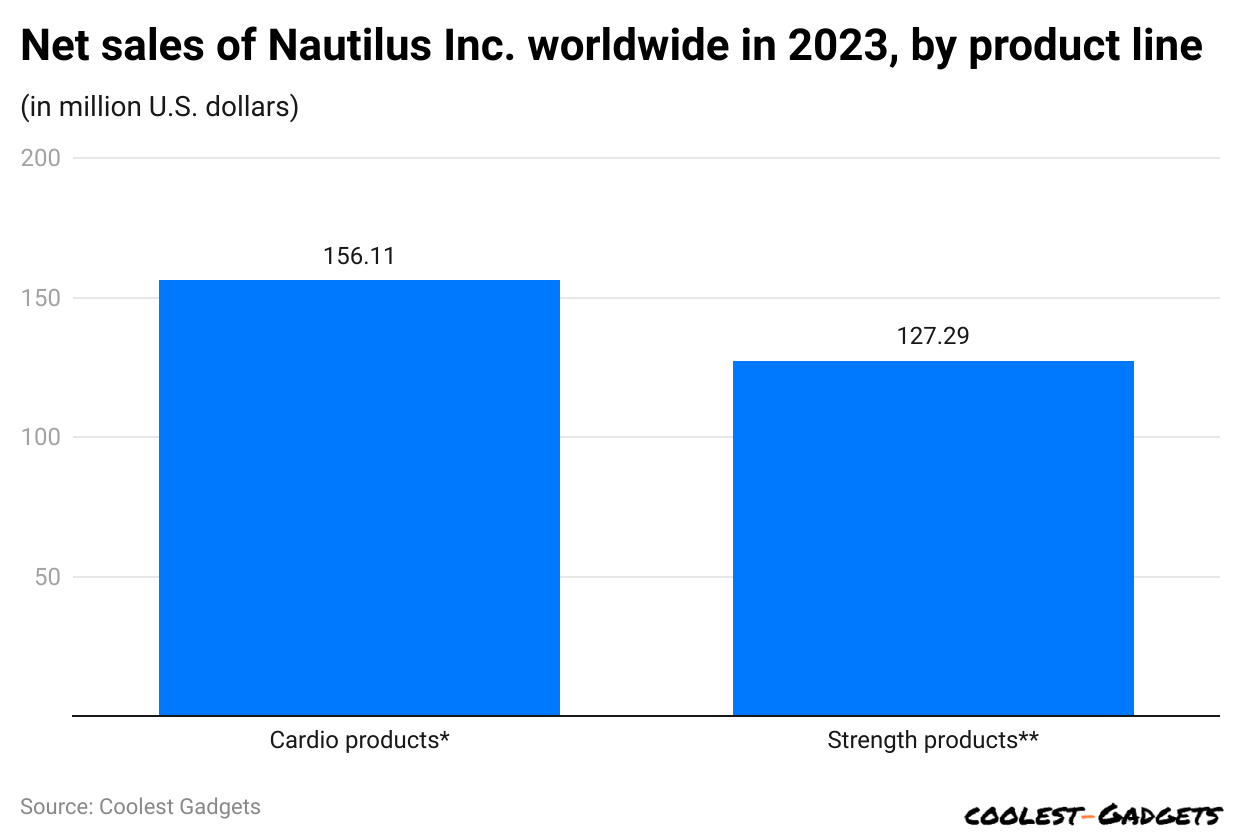
- Fitness Equipment Statistics further states that by the end of 31 March 2023, Nautilus Inc. had generated a maximum revenue of $156.11 million by selling cardio equipment.
- The following product line is strength equipment, with $127.29 million in revenue.
Nike
(Reference: statista.com)
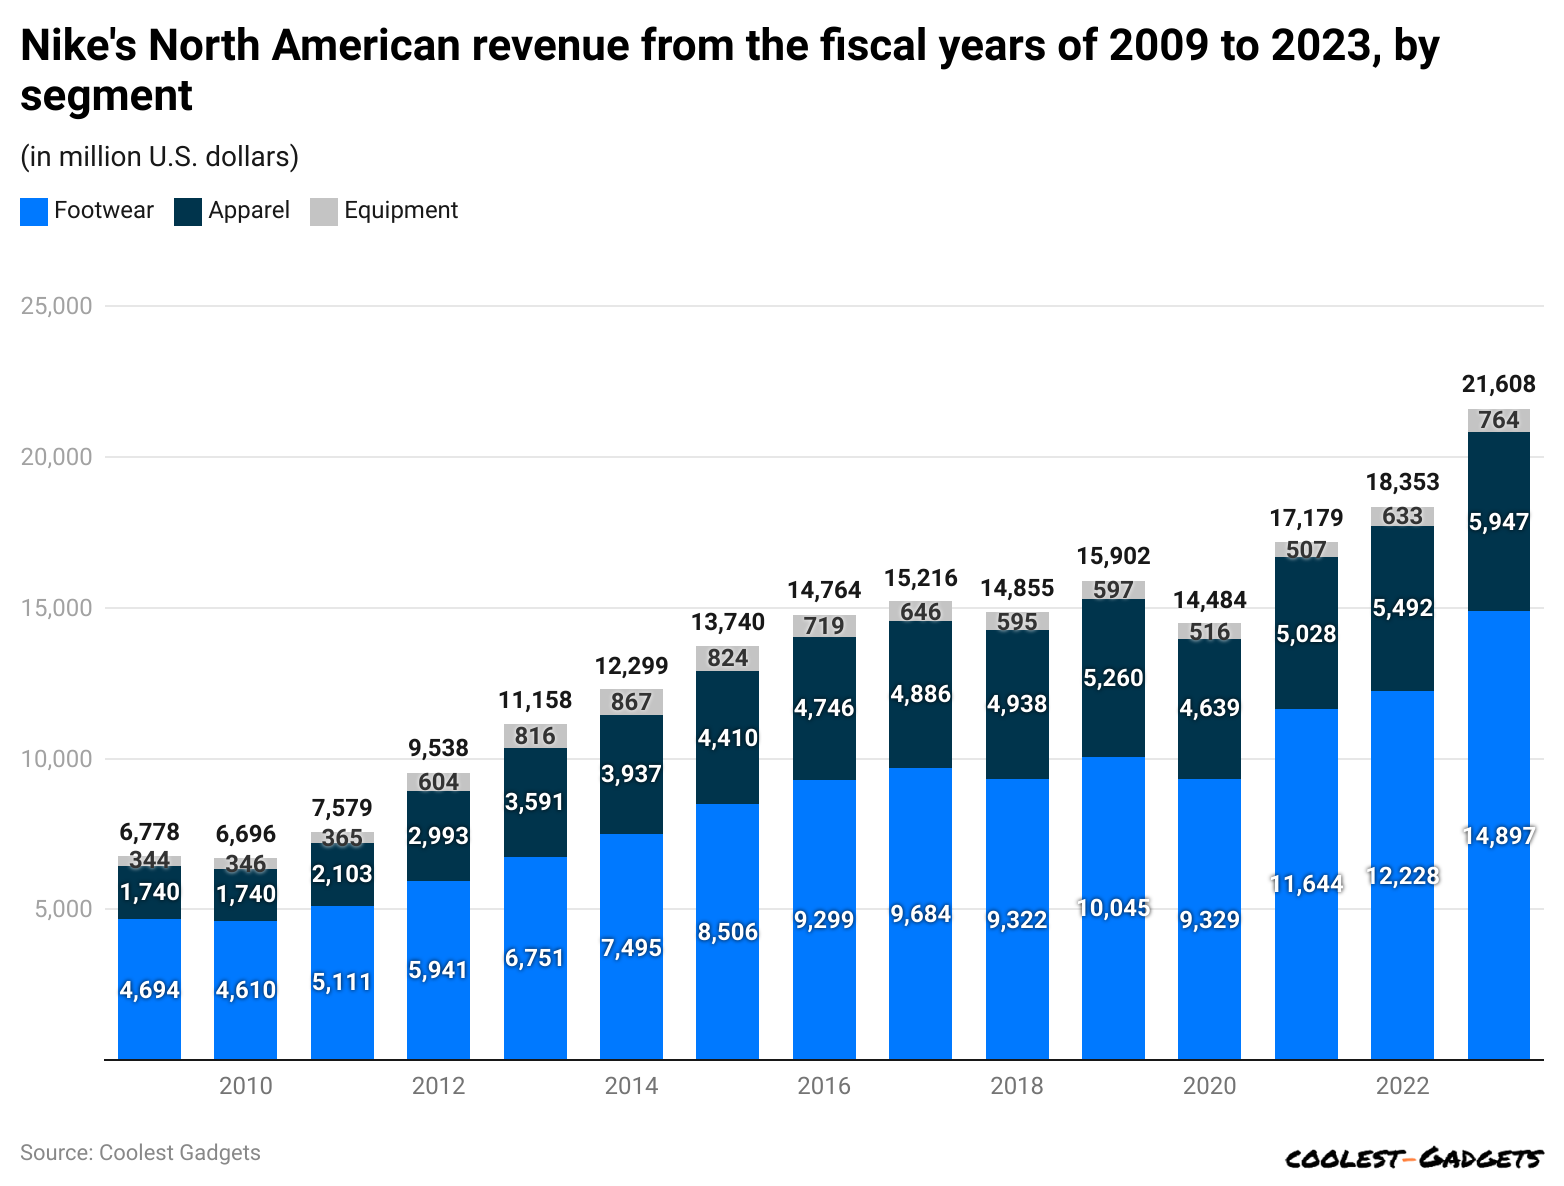
- Nike is known to be the leading supplier of athletic shoes and sports equipment in 2023 globally, accounting for $51.22 billion in revenue.
- In the North American region, the revenue generated by the company was approximately $15 billion.
- The overall market is segmented into three different product categories: Footwear, Apparel, and equipment; those accounted for $14,897 million, $5,947 million, and $764 million in revenue, respectively.
Hibbett Sports
(Reference: statista.com)
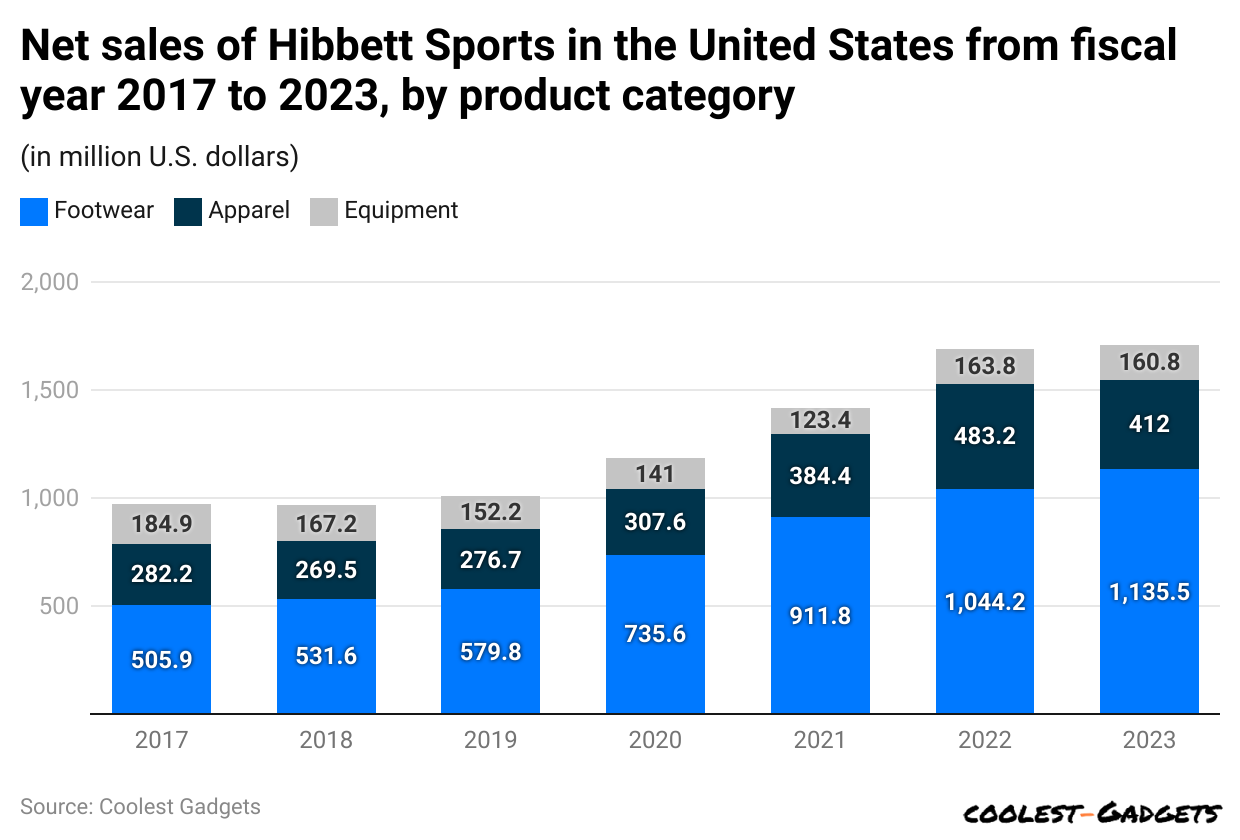
- According to Fitness Equipment Statistics, total sales of Hibbett Sports in the United States reached 17 million in 2023, an increase of 1% from the previous year.
- The revenue earned by different segments of the Hibbett sports market was footwear ($1,135.48 million), Apparel ($412.02 million), and Equipment ($160.82 million).
Sports Equipment Statistics by Revenue
(Reference: statista.com)
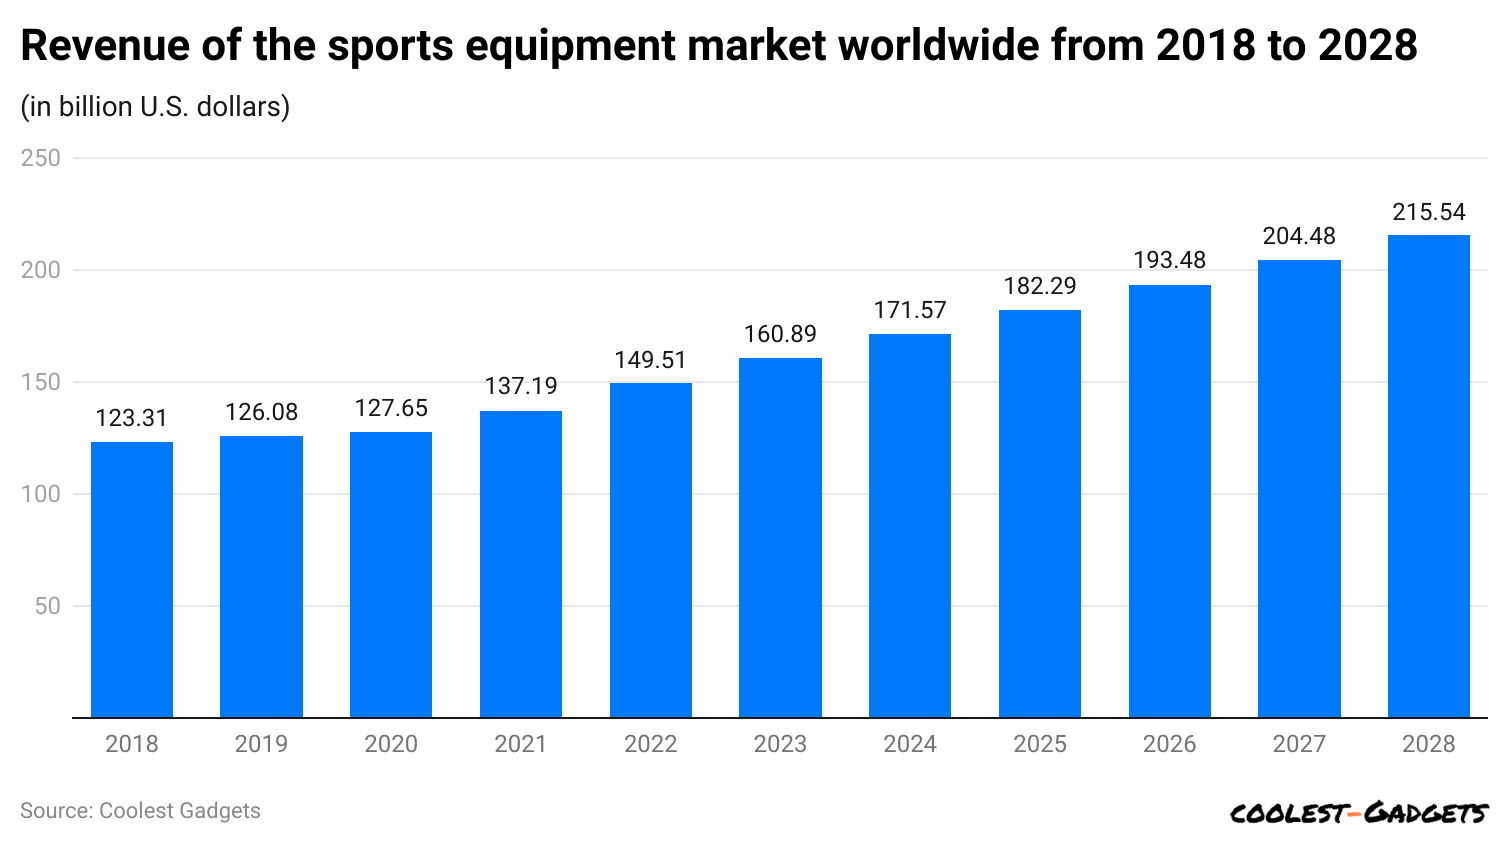
- Worldwide revenue generated by sports equipment in 2024 will reach up to $172 billion, with a CAGR of 5.86% from 2024 to 2028.
- The top revenue generator country is China, which has generated $40.1 billion in revenue.
- Meanwhile, estimated revenue in coming years is 2025 ($182.29 billion), 2026 ($193.48 billion), 2027 ($204.48 billion), and 2028 ($215.54 billion).
By Functional Fitness Equipment
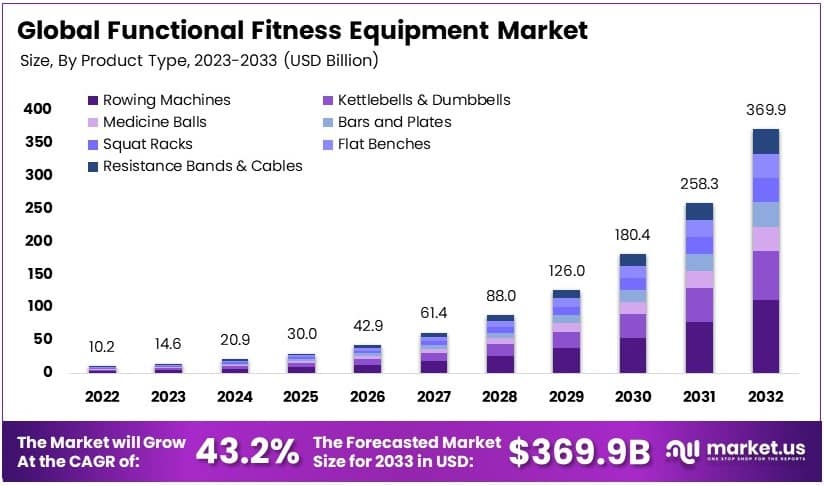
- The Global Functional Fitness Equipment Market is projected to grow from USD 10.2 billion in 2023 to USD 369.9 billion by 2033, at a compound annual growth rate (CAGR) of 43.2% from 2024 to 2033.
- Kettlebells used in this market range from 5 kg to 48 kg, catering to a variety of strength training and CrossFit exercises.
- The 2024 Health and Fitness Association (HFA) Global Report indicates that 86.8% of fitness clubs and studios anticipate membership growth, with over two-thirds expecting increases of more than 5%.
- In 2023, Japan reported a 21.4% increase in fitness club memberships, totaling 5.6 million members.
- Rowing machines led the product type segment in 2023, favored for their comprehensive full-body workout capabilities and rising popularity in home gyms.
- Health clubs were the dominant application segment in 2023, spurred by the increasing popularity of group fitness and specialized training.
- North America held a significant market share of 38.2% in 2023, supported by high gym membership rates and ongoing fitness trends.
By Virtual Fitness
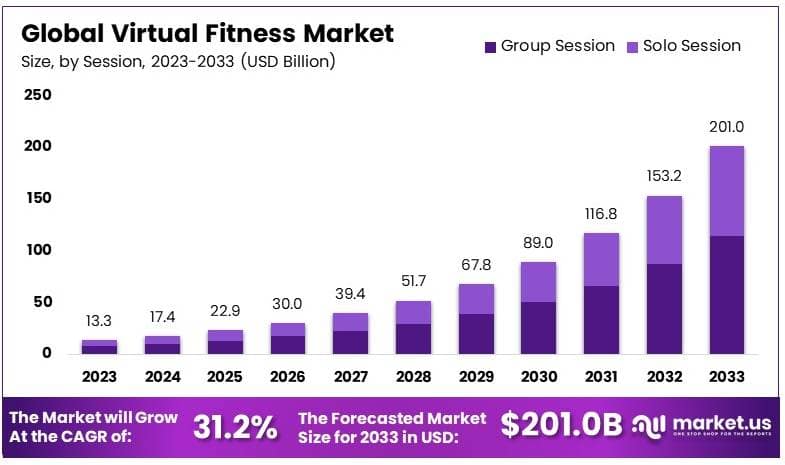
- The Global Virtual Fitness Market was valued at USD 13.3 billion in 2023 and is projected to reach USD 201.0 billion by 2033, growing at a compound annual growth rate (CAGR) of 31.2% from 2024 to 2033.
- MyFitnessPal generated approximately USD 10 million in in-app revenue in March 2022, while Fitbit and Strava generated USD 9 million and USD 5.6 million, respectively.
- About 41% of fitness enthusiasts pay for live-streamed classes via monthly subscriptions, despite the availability of free content online.
- During the COVID-19 pandemic, the percentage of Mindbody app users exercising three or more times a week increased from 75% to 78%.
- Virtual yoga sessions are booked by 32% of users, and 15.6% participate in HIIT classes.
- Group sessions accounted for 56.7% of the virtual fitness activities in 2023, emphasizing the popularity of social fitness and community engagement.
- On-demand streaming was the leading format in 2023, with 54.2% participation, allowing users flexibility in their exercise schedules.
- Smartphones were used by 32.4% of the virtual fitness market participants in 2023, underscoring the widespread use of mobile apps for fitness.
- North America led the virtual fitness market with a 48.2% share in 2023, supported by high digital fitness adoption and a tech-savvy consumer base.
By Home Fitness Equipment
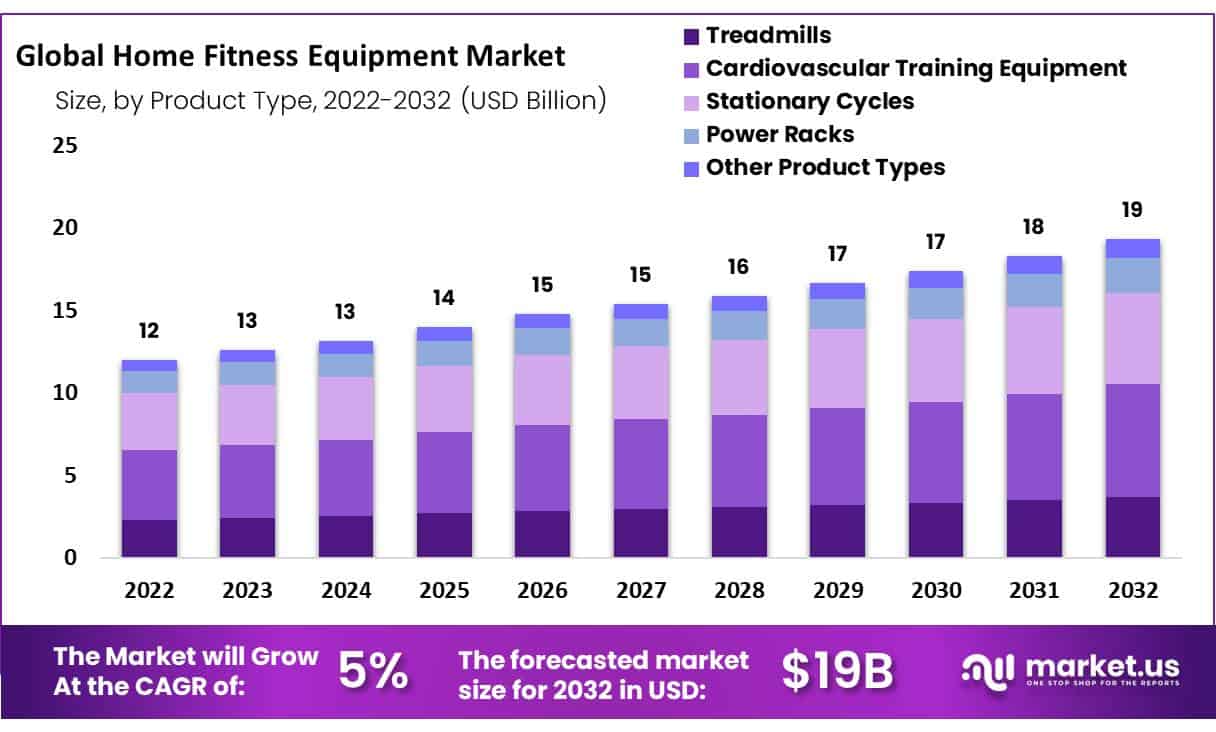
- The Global Home Fitness Equipment Market is projected to grow from USD 12 billion in 2022 to USD 19 billion by 2032.
- This market is expected to achieve a compound annual growth rate (CAGR) of 5% from 2023 to 2032.
- North America dominated the market with the highest revenue share of 43%.
- The dominance of North America in the market is expected to continue through the forecast period due to increasing health awareness among consumers and the rising adoption of exercises that enhance muscular strength, body stamina, weight management, and overall physical well-being.
Fitness Equipment Statistics by Treadmills
- The market valuation of fitness treadmills has approached $3.8 million in revenue in 2023 and will reach $6.2 million by 2030, with a compound annual growth rate of 7.2% from 2023 to 2030.
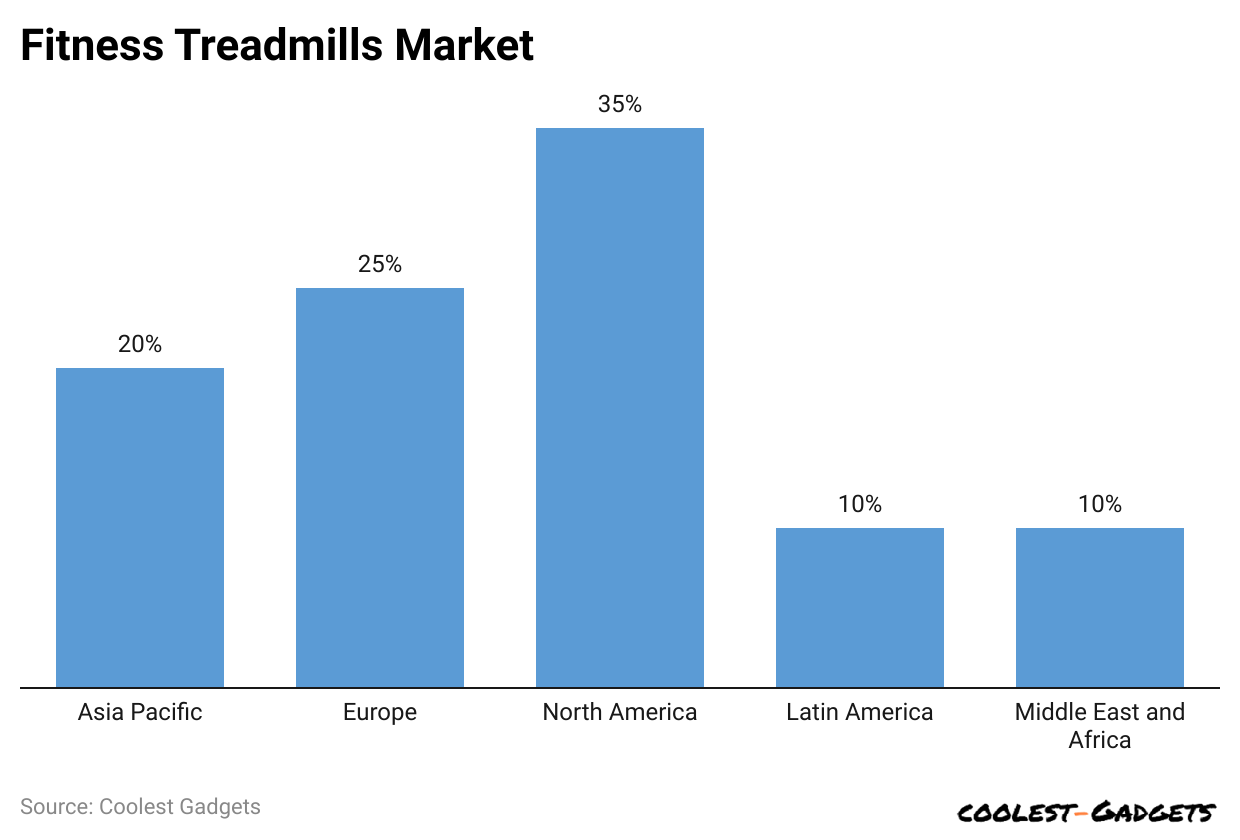
(Reference: coherentmarketinsights.com)
The above graph describes the wise market share of fitness treadmills in 2023:
- North America has the highest market share at 35%.
- Other countries are followed by Europe (25%), Asia Pacific (20%), Latin America (10%), and the Middle East and Africa (10%).
Fitness Equipment Statistics by Exercise Bike
- As per Fitness Equipment Statistics, the global upright exercise bike market generated $1.91 billion in revenue in 2023 and is forecasted to reach $2.91 billion by 2030, with a compound annual growth rate of 6.2% from 2023 to 2030.
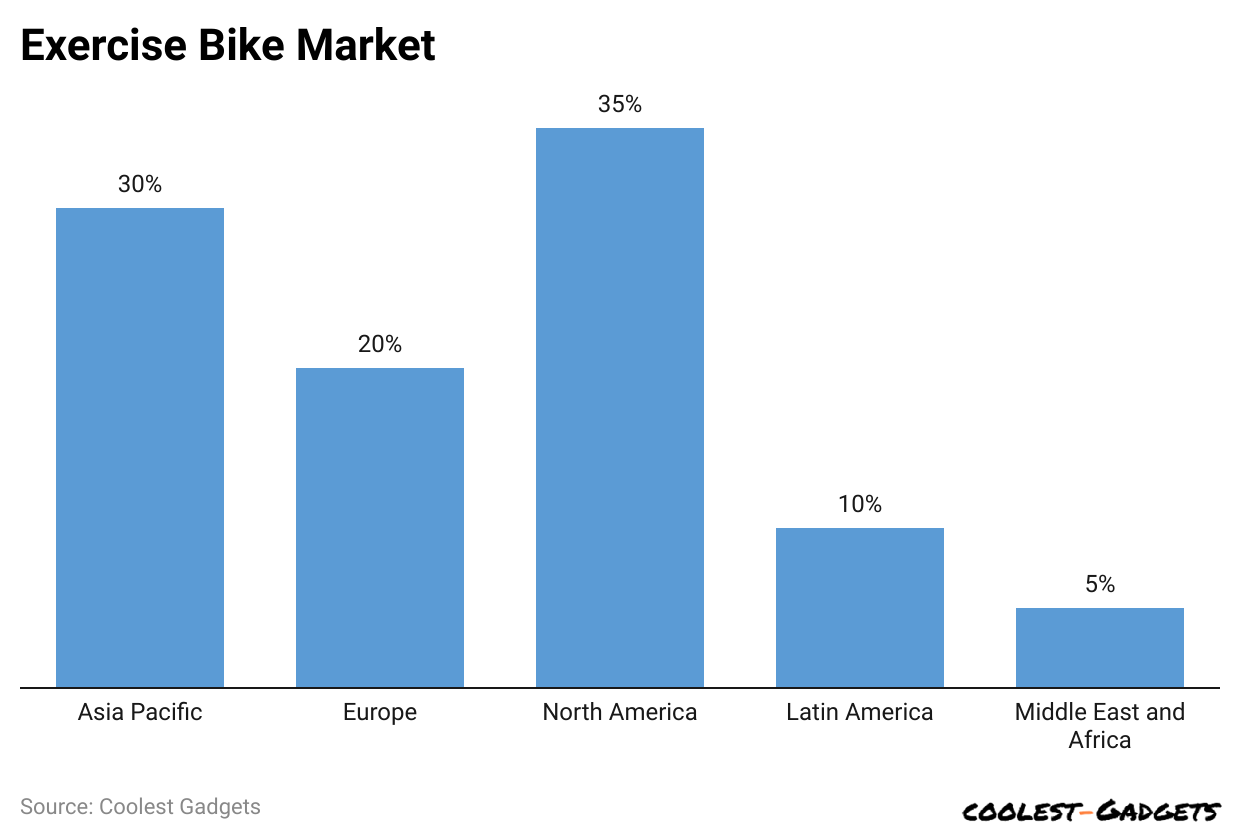
(Reference: coherentmarketinsights.com)
- In 2023, North America covered the highest market share, with 35%.
- Other is followed by Asia Pacific (30%), Europe (20%), Latin America (10%), and Middle East and Africa (5%).
Best Exercise Bikes for 2024
- Schwinn IC4 ($899)
- Peloton Bike ($1,250)
- Spinning Aero Connected Spinner Bike ($845)
- Sunny Health and Fitness SF-B1805 ($560)
Fitness Equipment Statistics By Rubber Dumbbells
- The market for rubber dumbbells generated $314.2 million in revenue in 2023 and stands out to reach $199.6 million by 2030, with a compound annual growth rate of 6.7% from 2023 to 2030.
- In 2023, North America covered the highest market share, with 36%.
- Other is followed by Europe (26%), Europe (26%), Middle East and Africa (15%), Latin America (14%), and Asia Pacific (9%).
Best Treadmills For Your Home in 2024
- NordicTrack Commercial 1750 ($1,999)
- Horizon Fitness 7.0 AT Treadmill ($999)
- Sunny Health and Fitness SF-T7603 Treadmill ($390)
- Pro-Form Carbon TLX ($999)
- Sole F80 ($1,700)
- Xterra Fitness TR150 Folding Treadmill ($394)
- NordicTrack EXP 10i ($1,499)
- LifeSpan TR5500iM Folding Treadmill ($2,799)
Best Dumbbells for 2024
- Bowflex SelecTech 552 Adjustable Dumbbells ($429)
- MX55 Rapid Change Adjustable Dumbbells ($429)
- Flybird 55 LB Adjustable Dumbbells ($349)
- Ativafit 71.5 Adjustable Dumbbell Set ($300)
Best Fitness Equipment For 2024
- NordicTrack Commercial 1750 ($2,499)
- Peloton Bike+, ($2,495)
- Hydrow Wave Rower, ($1,895)
- Schwinn Fitness 470 Elliptical ($1,299)
- Bowflex SelectTech 552 Adjustable Dumbbells ($549)
- Bowflex SelectTech 840 Kettlebell ($199)
Conclusion
The fitness equipment market has grown enormously in recent years, so it’s the best time to invest in this industry. Hundreds of fitness equipment are available in the global market, and every machine is targeted for different exercises that help strengthen our body muscles.
This article on Fitness Equipment Statistics includes adequate statistics by market share, segment analyses, types, companies, regions, usage, etc. All current trends and data will help you to get a clear idea.
Joseph D'Souza started Coolest Gadgets in 2005 to share his love for tech gadgets. It has since become a popular tech blog, famous for detailed gadget's reviews and companies statistics. Joseph is committed to providing clear, well-researched content, making tech easy to understand for everyone. Coolest Gadgets is a trusted source for tech news, loved by both tech fans and beginners.