Climate Change Impact Statistics and Facts (2025)

Updated · Apr 09, 2025


TABLE OF CONTENTS
- Introduction
- Editor’s Choice
- General Climate Change Impact Statistics
- Impacts of Recent Pledges on Climate Finance by 2025
- Most Expensive Climate Disasters, 2024
- Global Land and Ocean Temperature Anomalies
- 2024 Global Survey: Climate Change Impact Seen as a Future Concern
- Change in Ocean Heat Content from 1995 to 2024
- Northern Hemisphere Sea Ice Extent Per Month
- Southern Hemisphere Sea Ice Extent Per Month
- Sectoral Share of NDCs (Paris Agreement 2024)
- Global Investment in Renewable Energy
- Global Clean Energy Investment Statistics
- Global Climate Finance Analyses
- Losses Due to Climate Change Statistics by Scenario
- Global Capacity of Operational CCS Projects
- Estimated Annual GDP at Risk by Region and Type of Climate Hazard
- Climate Change Impact Statistics by Climate Policies in 2025
- Climate Change Impact Statistics on Human Health
- Conclusion
Introduction
Climate Change Impact Statistics: Climate change hurts our world in many ways. The Earth is getting hotter, leading to stronger storms and different weather. People, animals, and nature are all being affected. There are now more floods, fires, and dry areas than before. Most of this happens because of things people do, like using oil and gas and cutting down trees.
Scientists have found clear numbers that show how fast things are changing. These facts help us see why climate change is a big problem and why we must take action soon. This article shares facts about how climate change shapes our world and future.
Editor’s Choice
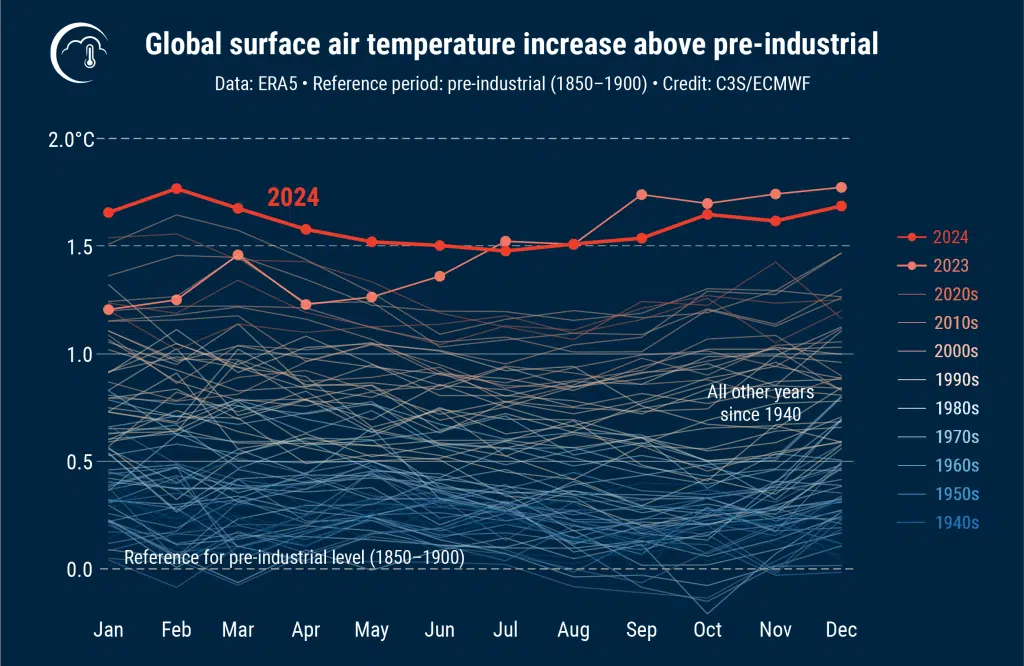
- Climate Change Impact Statistics in 2024: Earth experienced its hottest year on record, surpassing the critical 1.5°C warming threshold set by the Paris Agreement.
- Between 1970 and 2024, rainfall intensity rose by 14.6% and 10.2% in cities like Indianapolis and Philadelphia.
- Since records began, March 2025 was Europe’s warmest March, with global average temperatures 1.6°C above preindustrial levels.
- Australia recorded its hottest 12-month period up to March 2025, with temperatures averaging 1.61°C above the historical norm.
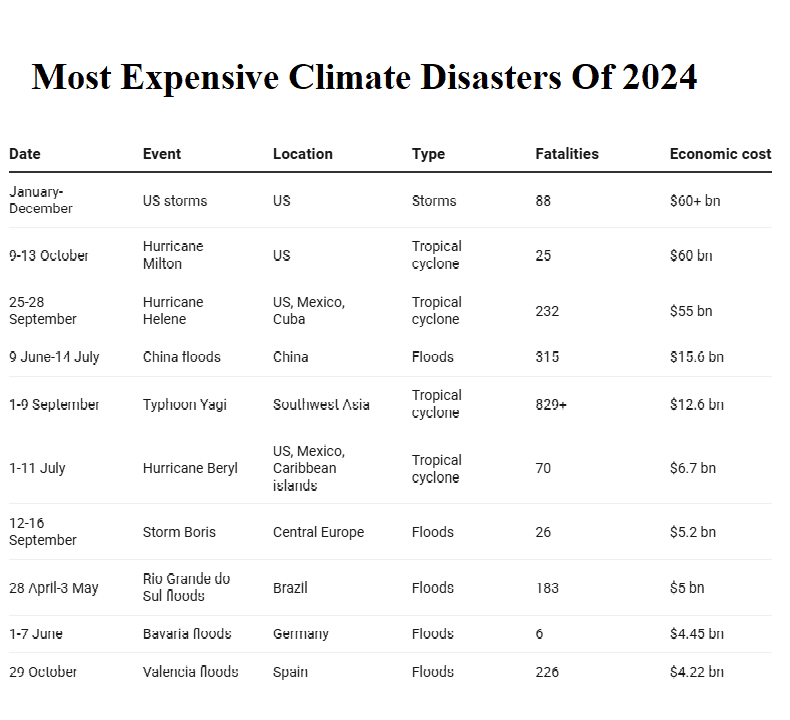
- In 2024, the U.S. experienced 27 weather and climate disasters, each causing over USD 1 billion in damages, totaling approximately USD 182.7 billion.
- At the same time, Climate Change Impact Statistics further states that tropical cyclones, floods, and droughts caused the highest number of new displacements recorded in the past 16 years.
- In July 2024, parts of Antarctica experienced temperatures up to 28°C above average, contributing to significant ice melt.
- In 2024, global CO₂ levels increased by 3.6 ppm, reaching 427 ppm, driven by fossil fuel emissions and widespread wildfires.
- By 2050, climate change might reduce the world’s economy by 11 to 14%.
- In 2024, 37% of U.S. adults said they faced extreme weather in the last two years, more than 33% before.
 (Source: earth.org)
General Climate Change Impact Statistics
- Due to heat and salt changes, the global sea surface rose about 1.3 mm each year between 2005 and 2024.
- By early 2024, the sea surface was around 26.1 mm higher than in 2005.
- In December 2024, sea ice in the Northern Hemisphere covered 11.42 million square kilometers, less than 12 million last year.
- A 2024 survey found that 23% of people worldwide think climate change impacts are too far in the future to worry about.
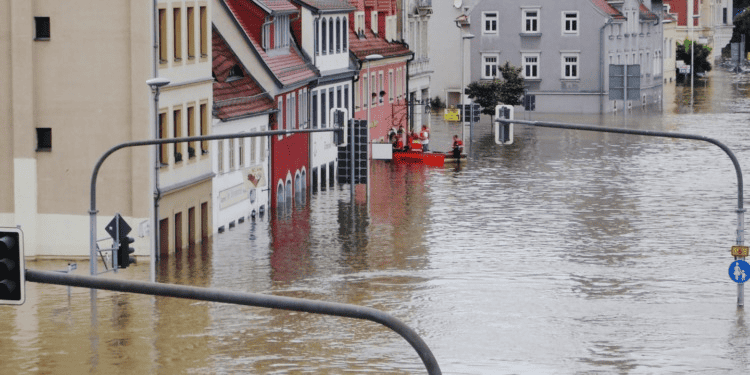
- As of 2024, natural disasters have caused a total loss of USD 368 billion worldwide.
- Meanwhile, Tropical cyclones caused the biggest damage, costing USD 145 billion, and Floods came next, with losses of USD 84 billion.
- Climate Change Impact Statistics states that in 2023, the world received 1.82 inches less rain than the average from 1901 to 2000.
- Around 29.4 million people worldwide were hurt, lost their homes, or were affected by droughts in 2023.
- At the same time, floods affected about 32 million people worldwide, injuring and causing many to lose their homes.
- Similarly, fires destroyed 11.9 million hectares of tree cover worldwide, with wildfires causing 9 million of that total.
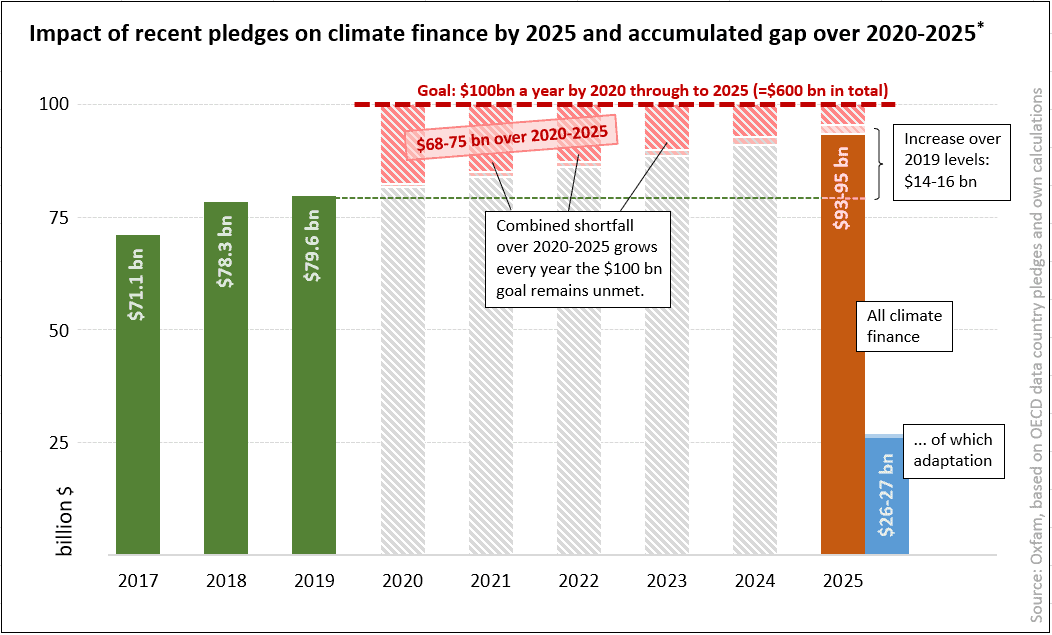
Impacts of Recent Pledges on Climate Finance by 2025
 (Source: germanclimatefinance.com)
- Developed countries likely missed their goal of giving USD 100 billion a year to climate finance by 2020.
- If climate finance grows steadily from 2019 to the expected level in 2025, the total missing amount from 2020 to 2025 could reach around USD 68 to 75 billion.
- Oxfam says that by 2025, the total may grow by USD 14 to 16 billion from 2019, reaching around USD 93 to 95 billion annually.
Most Expensive Climate Disasters, 2024
 (Source: earth.org)
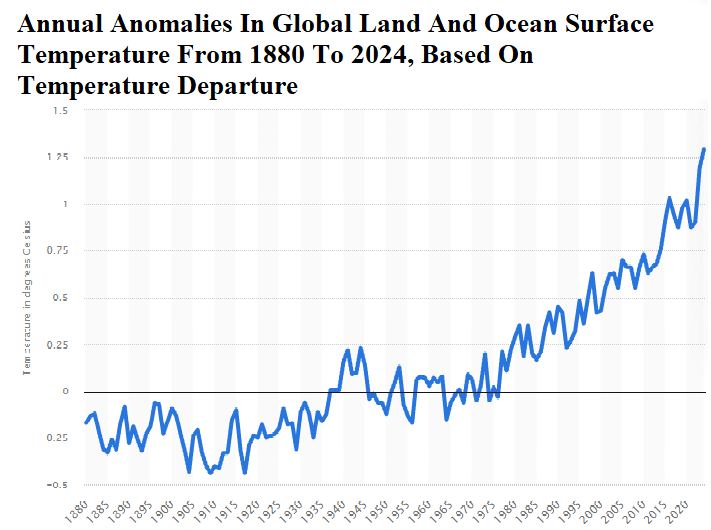
Global Land and Ocean Temperature Anomalies
 (Reference: statista.com)
- Since the 1980s, every year has been warmer than the average.
- In 2024, Earth’s land and ocean were 1.29°C hotter than the 20th-century average, the highest ever recorded, increasing from 1.19°C.
2024 Global Survey: Climate Change Impact Seen as a Future Concern
Share of respondents in different countries who agreed in 2024 that the negative impact of climate change is too far in the future to worry about:
| Country | Agreeing Respondents Share |
| United States |
32% |
|
United Kingdom |
18% |
| Germany |
22% |
|
Canada |
25% |
| Australia |
28% |
|
India |
35% |
| Japan |
20% |
|
Brazil |
30% |
Change in Ocean Heat Content from 1995 to 2024
- In 2024, oceans stored a record 214.7 zettajoules of heat in the top 700 meters, more than the year before.
| Year | Ocean Heat Content Change (0–700m) in ZJ |
| 1955 | 0 |
| 1960 | 15 |
| 1965 | 30 |
| 1970 | 45 |
| 1975 | 60 |
| 1980 | 75 |
| 1985 | 90 |
| 1990 | 110 |
| 1995 | 130 |
| 2000 | 150 |
| 2005 | 170 |
| 2010 | 190 |
| 2015 | 205 |
| 2020 | 210 |
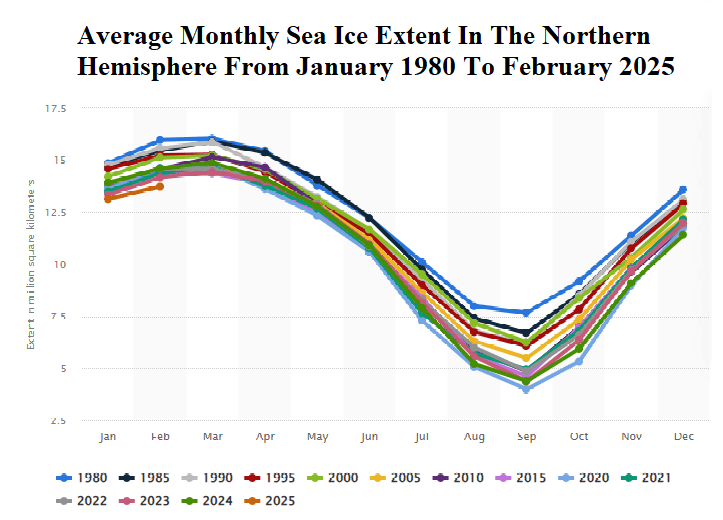
Northern Hemisphere Sea Ice Extent Per Month
 (Source: statista.com)
- Sea ice in the Northern Hemisphere grew to 13.75 million square kilometers in February 2025, up from 13.13 million in January.
- Climate Change Impact Statistics show that in December 2023, sea ice in the Northern Hemisphere covered about 12 million km²; in 2024, it was 11.42 million square km.
Furthermore, in 2024, other monthly sea ice extent in the Northern Hemisphere is stated in the table below:
| Months | Sea Ice Extent (in millions of square kilometers) |
| January |
13.92 |
|
February |
14.61 |
| March |
14.87 |
|
April |
14.12 |
| May |
12.78 |
|
June |
10.9 |
| July |
7.89 |
|
August |
5.21 |
| September |
4.38 |
|
October |
5.94 |
| November |
9.11 |
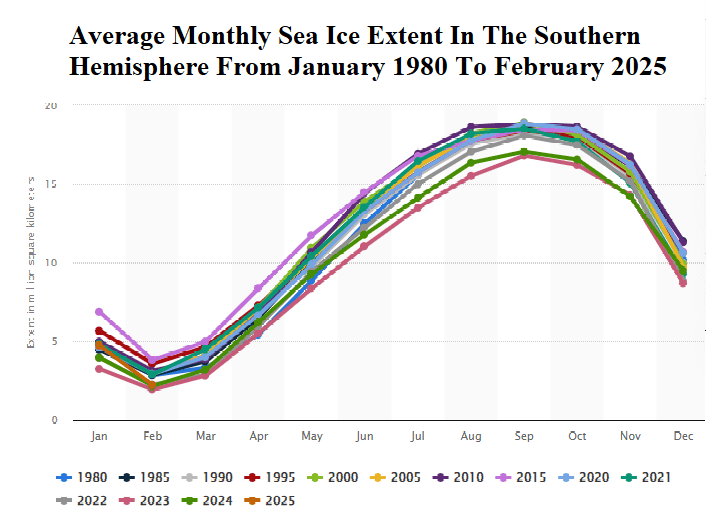
Southern Hemisphere Sea Ice Extent Per Month
 (Source: statista.com)
- In January 2025, sea ice in the Southern Hemisphere covered 4.72 million sq km; in February, it was 2.21 million sq km.
The average monthly sea ice extent in the Southern Hemisphere in 2024 is detailed in the table below:
| Months | Sea Ice Extent (in millions of square kilometers) |
| January |
3.96 |
|
February |
2.14 |
| March |
3.18 |
|
April |
6.19 |
| May |
9.27 |
|
June |
11.76 |
| July |
14.11 |
|
August |
16.34 |
| September |
17.05 |
|
October |
16.55 |
| November |
14.19 |
|
December |
9.49 |
Share of Nationally Determined Contributions (NDCs) covered under Paris Agreement 2024 by Sector
- Moreover, 81% of Parties communicated economy-wide targets, covering all or almost all sectors defined in the 2006 IPCC Guidelines.
- As of September 2024, 195 Parties to the Paris Agreement had submitted 168 new or updated Nationally Determined Contributions (NDCs).
- Specifically, 95% included mitigation measures in the energy supply sector, 89% in agriculture, forestry, and other land use (AFOLU), and 87% in transport.
Global Investment in Renewable Energy
| Year | New Investment in Renewable Energy (USD billion) |
| 2020 |
348 |
|
2021 |
430 |
| 2022 |
499 |
|
2023 |
622.5 |
| 2024 |
728 |
Global Clean Energy Investment Statistics
- Climate Change Impact Statistics reported that in 2020, the total global investment in clean energy was approximately USD 0.93 trillion.
- This figure increased to USD 1.15 trillion in 2021, representing a 23.7% growth from the previous year.
- In 2022, investments reached USD 1.43 trillion, a 24.3% increase compared to 2021.
- The year 2023 saw investments rise to USD 1.89 trillion, marking a 32.2% growth.
- Finally, in 2024, global clean energy investments amounted to USD 2.10 trillion, reflecting an 11.1% increase from 2023.
Global Climate Finance Analyses
- From July 1, 2023, to June 30, 2024, the World Bank Group gave a record USD 42.6 billion for climate projects.
- This was 44% of its total USD 97 billion funding and 10% more than the USD 38.6 billion given the year before.
- Climate Change Impact Statistics show that at COP29, leaders said rich countries need to give USD 1 to USD 1.3 trillion annually to help poorer countries fight climate change.
- Plans are being made to involve private companies and move USD 2.4 trillion yearly from rich to developing countries for climate action.
- Wealthy governments would give USD 300 billion first; the rest would come from private investors.
Losses Due to Climate Change Statistics by Scenario
- If we do nothing about climate change, it could cost the world around 2,328 trillion dollars from 2025 to 2100.
- But if we keep global warming below 1.5°C, the loss could drop to about 1,062 trillion dollars.
- This means we could avoid over 1,200 trillion dollars in damage.
- To prevent these losses, less than 300 trillion dollars would be needed worldwide from 2025 to 2050 for climate action and protection.
Global Capacity of Operational CCS Projects
The global capacity of operational commercial carbon capture and storage (CCS) projects
| Year | Number of Operational Facilities | Total Capture Capacity (Million Tonnes per Annum) |
| 2020 | 26 |
40 Mtpa |
|
2021 |
27 | 40 Mtpa |
| 2022 | 30 |
43 Mtpa |
|
2023 |
41 | 49 Mtpa |
| 2024 | 46 |
51 Mtpa |
Estimated Annual GDP at Risk by Region and Type of Climate Hazard
 (Source: statista.com)
- South Asia faces the highest risk, with approximately 12% of its GDP at stake annually by 2050 due to climate hazards.
- Sub-Saharan Africa, the Middle East, and North Africa risk losing around 8% of their GDP, primarily due to droughts and extreme heat.
- Europe and North America are comparatively less exposed, with about 2% of GDP at risk, mainly from flooding and storms.
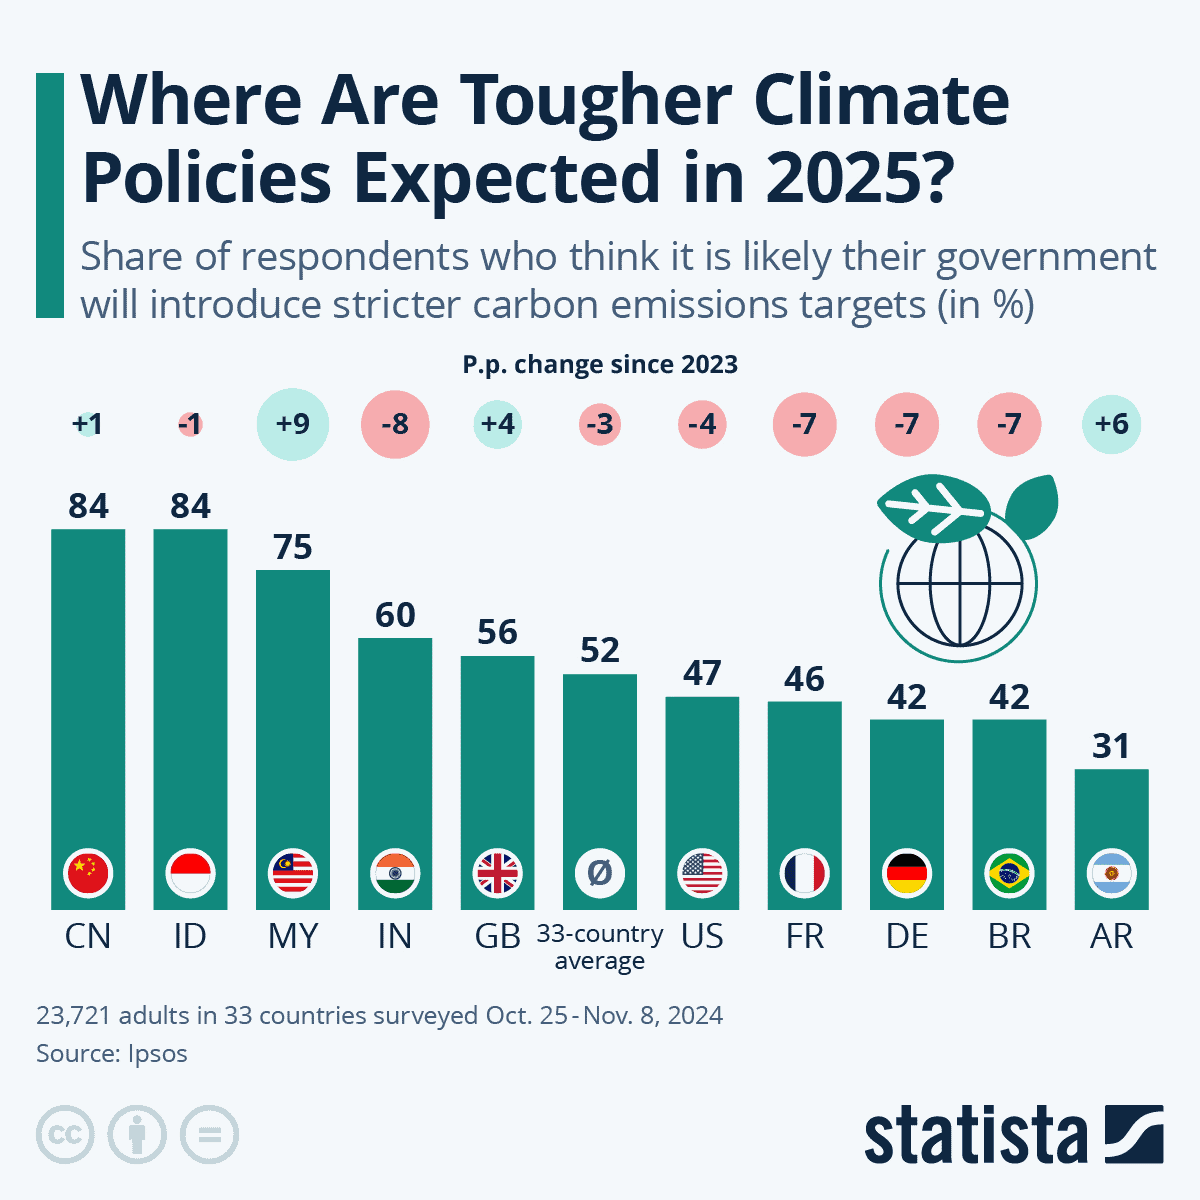
Climate Change Impact Statistics by Climate Policies in 2025
 (Source: statista.com)
- Many believe China will enact stricter rules to cut carbon emissions in 2025; around 84% of Chinese adults expect this change.
- Indonesia came next, also with 84%, followed by Malaysia (75%), Singapore (74%), the Philippines (66%), India (60%), and Thailand (59%).
- South Korea and Japan showed lower numbers, with 52% and 38% of people expecting stricter climate rules.
- In South America, fewer people believe their countries will take stronger climate action. Argentina and Peru had the lowest numbers with just 31% and 32%.
- In Chile, 43% think tougher rules are coming, 11% less than last year.
Climate Change Impact Statistics on Human Health
- From 2019 to 2023, people had about 46 extra days of dangerous heat because of climate change.
- By 2025, cities like Salt Lake City may have longer allergy seasons due to shifting weather.
- Very hot days can make more people feel sad or depressed, studies say.
- Warmer weather is helping mosquitoes spread to new places, which may raise the incidence of sicknesses like dengue, Zika, and chikungunya by 20% in 2025.
- Experts think that between 2030 and 2050, hunger, malaria, and heat could cause 250,000 more deaths each year.
- Around 3.6 billion people live in places at risk from climate change.
Conclusion
Climate change is already changing our world. The weather is getting hotter, storms are stronger, and ice is melting fast. If we wait too long, it might be harder to fix these problems. But we still have a chance. We can help by using clean energy, protecting nature, and working together.
Things like turning off lights, planting trees, and sharing the message can greatly help. What we do now will shape the future. Let’s take action today to keep the Earth safe for us and those who come after us.
Sources
FAQ.
Climate change means the Earth’s weather changes long-term, causing hotter temperatures, rising seas, and extreme weather events.
Climate change happens when pollution from cars, factories, and burning fuels traps heat, making Earth hotter.
Climate change makes weather worse, causes floods, heat, and droughts, and hurts people’s homes, health, and food supply.
People with less money or support are most affected because they cannot easily handle big problems or changes.
We can slow climate change by using clean energy, planting trees, and reducing pollution from cars and factories.
Joseph D'Souza started Coolest Gadgets in 2005 to share his love for tech gadgets. It has since become a popular tech blog, famous for detailed gadget's reviews and companies statistics. Joseph is committed to providing clear, well-researched content, making tech easy to understand for everyone. Coolest Gadgets is a trusted source for tech news, loved by both tech fans and beginners.