Battery Storage Capacity Statistics By Global Leader, Ownership and Facts

Updated · Feb 11, 2025


TABLE OF CONTENTS
- Introduction
- Editor’s Choice
- By Global Leader
- Global Utility-Scale vs Behind-The-Meter Energy Storage Capacity Share
- Battery Storage Energy Deployment By Country
- By Ownership
- Large Scale Battery Storage Capacity In US By States
- Lithium-ion Battery Storage Capacity In Demand
- US Large Scale Battery Storage
- India’s Energy Storage Landscape And Growing Potential
- Battery Storage Growth and Pipeline Expansion
- Conclusion
Introduction
Battery Storage Capacity Statistics: Batteries have now become the cornerstones in this global transition towards renewable energy; this will surely bring better energy management and increased reliability in any kind of power system. Through powering electric vehicles (EVs), these energy devices now store solar power and wind energy, and they are transforming how it is delivered and consumed.
In 2025, the battery storage market will keep up its pace because it was fueled by so many technological advances, the growing market requirement for environmentally sustainable solutions, and favorable government policies.
This article is looking for important battery storage capacity statistics in 2025 to present the numerical figures, percentages, and dollar values with simple language so that the information will be available to everyone.
Editor’s Choice
- According to battery storage capacity statistics, By 2024, the total global battery storage generating capacity is expected to be about 126 gigawatt-hours (GWh), by the effect of rapidly spurred green technology adoption.
- China and South Korea are anticipated to account for almost 50% of the global battery storage capacity.
- By 2024, utility-scale energy storage-related generation capacity is estimated to constitute about 34% of total global energy storage as investments pour into large-scale systems.
- U.S. tops in deployment of battery storage with 20.5 GWh. It is followed by China (10 GWh), Japan (8.3 GWh), Australia (6.6 GWh), and Germany (4.3 GWh).
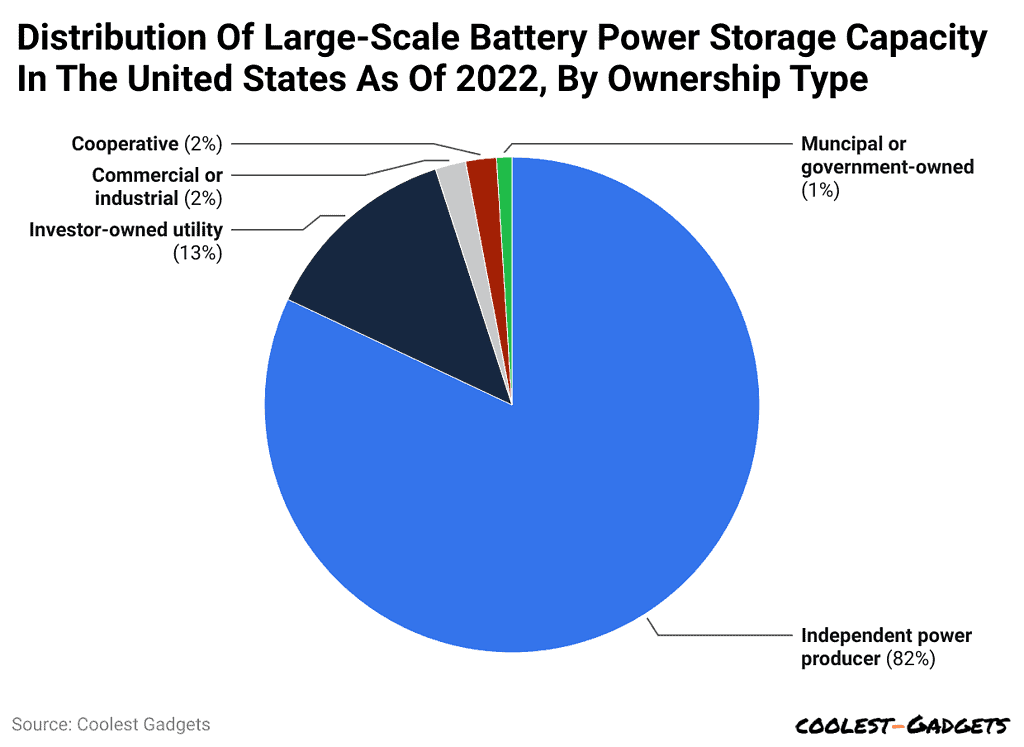
- In the U.S., 82% of the large-scale battery storage capacity was owned by independent power producers by 2022, while investor-owned utilities (IOUs) had an ownership stake of 13%.
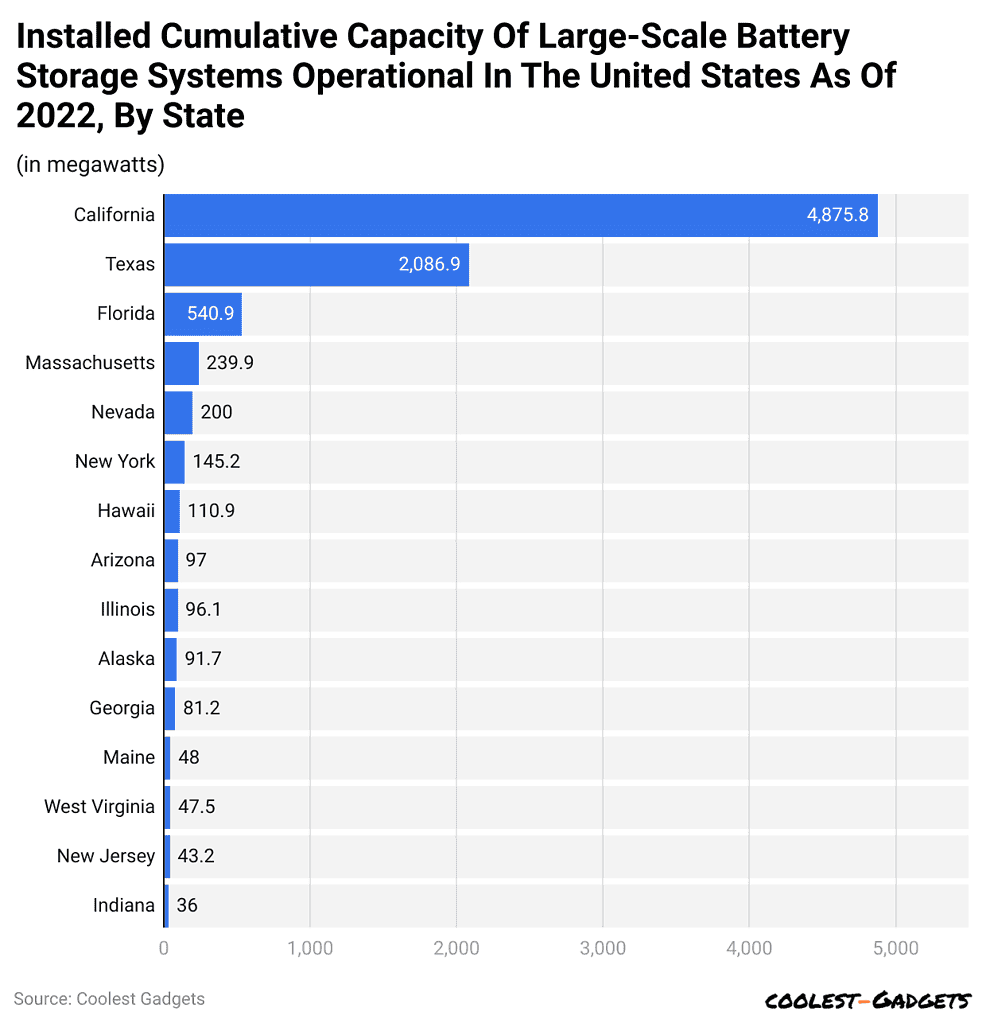
- Battery storage capacity statistics reveal that California leads the U.S. states with 4.9 gigawatts (GW) of large-scale battery storage, which is more than half the total for the nation, with Texas coming second with 2 GW.
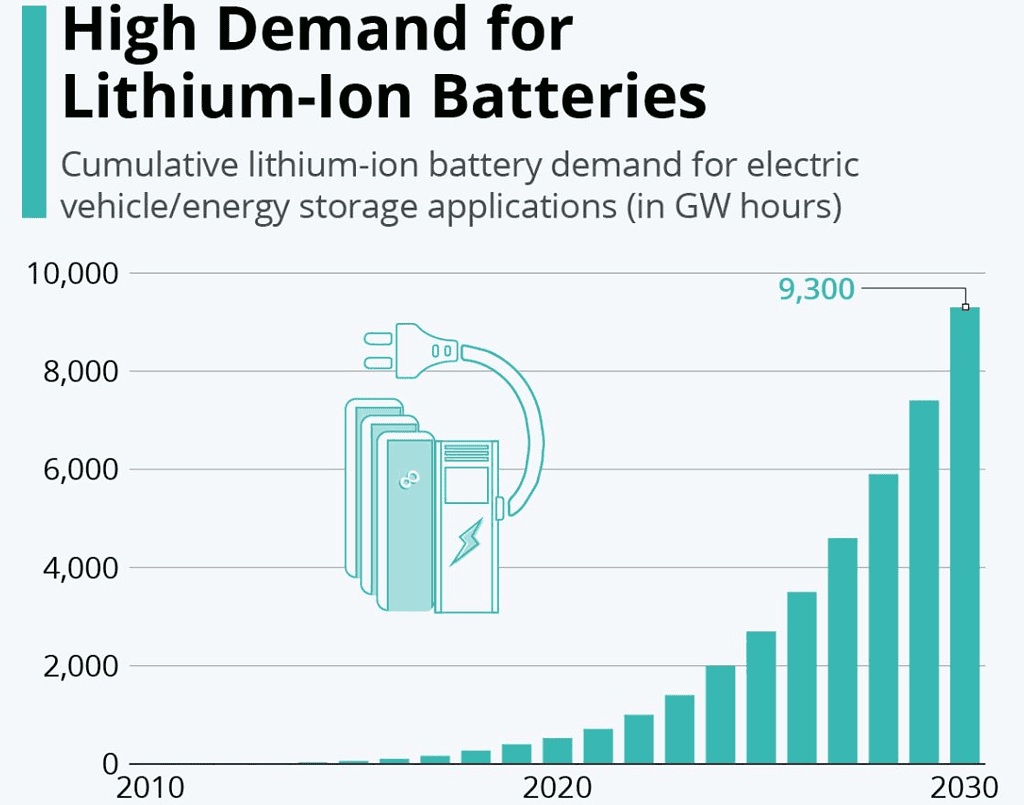
- Lithium-ion battery consumption rose between 2010 and 2020 from 0.5 GWh to 526 GWh. Forecasts call for that figure to reach 9,300 GWh by 2030.
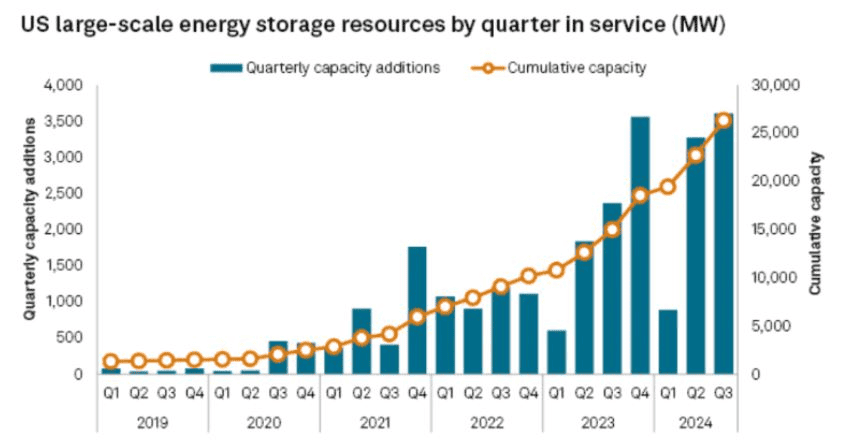
- By November 2024, 9.2 GW of lithium-ion battery storage has been added in the U.S., setting a new record for that country in lithium-ion battery storage.
- By the end of 2024, the United States would have had a cumulative battery storage capacity of 26.3 GW, most of which have one to four hours of design discharge duration.
- In July 2024, the Gemini Solar Plus Storage Project in Nevada became operational, which combines a 690-MW solar farm and a 380-MW/1,416-MWh battery system.
- Battery storage capacity statistics show that India had installed 219.1 MWh/111.7 MW BESS capacity by March 2024, commissioning 120 MWh/40 MW during the first quarter of 2024.
- By March 2024, solar and wind contributed 28.9% to India’s total electricity capacity. This led to the growing need for large-scale energy storage.
- The Indian Viability Gap Funding (VGF) program proposes to set up 4 GWh of BESS with project costs of INR 37.6 billion.
- Chhattisgarh represents 54.8% of the cumulative BESS capacity in India.
- By March 2024, India achieved a total operational pumped hydro storage capacity of 3.3 GW, the larger portion of which is located in Telangana and West Bengal.
- India has 1.6 GWh/1 GW of stand-alone BESS, 9.7 GW of renewable + energy storage, and 78.1 GW of pumped hydro projects under development.
- Of the States, Rajasthan leads in standalone BESS development, propelled by renewable energy policy and storage obligations up to 2030.
- The Indian government, as of March 2024, floated tenders that accounted for 57 GW of energy storage, including 7.4 GW of tenders that were floated in Q1 2024 alone.
- Battery storage capacity statistics state that beginning in Q3 2024, the U.S. erected construction on 14.2 GW of new battery power capacity with 6.4 GW destined for completion by the close of 2024.
- The U.S. pipeline for battery storage would make up 143 GW in capacitated non-hydro energy storage projects that are projected before 2030, with each distribution as follows: 43.6 GW in 2025, 37.3 GW in 2026, and 33.8 GW in 2027.
- The International Energy Agency (IEA) has indicated that the total storage capacity will have to increase six times to 1,500 GW by 2030 to be able to achieve net-zero emissions, with batteries accounting for 90% of this expansion.
You May Also Like To Read
- Electric Vehicle Statistics
- Electric Scooters Statistics
- Self-Driving Cars Accident Statistics
- Scooter Statistics
- Electric Scooters Statistics
- Train Statistics
- Car Rental Statistics
- Trucking Industry Statistics
- Airlines Statistics
- Electric Vehicle Adoption Statistics
By Global Leader
 (Reference: statista.com)
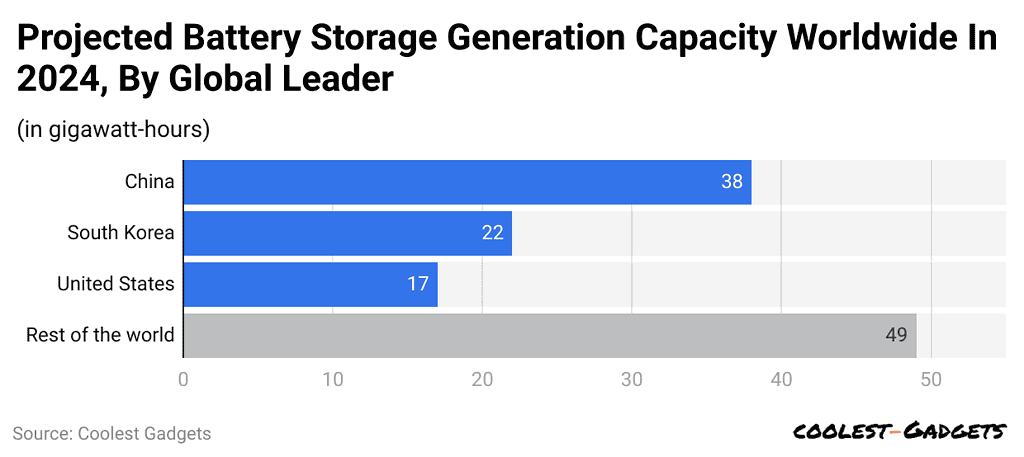
- Battery storage capacity statistics show that By the year 2024, the amount of battery storage generating capacity worldwide is expected to reach as high as 126 gigawatt-hours.
- This is a reflection of the fast-moving pace of green technology adoption around the globe.
- China and South Korea will continue to dominate this industry and account for almost 50% of the total generation capacity worldwide.
- This dominance demonstrates significant investments in battery technology accompanied by a commitment to sustainable energy advancement in both countries.
 (Reference: statista.com)
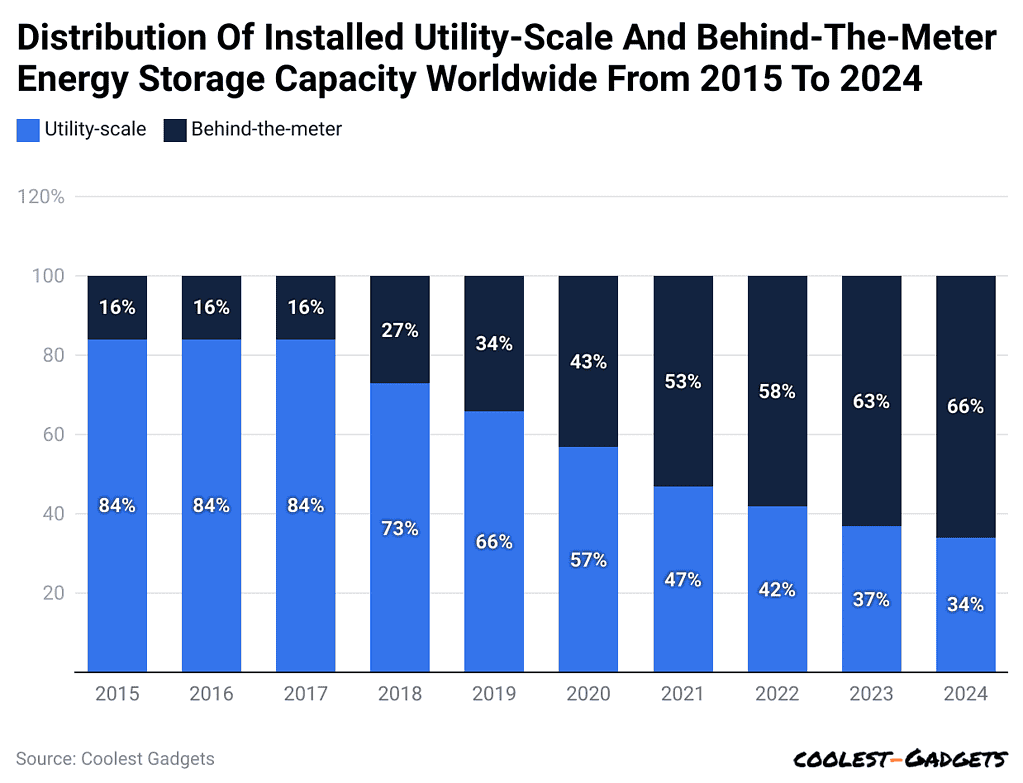
- Energy storage capacity in 2015 and 2016 was distributed as utility-scale and behind-the-meter systems, jointly meeting energy demand.
- Battery storage capacity statistics show that over the years, the mix has evolved, and by 2024, projections show that utility-scale energy storage will form 34% of the estimated total global energy storage.
- This highlights significant growth and investments in large-scale energy storage systems, which are an absolute necessity for power grids, renewable energy integration, and peak electricity demand management.
- In this case, most of the behind-the-meter storage will continue being at residential and commercial levels, reflecting a growing trend toward local energy solutions.
Battery Storage Energy Deployment By Country
 (Reference: statista.com)
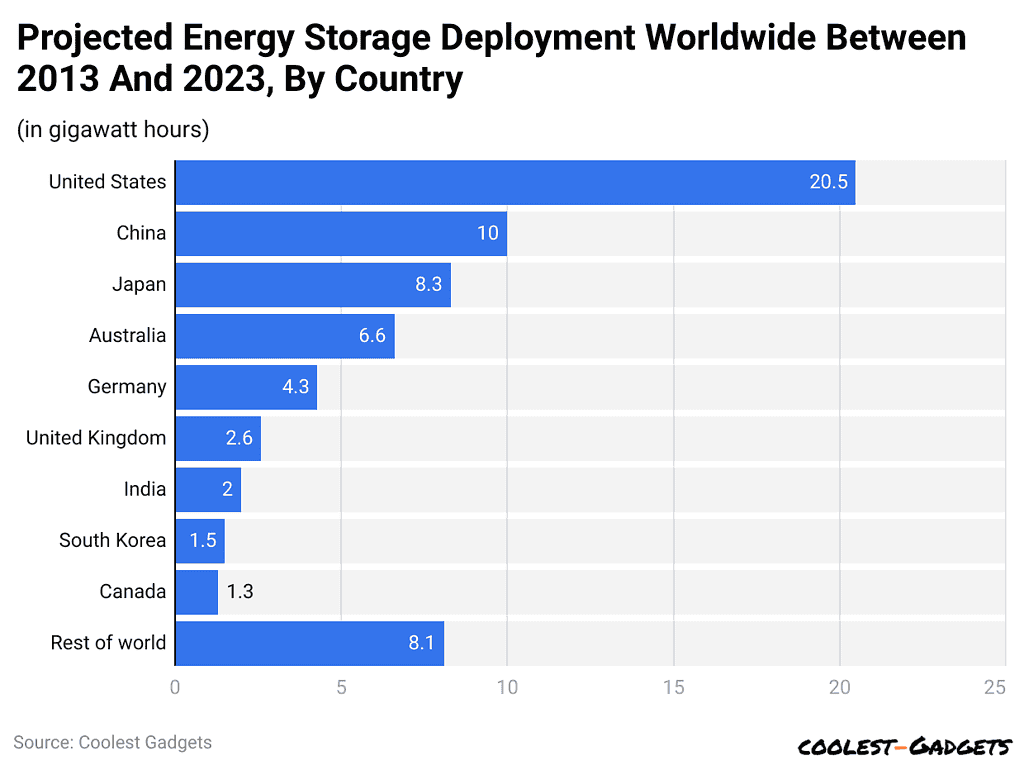
- The global deployment of battery storage energy capacity varies dramatically by country across the globe.
- Battery storage capacity statistics indicate that the United States is on top with 20.5 gigawatt-hours (GWh) deployed, followed closely by China with 10 GWh and Japan with 8.3 GWh.
- Australia has deployed 6.6 GWh, while Germany remains at 4.3 GWh. The United Kingdom accounted for 2.6 GWh, India 2 GWh, and South Korea 1.5 GWh.
- Canada itself has deployed 1.3 GWh. The remainder of the world adds up to another 8.1 GWh.
- These figures signal, in any particular country, the extent to which battery storage solutions have been embraced globally for their specific energy demands and policies.
By Ownership
 (Reference: statista.com)
- According to battery storage capacity statistics, Independent power producers in 2022 held an 82% share of ownership of large-scale battery storage capacity in the United States, with investor-owned utilities (IOUs) coming second, having added 13% of the current power capacity in large-scale battery storage.
- Included in this are companies such as the California Independent System Operator (CAISO), as, in addition to power generation, CAISO holds functions concerning the management and distribution of power within its facilities.
Large Scale Battery Storage Capacity In US By States
 (Reference: statista.com)
- California led the states in the United States in large-scale battery storage, with almost 4.9 gigawatts in capacity, which accounts for more than half of the total battery storage in the U.S.
- Texas came in second, with an operational battery storage capacity of as much as 2 gigawatts, demonstrating the increasing energy storage potential in the two states.
Lithium-ion Battery Storage Capacity In Demand
 (Source: statista.com)
- The battery storage capacity statistics show how the cumulative demand has risen through the years and now is gearing up for a growth spurt.
- According to the analysis by Bloomberg Lehman Brothers, demand leaped from a mere 0.5 gigawatt-hours in 2010 to approximately 526 gigawatt-hours by 2020.
- The projections anticipate demand will then shoot up to a staggering 9,300 gigawatt-hours by 2030.
- Such an increase in demand could mean tens of millions of new electric vehicles, energy storage units, and consumer devices worldwide.
- Energy companies like Exxon Mobil have been exploring this technology for decades for applications mainly geared toward automotive purposes, but without a doubt, they have also benefited many consumer tech products due to this technology.
- All of these factors- increased demand and decreasing prices are expected to spur growth in the electric vehicle market in the coming years, but the broad-scale impact on industries is still open to debate.
- Energy storage, in particular, stands to gain considerably from cheaper batteries.
- Affordable storage solutions could turn the entire method in which electricity grids operate into a more effective means to store vast amounts of energy and deploy them for various purposes.
US Large Scale Battery Storage
 (Source: carboncredits.com)
- Battery storage capacity statistics reveal that the U.S. saw large-scale lithium-ion battery storage installations exceeding even last year’s record of 8.4 GW, according to S&P Global data, in 2024.
- Up to November 25, 2024, developers had added 9.2 GW for a record new construction in the industry. This includes 3.6 GW recorded in the just-ended third quarter, representing a 52.5% increase compared with the same period in 2023.
- Consequently, the entire nation’s battery storage increased to 26.3 GW. Most of the battery systems installed are designed to discharge between 1 and 4 hours and are frequently combined with solar farms.
- These hybrid systems provide the dual value of renewable power generation as well as energy in peak demand periods or in times of low solar production.
- Among the major projects commissioned in 2024 is the Gemini Solar Plus Storage Project, located in Nevada and developed by Quinbrook Infrastructure Partners.
- Since July, the facility has been fully operational. It combines a 690-MW solar farm with a 380-MW/1,416-MWh battery system to be used by the utility under a 25-year agreement with NV Energy to enhance grid reliability as well as renewable energy integration.
India’s Energy Storage Landscape And Growing Potential
- India, as of March 2024, has achieved a cumulative installation of 219.1 MWh of battery energy storage systems (BESS), equivalent to 111.7 MW.
- According to battery storage capacity statistics by Mercom India titled “India’s Energy Storage Landscape,” during the first quarter of 2024, the country added an astonishing 120 MWh or 40 MW of BESS capacity alone.
- Most interestingly, it shows that 90.6% of the total BESS capacity installed has been associated with a PV-system and battery-storage combination, thus indicating the significant impact these technologies, along with wind energy, have on India’s energy storage developments.
- Meanwhile, the report also discusses other issues displayed by this report, such as the current state of energy storage across India and the key states responsible for energy storage capacity development.
- Among other things, the report deals with tariff trends, pipeline as well as installed capacity of standalone BESS projects and renewable energy as well as BESS and pumped storage initiatives.
- These battery storage capacity statistics emphasize that the rapid expansion of intermittent renewable energy sources such as solar and wind has proven to greatly affect the stability of the grid.
- As of March 2024, the contribution of electricity capacity by solar and wind is pegged at 28.9% of India’s total electricity capacity.
- Policies are already on the ground to allow for efficient integration of renewables while ensuring grid stability, such as deviation settlement mechanisms, grid connectivity regulation, and ancillary service regulations, which in turn fuel the demand for utility-scale energy storage solutions.
- Under India’s Viability Gap Funding (VGF) scheme, 4 GWh of BESS will be installed by an allocated budget of INR 37.6 billion (US$452 million).
- BESS presently has the highest installation, amounting to 54.8% alone in total installed BESS capacity in the state; it is further extended by the Central Electricity Authority (CEA), which states that pumped hydro storage capacity in operation across India stands at a total capacity of 3.3 GW by March 2024.
- Most of the installed capacity is confined to states such as Telangana and West Bengal. At the same time, there are 1.6 GWh/1 GW standalone BESS, 9.7 GW renewable energy+energy storage, and 78.1 GW pumped hydro projects at various stages of development: surveying/investigating under 60 GW and in active development with 18.1 GW.
- Rajasthan is the most active in terms of stand-alone BESS development backed by conducive policies in the renewable energy framework for the state’s annual energy storage obligations through the fiscal year 2030.
- Under the ever-growing demand for energy sufficiency from renewables, the government agencies issued tenders for 57 GW energy storage and auctioned 11.5 GW energy storage projects as of March 2024.
- Only in Q1 2024, tenders for standalone renewable and renewable projects with storage hit 7.4 GW in all.
Battery Storage Growth and Pipeline Expansion
- The momentum continues in the United States battery storage sector, characterized by a considerable pipeline of ongoing projects.
- Indeed, some 14.2 GW of new battery power capacity has been under construction by developers by the third quarter of 2024, alongside 2 GW under advanced development stages.
- battery storage capacity statistics state that more than 6.4 GW of this capacity is due for completion before the close to 2024, though actual commissioning timelines often stretch beyond initial estimates.
- To look ahead, however, the U.S. battery storage market has planned a pipeline of 143 GW of planned non-hydro energy storage projects through 2030.
- Some of the notable future-by-year targeted installations are 43.6 GW in 2025, 37.3 GW in 2026, and 33.8 GW in 2027.
- Such aspirations convey how rapidly changes are taken into account in an industry and its encouraging part in energy transition.
- Costs are rapidly falling, and adoption is speeding forward, making battery storage a crucial element in the energy transition.
- Major companies are expanding their portfolios of products to meet burgeoning demand stemming from the increasing energy required for artificial intelligence (AI) and data center activities.
- These three industries would dramatically increase energy consumption and further drive the global battery storage market.
- Electric vehicles (EVs) are another critical driver expected to displace millions of barrels of oil daily by 2030. The increased need for energy storage on a large scale will follow this change in the power sector.
- According to battery storage capacity statistics by the International Energy Agency (IEA), achieving net-zero emissions by 2030 would mean that energy storage capacity must rise sixfold, reaching 1,500 GW globally.
- Of this growth, batteries are expected to be about 90%, growing almost 14 times to 1,200 GW, while pumped storage and compressed air provide additional support and uplift.
- The increasing reliance on battery storage explains how critical battery storage is in enabling a sustainable, low-carbon energy future.
Conclusion
Battery storage is a prominent component in modern energy, and battery storage capacity statistics in 2025 indicate its unprecedented growth and disruption potential. By investing in high-tech and bringing innovative business models, the world made greater leaps toward a cleaner greener future.
Sources
FAQ.
By 2024, the global battery storage network is expected to grow by approximately 126 Gigawatt Hours (GWh) capacity, nurtured by innovations in green technology, improvements to renewable energy solutions, and a conducive government policy environment.Batteries Or Storage Capacity And Their Strength-Releasing Countries In 2024, China and South Korea would be nearly half of the world’s battery storage. The U.S. follows with the most deployment at 20.5 GWh while others like Japan, Australia, and Germany also count over the world’s total storage.
By 2024, the US will hold the lead in large amounts of battery storage deployment, with 20.5 GWh installed. California is the major state in the U.S. hosting almost 4.9 GW of large-scale battery storage followed by Texas at 2 GW.
The demand for lithium-ion batteries has increased significantly moving from 0.5 GWh in 2010 to approximately 526 GWh by 2020. Forecasts further state that it could reach a height of demand of 9,300 GWh by 2030, driven largely by electric vehicles, energy storage systems, and consumer electronics.
As of March 2024, India had installed 219.1 MWh of battery energy storage capacity. Solar and wind contributed 28.9% of the total electricity capacity of the country. The Indian government is supporting energy storage development by several policy measures, including the Viability Gap Funding (VGF) scheme, which intends to add 4 GWh of storage.
Joseph D'Souza started Coolest Gadgets in 2005 to share his love for tech gadgets. It has since become a popular tech blog, famous for detailed gadget's reviews and companies statistics. Joseph is committed to providing clear, well-researched content, making tech easy to understand for everyone. Coolest Gadgets is a trusted source for tech news, loved by both tech fans and beginners.