Mobile Device Usage Statistics By Users, Demographic and Addiction

Updated · Apr 08, 2025


TABLE OF CONTENTS
Introduction
Mobile Device Usage Statistics: The first smartphone was introduced in 1992, marking the beginning of a new era in how people communicate and utilize technology. Jump to 2025, and now 5.28 billion people use smartphones—about 60.42% of the world’s population. On average, people spend 4 hours and 37 minutes on their phones every day.
Approximately 7.43 billion smartphones are in use worldwide, which is expected to surpass the global population soon. The Mobile Device Usage Statistics reveal how deeply these devices have integrated into our daily routines and how they keep the world more connected than ever.
Editor’s Choice
- People spend about 3 hours and 45 minutes daily using the Internet on their smartphones.
- Currently, there are approximately 4.69 billion smartphone users worldwide, and that number is expected to grow to around 5.83 billion by 2028.
- In the United States, most smartphone users also spend about 3 hours and 45 minutes daily using mobile apps.
- The time American adults spend on smartphones has increased—from 3 hours and 38 minutes in 2021 to 4 hours and 2 minutes in 2025.
- There are currently around 6.84 billion smartphones in use worldwide. Over the past five years, smartphone users have increased by at least 5% annually.
- There are also more than 10.47 billion Internet of Things (IoT) devices worldwide, showing how connected people and technology have become.
- Mobile Device Usage Statistics indicate that China has the largest smartphone users worldwide, while Germany has the highest smartphone usage per person.
- People who graduated from college are the most likely to own a smartphone.
- Globally, Android is the most widely used mobile operating system, with the largest user base.
General Mobile Device Usage Statistics
- Around 45% of students say they’re always online—even when they’re in class. Approximately 49% of students get distracted by their phones during school, and 20% admit to using them for activities unrelated to learning.
- Almost 47% of parents think their kids are hooked on their phones and other devices.
- In 2022, smartphones were the second-most used electronic device in the U.S. That same year, 53% of Americans reported not going a full day without using their smartphone.
- By 2023, about 93% of college graduates in the U.S. will own a smartphone.
- Also, in 2023, 2 billion people were using the Internet on their smartphones, making up 58.14% of all internet users worldwide.
- In 2021, among users between the ages of 18 and 34, about 58% preferred using an iPhone over other brands.
- Some people even turn off their phones completely to stay focused and not get distracted.
- As of January 2023, Apple iPhones comprise 27.6% of all smartphones used worldwide.
- In 2022, 1.747 billion smartphones were sold globally, with the iPhone 12 being the most popular model.
- Mobile Device Usage Statistics indicate that 1 in 4 internet users made online purchases using their phones.
- In 2023, according to smartphone usage stats, Samsung was the top smartphone brand in Africa.
- France had the highest smartphone usage based on population, with 83.6% owning one.
- By 2023, about 6.92 billion people, 85.74% of the global population, will own smartphones. That number is expected to grow to 7.13 billion in 2024 and reach 7.33 billion by 2025, covering roughly 90.33% of the world’s population.
Time Spent on Mobile Device Statistics
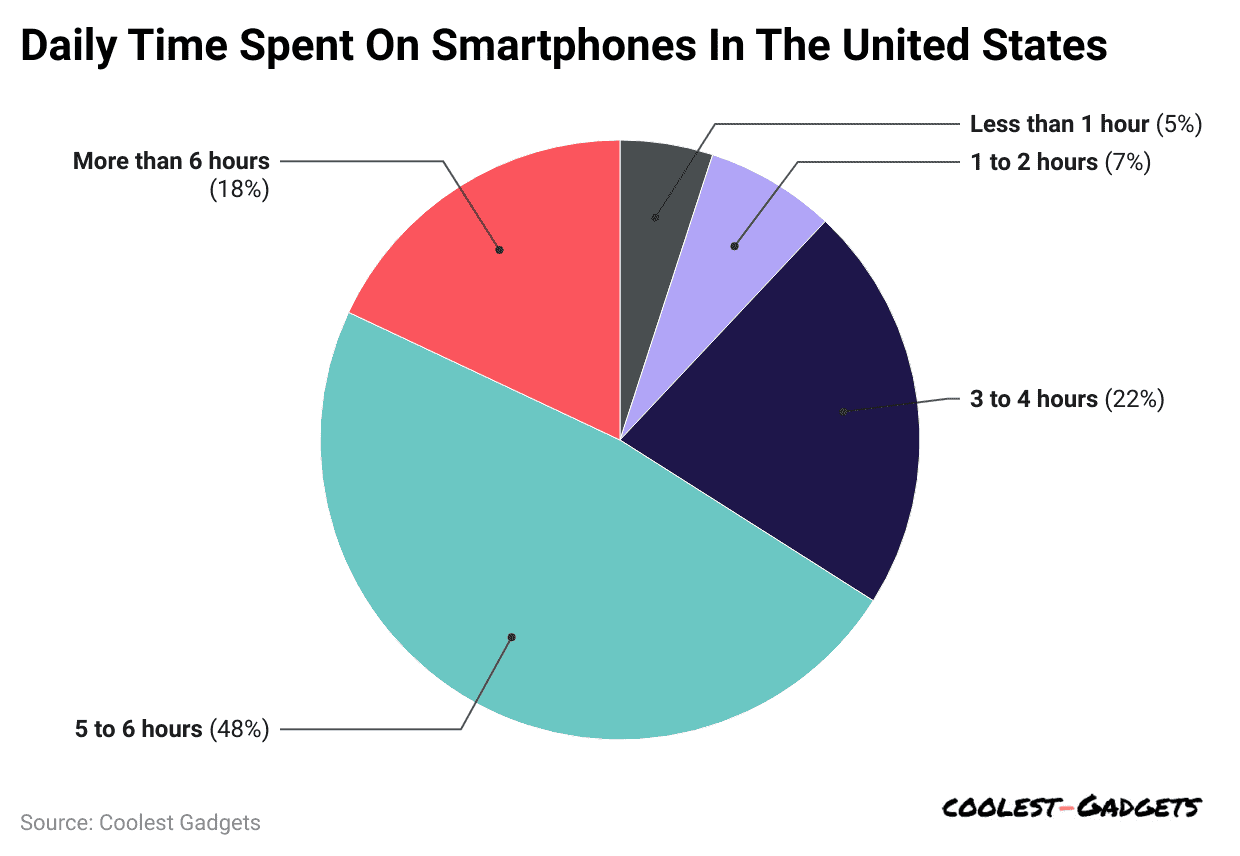
- In the U.S., around 50% of smartphone users spend 5 to 6 hours on their phones every day, which is more than 132 million people.
- Mobile Device Usage Statistics indicate that only 5% of users—a small group—use their smartphones for less than 1 hour per day.
- Meanwhile, about 7% of users spend 1 to 2 hours daily on their devices, which is equal to roughly 13.76 million to 19.27 million users.
 (Reference: demandsage.com)
- The following table shows the daily time spent on smartphones in the U.S.
| Daily Hours Spent On Smartphones | The Percentage of Smartphone Users | The Number Of Smartphone Users |
|
More than 6 hours |
18% | 49.55 million |
| 5 to 6 hours | 48% |
132.13 million |
|
3 to 4 hours |
22% | 60.56 million |
| 1 to 2 hours | 7% |
19.27 million |
|
Less than 1 hour |
5% |
13.76 million |
- In the United States, smartphones are used for approximately 70% of all digital media activity. A significant portion of this time is spent playing mobile games, which account for 94% of phone media consumption.
- Here’s how people use their smartphones for different media types:
- 94% for gaming
- 92% for social media
- 83% for watching entertainment (like videos or streaming)
- 77% for learning or education (though desktops are still more common for this)
- Government-related tasks are also mainly done on desktop computers.
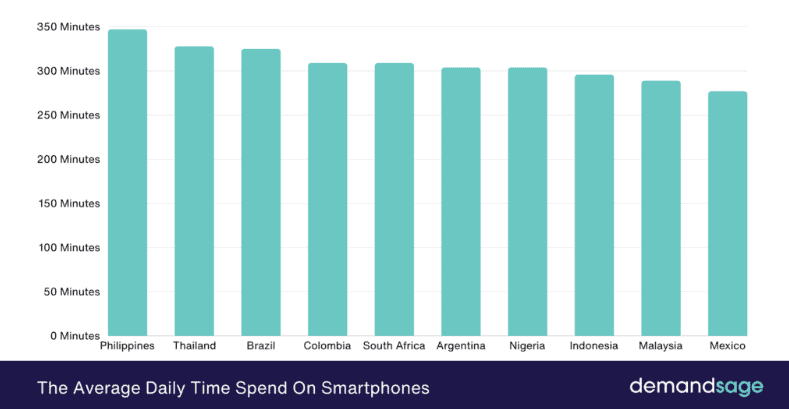
- Around the world, people spend an average of 3 hours and 43 minutes daily on their phones.
 (Source: demandsage.com)
| Top Country | The Average Daily Time Spent On Smartphones |
|
Russia |
3 hours 39 minutes |
| Romania |
3 hours 41 minutes |
|
Global Average |
3 hours 43 minutes |
| Kenya |
3 hours 51 minutes |
|
India |
4 hours 5 minutes |
| Taiwan |
4 hours 12 minutes |
|
Turkey |
4 hours 16 minutes |
| Egypt |
4 hours 25 minutes |
|
Ghana |
4 hours 34 minutes |
| The United Arab Emirates |
4 hours 35 minutes |
|
Saudi Arabia |
4 hours 35 minutes |
| Mexico |
4 hours 37 minutes |
|
Malaysia |
4 hours 49 minutes |
| Indonesia |
4 hours 56 minutes |
|
Nigeria |
5 hours 4 minutes |
| Argentina |
5 hours 4 minutes |
|
South Africa |
5 hours 9 minutes |
| Colombia |
5 hours 9 minutes |
|
Brazil |
5 hours 25 minutes |
| Thailand |
5 houses 28 minutes |
|
Philippines |
5 hours 47 minutes |
- The Philippines ranks at the top, with users spending more than 5 hours and 30 minutes on their phones daily.
- Mobile Device Usage Statistics indicate that seven countries have daily phone use exceeding 5 hours.
- Eighteen countries use their phones more than the global average of 3 hours and 43 minutes daily.
- Turkey is the only country in Europe where the average phone time is above the global average, with 4 hours and 16 minutes daily.
- 4 Southeast Asian countries are in the top 10 for the longest daily phone use.
Smartphone Device Users Statistics
 (Reference: oberlo.com)
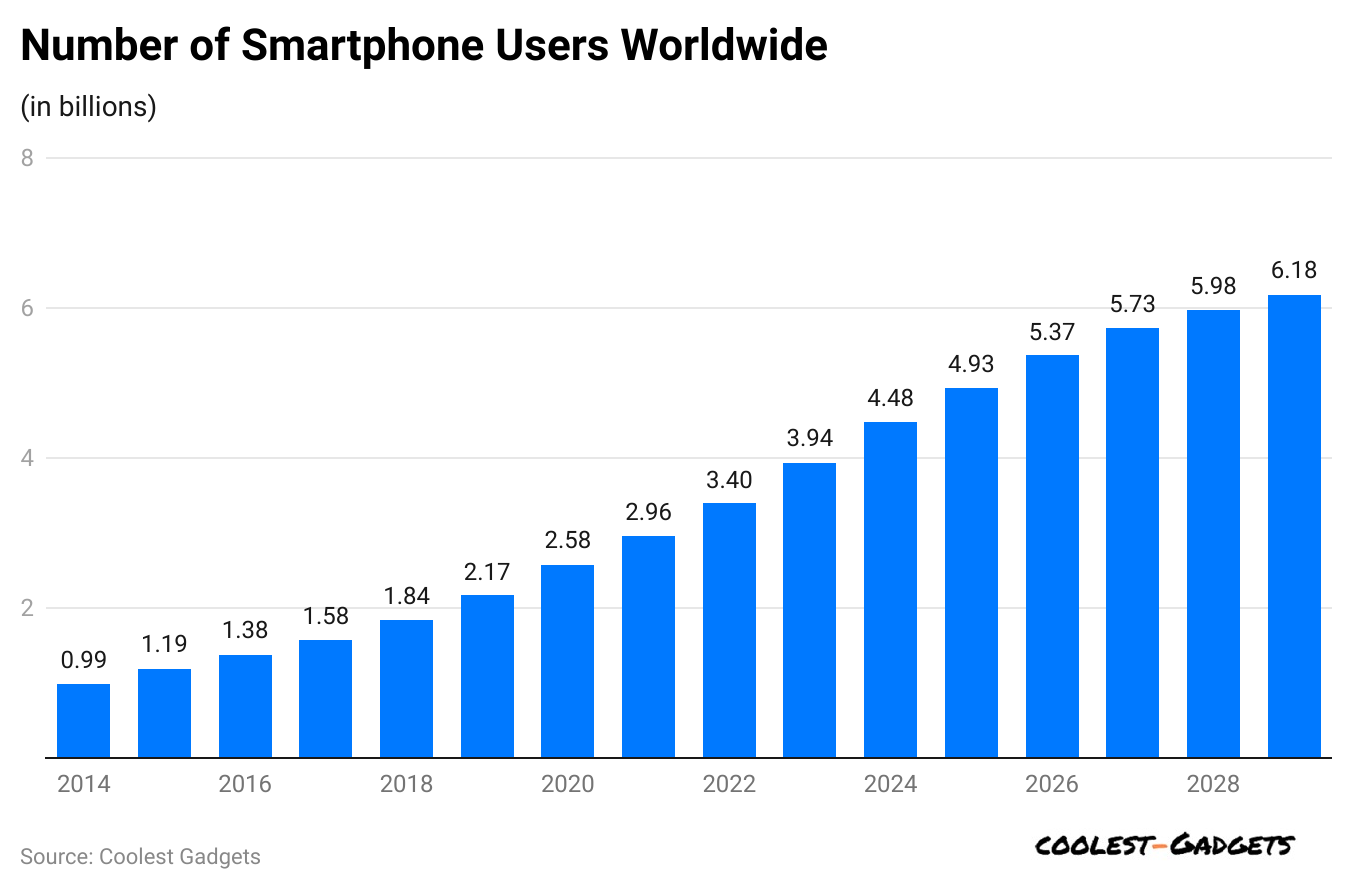
- In 2024, about 4.48 billion people worldwide owned a smartphone, showing a 13.8% jump from the previous year.
- Experts expect this number to hit 6.18 billion by 2029, meaning nearly 75% of the global population will have smartphones by then.
- The number of smartphone users worldwide is predicted to grow at an average rate of 13.1% each year between 2014 and 2029.
- Ownership rates are especially high in developed countries like the U.S., the UK, and France, where over 80% of people already use smartphones.
- The number of people using smartphones worldwide is growing every year. In 2024, approximately 4.48 billion people owned a smartphone, representing a 13.8% increase from the previous year.
- That’s 3.49 billion more users than in 2014—almost 4.5 times more in just 10 years.
- The number of smartphone users grew at an average rate of 16.3% per year from 2014 to 2024.
- The fastest growth happened in 2015, when the user count jumped 19.3%.
- Mobile Device Usage Statistics indicate that smartphones are now the most used electronic devices. Approximately 97.4% of internet users access the Internet using a smartphone.
- Experts say this trend will continue. By 2029, smartphone users are expected to reach 6.18 billion.
- With the world’s population likely to be over 8.5 billion by then, about 72.7% of people—almost 3 out of every 4—will own a smartphone.
Mobile Device Usage Demographic Statistics
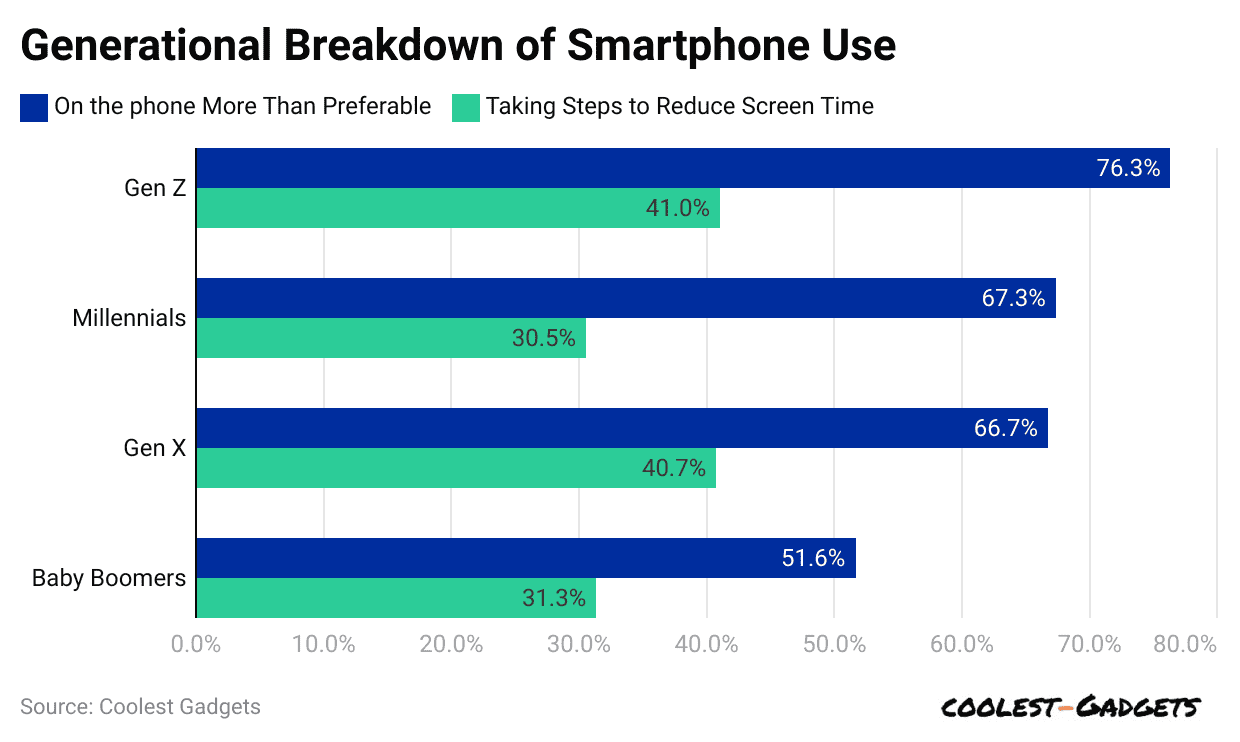
- About 75% of Gen Z say they use their smartphones more than they’d like each day. In comparison, just over 50% of Baby Boomers feel the same.
- Also, 24% of Gen Z said their phone use has become a real issue. On the bright side, 41% of Gen Z users are already reducing their screen time.
 (Reference: explodingtopics.com)
| Generation | On the Phone More Than Preferable | Taking Steps to Reduce Screen Time |
|
Gen Z |
76.3% | 41% |
| Millennials | 67.3% |
30.5% |
|
Gen X |
66.7% | 40.7% |
| Baby Boomers | 51.6% |
31.3% |
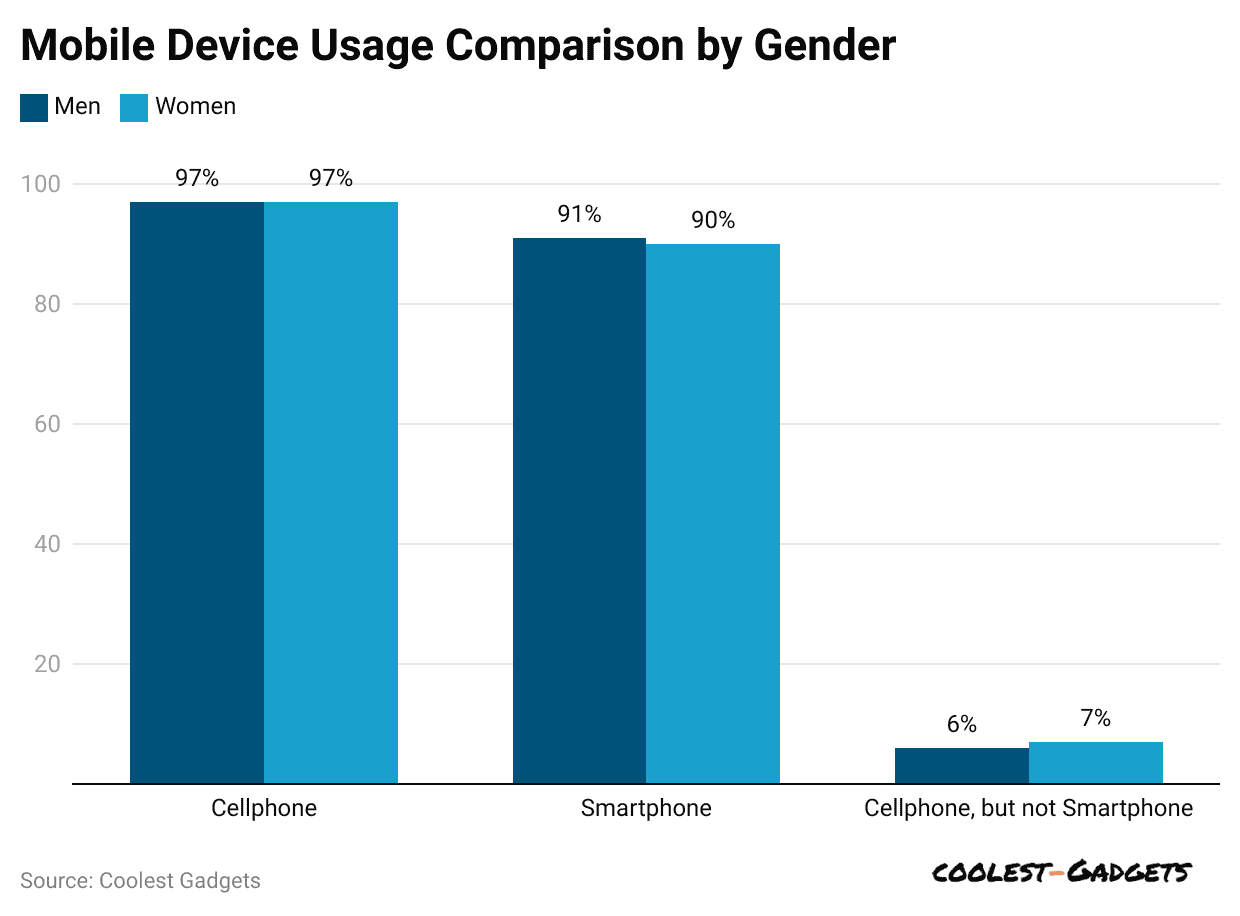
- Mobile Device Usage Statistics indicate that women are more likely than men to spend longer periods on their smartphones.
- In a survey of over 30,000 people, the average daily screen time for women was about 2 hours and 47 minutes, while for men, it was 2 hours and 34 minutes.
 (Reference: news.market.us)
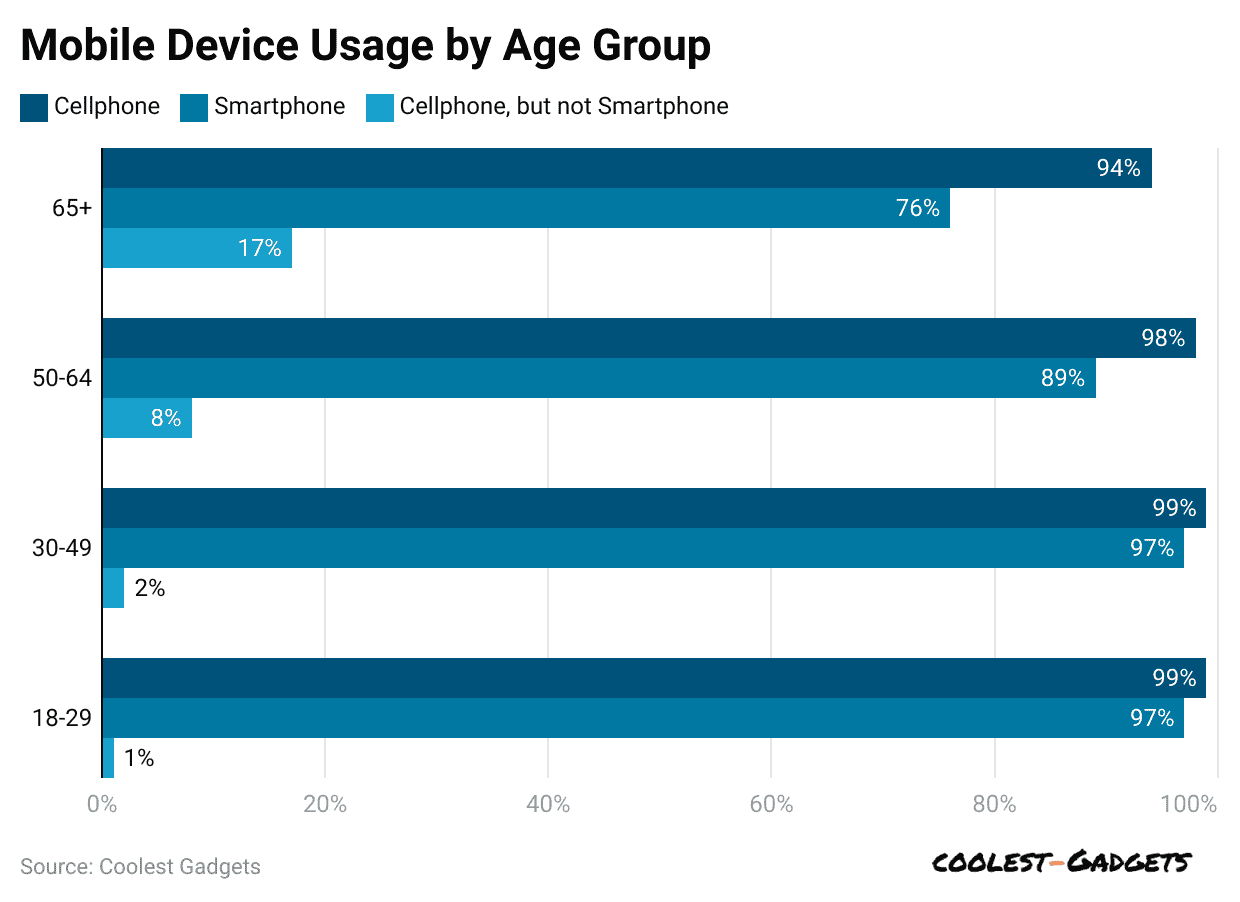
- Ages 18–29: Almost everyone (99%) in this age group owns a cell phone. Of that, 97% use smartphones, while just 1% still use basic phones without smart features.
- Ages 30–49: Like the younger group, 99% of people in this age group have cell phones, and 97% use smartphones. A small 2% still stick with regular cell phones.
- Ages 50–64: About 98% of this group own a cell phone, but only 89% use smartphones. Around 8% still rely on older, non-smart models.
- Ages 65 and older: Cellphone ownership drops a bit to 94%. Only 76% use smartphones, and 17% prefer traditional phones without smart functions.
 (Reference: news.market.us)
- In that survey, 78% of women said they use their smartphones more than their significant others.
- Although many men also said they use their phones more than their partners, a smaller share, 64%, admitted to it, compared to the 78% % of women who said the same.
Mobile E-Commerce Statistics
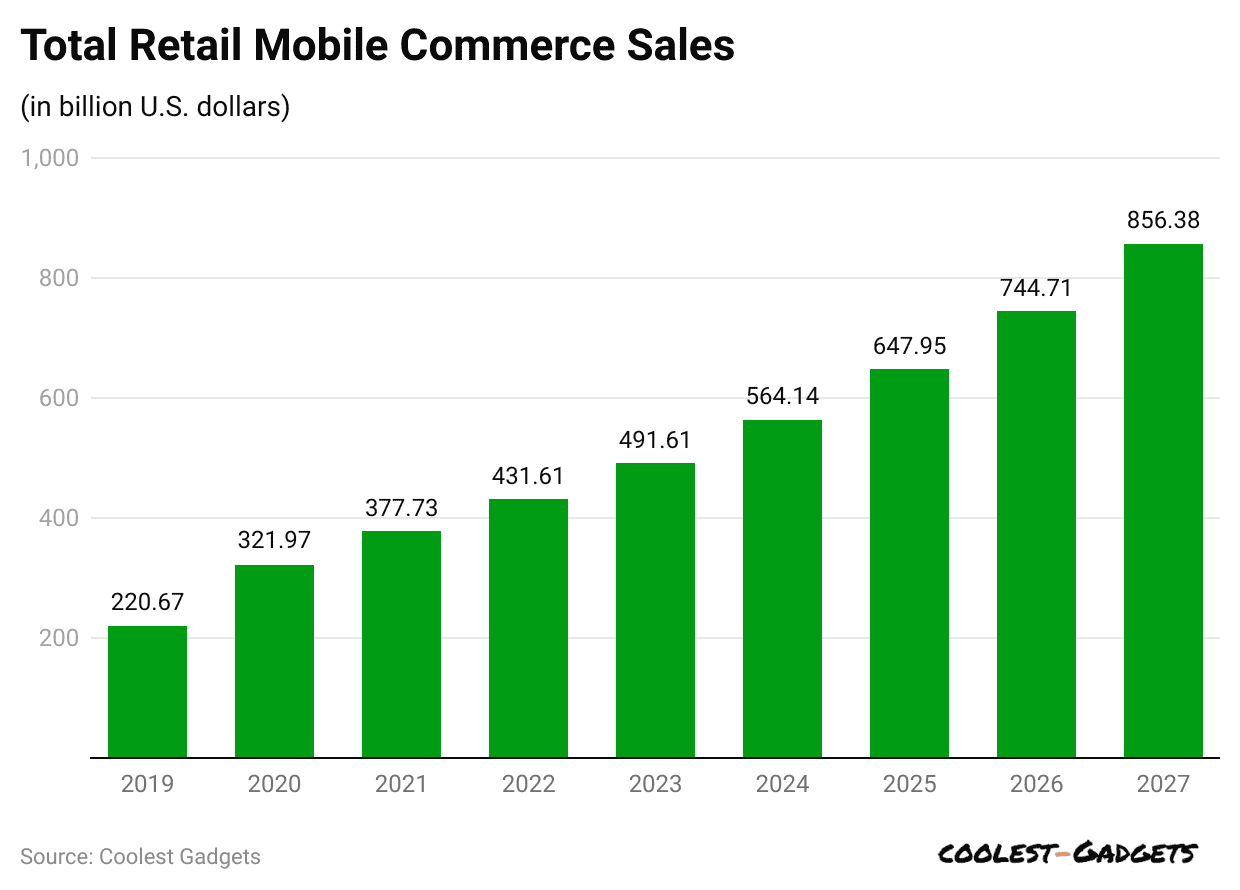
- More people are using their phones to shop online than any other device. Mobile shopping, also known as m-commerce, continues to gain popularity yearly.
- 35% of smartphone users open shopping apps a few times a week.
- Mobile Device Usage Statistics indicate that 21% use them more than once a day, and 22% use them once daily.
- Nearly 19% open them once a week, while 3% rarely use them.
- 73% of online sales now come from mobile devices.
- This number is expected to keep rising as more people rely on smartphones.
- 55% of buyers say they purchased their phones after seeing a product on social media.
 (Reference: mobiloud.com)
| Year | $USD BILLION |
|
2019 |
$220.67 |
| 2020 |
$321.97 |
|
2021 |
$377.73 |
| 2022 |
$431.61 |
|
2023 |
$491.61 |
| 2024 |
$564.14 |
|
2025 |
$647.95 |
| 2026 |
$744.71 |
|
2027 |
$856.38 |
- Businesses that use social media make 32% more sales than those that don’t.
- About 90% of users are likelier to buy from a brand they follow online.
- Holiday Sales on Phones:
- On Cyber Monday, phones accounted for 40% of the nearly $10.7 billion spent online.
- During Black Friday 2022, 48% of all online purchases were made using smartphones.
- 65% of all e-commerce traffic comes from phones.
- However, desktop computers still account for 47% of sales, while phones make up 53%.
- Almost 88% of mobile shoppers have had a bad experience at least once.
- Mobile Device Usage Statistics indicate that 51% struggled with confusing navigation.
- Around 46% said product images were too small.
- 41% worried about safety and security.
- At most, 26% didn’t like the checkout process.
- Because of these issues, 36% of shoppers left their carts without buying anything.
- Right now, there are around 167.8 million mobile shoppers in the U.S.
- This number is expected to grow to 187 million within three years—an 11% increase—even though the population only grows by about 0.4% yearly.
Mobile Ownership Over Time
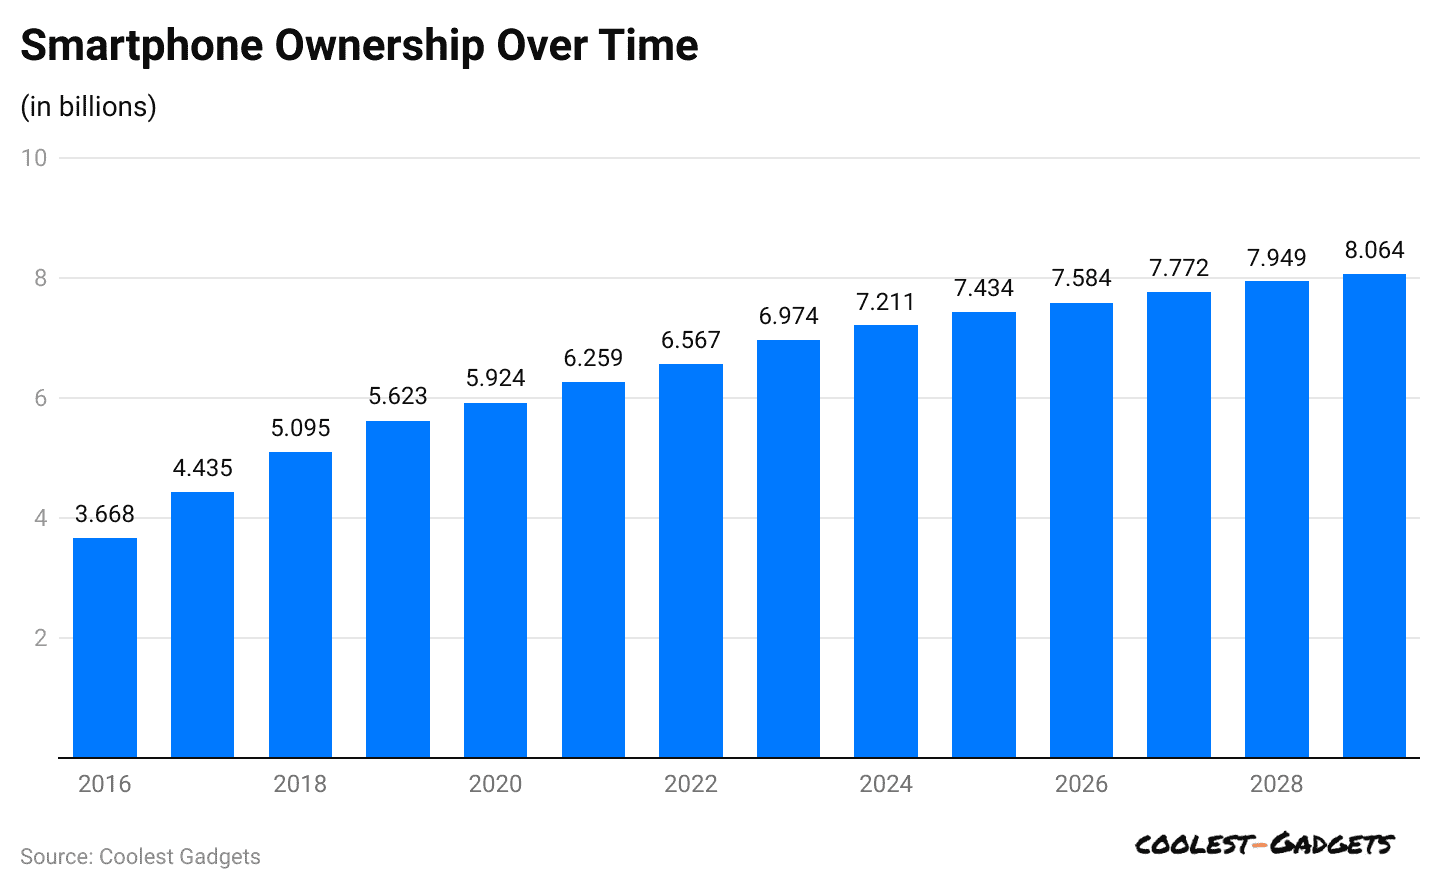
- In the last five years, the number of people using smartphones across the globe has grown a lot.
- The number of smartphone users increased by 73.88% between 2016 and 2021, showing how quickly smartphones have become a big part of everyday life.
 (Reference: explodingtopics.com)
| Year | Smartphone Users | Growth Over the Previous Year | Percentage Growth Over Previous Year |
|
2029* |
8.064 billion | + 115 million | + 1.45% |
| 2028* | 7.949 billion | + 177 million |
+ 2.28% |
|
2027* |
7.772 billion | + 188 million | + 2.48% |
| 2026* | 7.584 billion | + 150 million |
+ 2% |
|
2025* |
7.434 billion | + 223 million | + 3.09% |
| 2024* | 7.211 billion | + 247 million |
+ 3.4% |
|
2023* |
6.974 billion | + 407 million | + 6.2% |
| 2022 | 6.567 billion | + 308 million |
+ 4.92% |
|
2021 |
6.259 billion | + 335 million | + 5.65% |
| 2020 | 5.924 billion | + 301 million |
+ 5.35% |
|
2019 |
5.623 billion | + 528 million | + 10.36% |
| 2018 | 5.095 billion | + 660 million |
+ 14.88% |
|
2017 |
4.435 billion | + 767 million | + 20.91% |
| 2016 | 3.668 billion | – |
– |
- Smartphone use is expected to grow over the next 3 to 4 years.
- As of 2024, more than 7 billion smartphones were in use worldwide. Compared to basic cell phones, smartphones now make up a much larger share—and that gap will keep increasing.
- By 2025, about 72% of people using the Internet are expected to do so only through mobile devices.
- Here’s a quick look at the estimated number of smartphones around the world between 2021 and 2027:
| Year | Number of Smartphones | Number of Mobile Devices | Proportion of Smartphones |
| 2027 | 7.69 billion* | – | – |
| 2026 | 7.51 billion* | – | – |
| 2025 | 7.30 billion* | 18.22 billion* | 40.07%% |
| 2024 | 7.07 billion* | 17.72 billion* | 39.9% |
| 2023 | 6.84 billion* | 16.8 billion* | 40.71% |
| 2022 | 6.57 billion* | 15.96 billion* | 41.17% |
| 2021 | 6.37 billion | 14.91 billion | 42.7% |
Mobile Phone Addiction Statistics
 (Reference: electroiq.com)
- Mobile Device Usage Statistics indicate that 47% of parents think their kids are addicted to smartphones.
- 67% of teachers have noticed students getting distracted by phones.
- Nearly 89% of parents say they’re responsible for how their kids use phones.
- In the 18–29 age group, 22% say they check their phones every few minutes — a sign of possible phone addiction.
- 36% of millennials spend 2+ hours each workday on their phones, using them for social media, texting, gaming, and marketing messages.
- Around 41% of teens feel stressed by how many notifications they get daily.
- 85% of teens say it’s hard to stop using tech like phones or the Internet once they start.
- Mobile Device Usage Statistics indicate that 67% of teens have lost sleep from using phones or the Internet late at night.
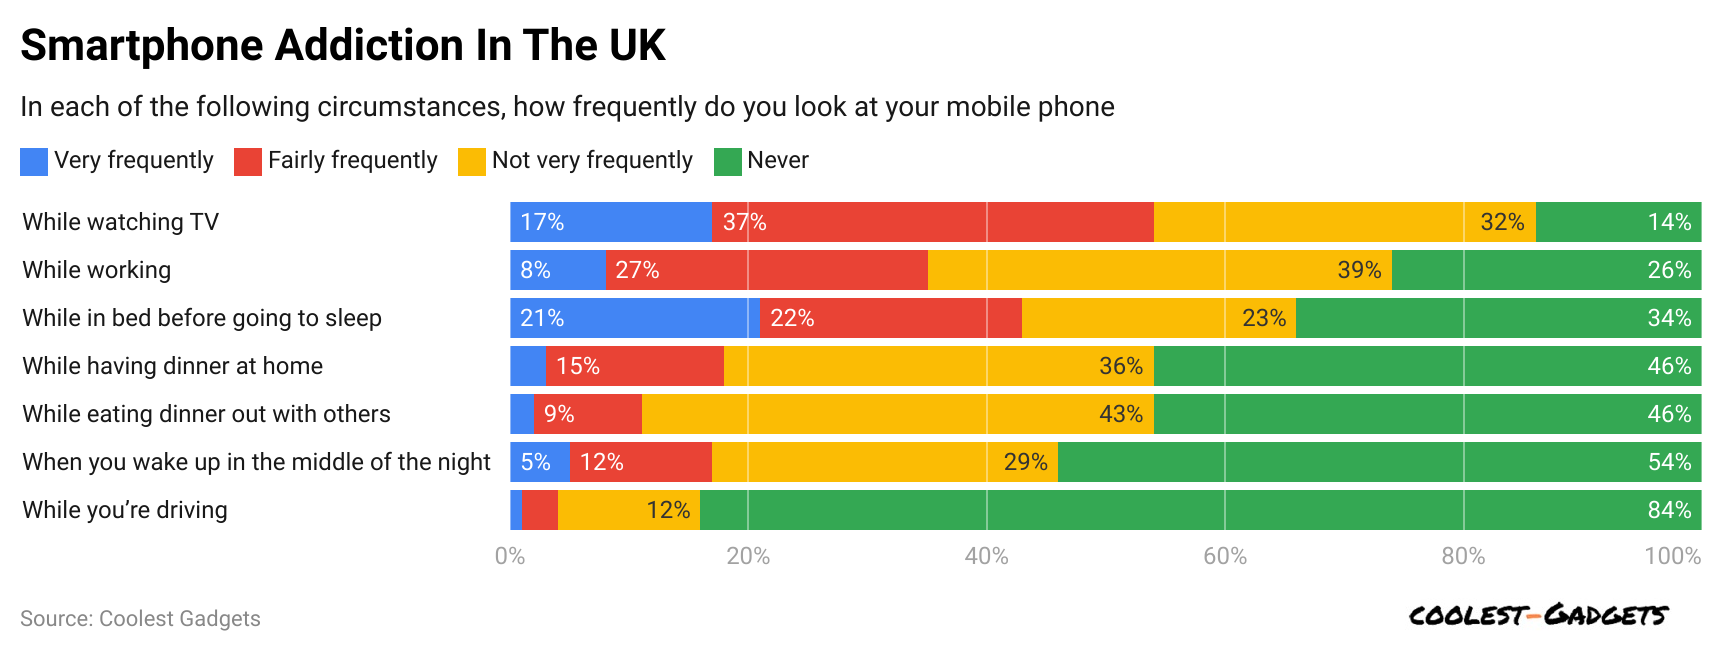
- In the UK, 46% of parents say they feel addicted to their phones.
- Almost 33% of teens say they chat more with friends online than in person.
- 52% of teens sit quietly on their phones, even when hanging out with friends.
- By 2025, 98% of American adults will own a cell phone, and most will respond to texts in minutes.
- About 15% of adults in the U.S. only use smartphones to access the Internet—they don’t have home internet.
- 70% of people feel anxious when their battery drops below 20%. This feeling is called “nomophobia,” or the fear of being disconnected. College students are hit hardest.
- In 2025, the average American will spend 5 hours and 16 minutes daily on their phone, a 14% jump from 2024.
- The typical smartphone user taps, swipes, or clicks 2,617 times daily.
- 50% of people feel uncomfortable when they forget their phones at home.
- Mobile Device Usage Statistics indicate that 26% of car accidents are linked to phone use while driving.
- 47% of Americans (ages 18–40) are worried about how their phones affect their mental well-being.
- 51% of this age group are also concerned about the effect on their physical health.
- 56% of users believe using their phones less would make their partner happier.
- Some users silence their phones to avoid distractions, but a Penn State study says this may make people check their phones even more.
- 87% of users check their phones within an hour of waking up or going to bed.
- 69% check within the first 5 minutes of waking up.
- More people worldwide own smartphones than toilets.
- 20% of people would rather go without shoes for a week than give up their smartphones.
- Nearly 40% of all users and 60% of people ages 18–34 admit to spending too much time on their phones.
- People will spend 5 years and 4 months on social media on average.
- More than 50% of phone users never turn off their devices.
- Mobile Device Usage Statistics indicate that 71% sleep with their phone next to them.
- 75% admit to texting while driving at least once.
- Nearly 75% also check their phones while using the bathroom.
- 12% of Americans and 7% of Brits even use their phones in the shower.
- Mobile Device Usage Statistics indicate that 44% check work emails during vacation.
- The average person checks their phone 63 times a day.
- In 2019, 86% of people said they looked at their phones during conversations with family or friends.
- On average, people reach for their phones 352 times every day.
Conclusion
To summarize, people worldwide are using mobile devices more than ever. Smartphone ownership continues to rise, and many people spend hours on their phones daily. These devices are now a big part of daily life, whether chatting, shopping, watching videos, or working. But this heavy use also brings some downsides, like trouble sleeping, distractions, and phone addiction.
As mobile technology grows, people must use their phones smartly, ensuring they remain helpful rather than causing problems. We have shed enough light on Mobile Device Usage Statistics through this article.
Sources
FAQ.
As of 2025, an estimated 4.69 billion people worldwide own a smartphone. That’s an increase of about 440 million users compared to 2024. Since 2022, the number of smartphone owners has jumped by 38.38%, meaning roughly 1.3 billion more people started using smartphones.
Mobile phones are used for various purposes, including communicating with family, managing business activities, and providing a means of calling for help in an emergency.
Saisuman is a talented content writer with a keen interest in mobile tech, new gadgets, law, and science. She writes articles for websites and newsletters, conducting thorough research for medical professionals. Fluent in five languages, her love for reading and languages led her to a writing career. With a Master’s in Business Administration focusing on Human Resources, Saisuman has worked in HR and with a French international company. In her free time, she enjoys traveling and singing classical songs. At Coolest Gadgets, Saisuman reviews gadgets and analyzes their statistics, making complex information easy for readers to understand.