Carbon Emission Statistics and Facts (2025)

Updated · Apr 09, 2025


TABLE OF CONTENTS
- Introduction
- Editor’s Choice
- General Carbon Emission Statistics
- Emission Monitoring System (EMS) Market Statistics
- Distribution of Carbon Emissions Statistics by Sector
- Carbon Emission Statistics by Fossil and Land Use, 2024
- Change in Carbon Emission Statistics by Fuel and Region (2023-2024)
- Carbon Emission Statistics by Region
- CO2 Per Capita Emissions by Region, 2024
- CO₂ Price Trends Statistics
- Global Heating Degree Days Analyses
- Global Cooling Degree Days Analyses
- Atmospheric Carbon Dioxide Concentration Statistics
- Countries with Net Zero Emissions Targets Worldwide by Status
- Global Carbon Budget Comparison
- Carbon Budget to Limit Global Warming 2025 by Scenario
- Future Emission Reduction Targets by Country
- CO₂ Emission Trading Contracts
- Sustainable Initiatives of Carbon Emission Statistics
- Conclusion
Introduction
Carbon Emission Statistics: Carbon emissions are a major cause of climate change. They mostly come from burning coal, oil, and gas. Cars, factories, power stations, and even homes release carbon into the air. Over time, the amount of carbon in the atmosphere has increased significantly. This leads to hotter weather, rising ocean levels, and stronger storms.
In 2023, global carbon dioxide (CO₂) emissions from fossil fuels and industry reached approximately 37.01 billion metric tons, marking a continued upward trend in greenhouse gas emissions. China remained the largest contributor, accounting for over 31% of global CO₂ emissions. The United States and India followed, emitting significant portions of the total. The power sector was the leading source, responsible for 15 billion metric tons of CO₂ equivalent emissions. These escalating emissions have elevated atmospheric CO₂ concentrations to 419.3 parts per million, a 50% increase from pre-industrial levels.
The rise in greenhouse gas emissions contributes to global warming, resulting in increased temperatures, rising sea levels, and more frequent extreme weather events. Addressing these challenges necessitates comprehensive strategies to mitigate emissions across all sectors.
Editor’s Choice
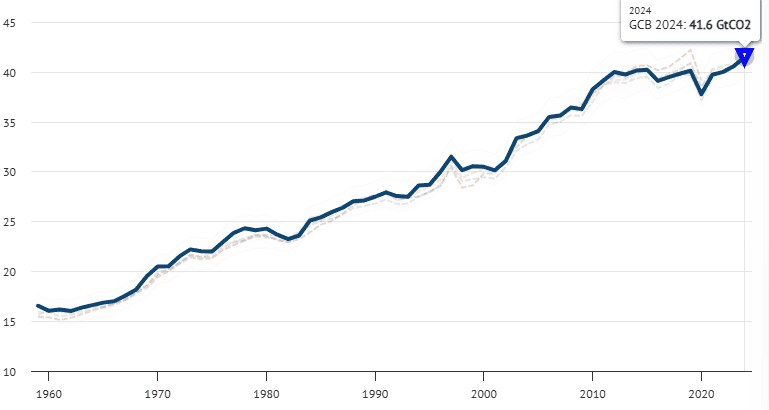 (Source: carbonbrief.org)
- The Carbon Emission Statistics 2024 show that global carbon dioxide (CO₂) emissions reached an unprecedented 41.6 Gt CO2, up from 40.6 Gt CO2 in 2023.
- The energy sector is the largest contributor to global greenhouse gas emissions, accounting for approximately 75.7%.
- Meanwhile, the global average CO₂ emissions per person stood at 4.7 tonnes in 2023.
- In 2024, U.S. energy-related CO₂ emissions increased by 0.2% compared to 2023 levels.
- Through efficiency gains, China aims to reduce CO₂ emissions in key industries by about 1% of the national total by 2023.
- In 2024, carbon dioxide emissions under the European Union’s Emissions Trading System (ETS) decreased by 5%, largely due to significant reductions in the power sector.
- Monthly mean atmospheric CO₂ concentrations reached a record high of 426.91 parts per million (ppm) in June 2024.
- Carbon Emission Statistics further stated that fossil fuel CO₂ emissions are projected to peak at about 39 gigatonnes per year by 2025 before beginning a steady annual decline.
- In 2024, the U.S. industrial sector recorded a 1.8% decline in emissions relative to 2023.
- Besides, transportation remains the highest-emitting sector in the U.S., with emissions rising by 0.8% from 2023 levels.
General Carbon Emission Statistics
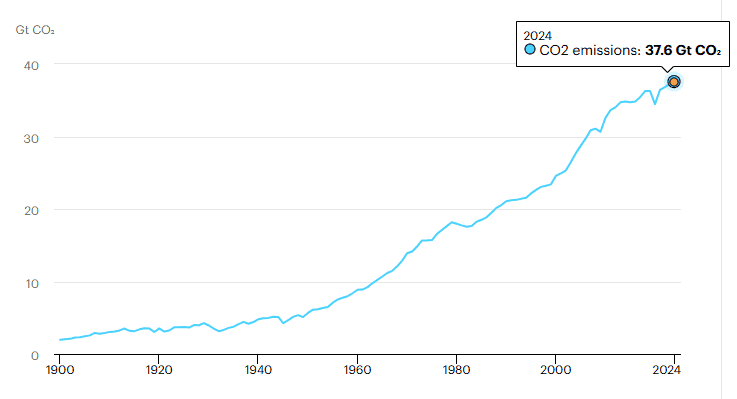 (Reference: iea.org)
- In 2024, the world used more energy and released about 0.8% more carbon than in 2023. Because of this, global CO2 emissions reached a new record of 37.8 billion tonnes.
- Because of this, the amount of CO2 in the air also reached a new high, with 422.5 parts per million.
- That’s around threeppm more than in 2023 and about 50% higher than before the industrial era began.
- Emissions from burning fuels rose by around 1%, adding about 357 million more tonnes of CO2.
- At the same time, emissions from factories producing goods dropped by 2.3%, or 62 million tonnes.
- Even though the economy grew by 3.2%, emissions didn’t rise as fast.
- In 2024, natural gas caused the biggest rise in carbon emissions, increasing by about 2.5% (180 million tons of CO₂).
- Carbon Emission Statistics further state that the global coal emissions rose by 0.9% (135 Mt CO₂) in 2024, global oil consumption rose by 0.8%, and oil-related emissions increased by only 0.3%.
- At the same time, coal caused 0.9% more carbon emissions (135 million tonnes), and people used 0.8% more oil.
- However, the carbon from oil emmision went up by 0.3%.
Emission Monitoring System (EMS) Market Statistics
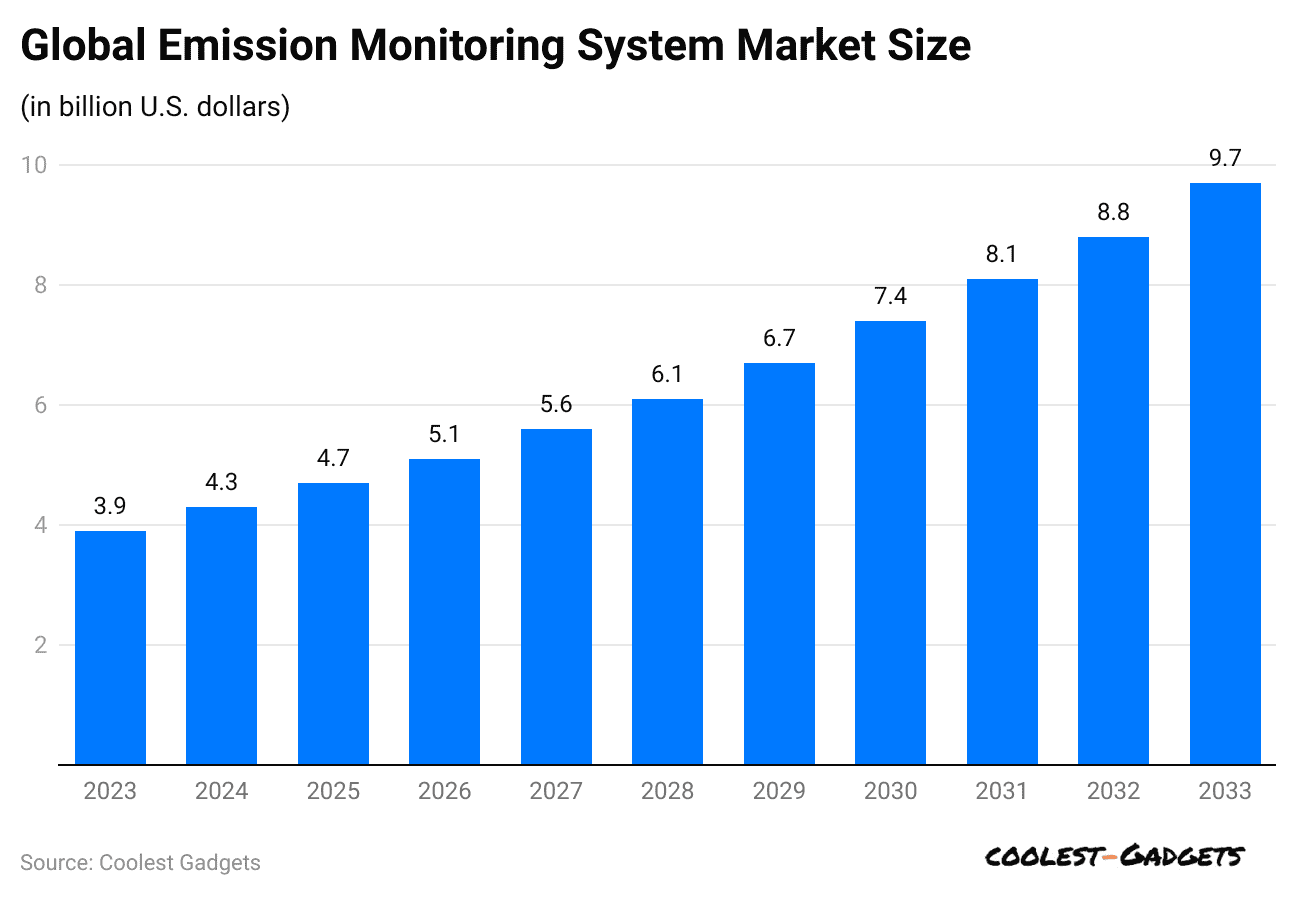 (Source: scoop.market.us)
- The global emission monitoring system market is set to grow steadily over the next ten years, with a CAGR of 9.5%.
- Carbon Emission Statistics states that the market was worth USD 3.9 billion in 2023 and is expected to rise to USD 4.3 billion by the end of 2024.
- The value may grow to USD 4.7 billion in 2025 and reach USD 5.1 billion by 2026.
- The market might grow to USD 5.6 billion in 2027 and USD 6.1 billion in 2028.
- It will likely increase to USD 6.7 billion in 2029 and USD 7.4 billion in 2030.
- This growth may continue, with the market reaching USD 8.1 billion in 2031 and USD 8.8 billion in 2032.
- By 2033, the market is expected to hit USD 9.7 billion.
Distribution of Carbon Emissions Statistics by Sector
- About 41% of CO₂ emissions come from making electricity and heat. This happens mostly when coal, oil, or gas is burned for power.
- The transport sector causes around 33% of emissions, mainly from cars, planes, and ships.
- Factories and industries create about 22% of emissions, especially from cement and steel.
- Farming, tree cutting, and land use contribute around 12% of emissions, mostly due to deforestation and soil damage.
- Homes and buildings are responsible for about 7% of emissions, mainly from heating and using energy on-site.
- About 4% of emissions come from other energy activities that don’t fit the main categories.
Carbon Emission Statistics by Fossil and Land Use, 2024
| Year | Fossil Fuel & Industry (GtCO2) | Land-Use Change (GtCO2) | Total Emission (GtCO2) |
| 2023 | 37 | 3.6 |
40.6 |
|
2024 |
37.4 | 4.2 |
41.6 |
Change in Carbon Emission Statistics by Fuel and Region (2023-2024)
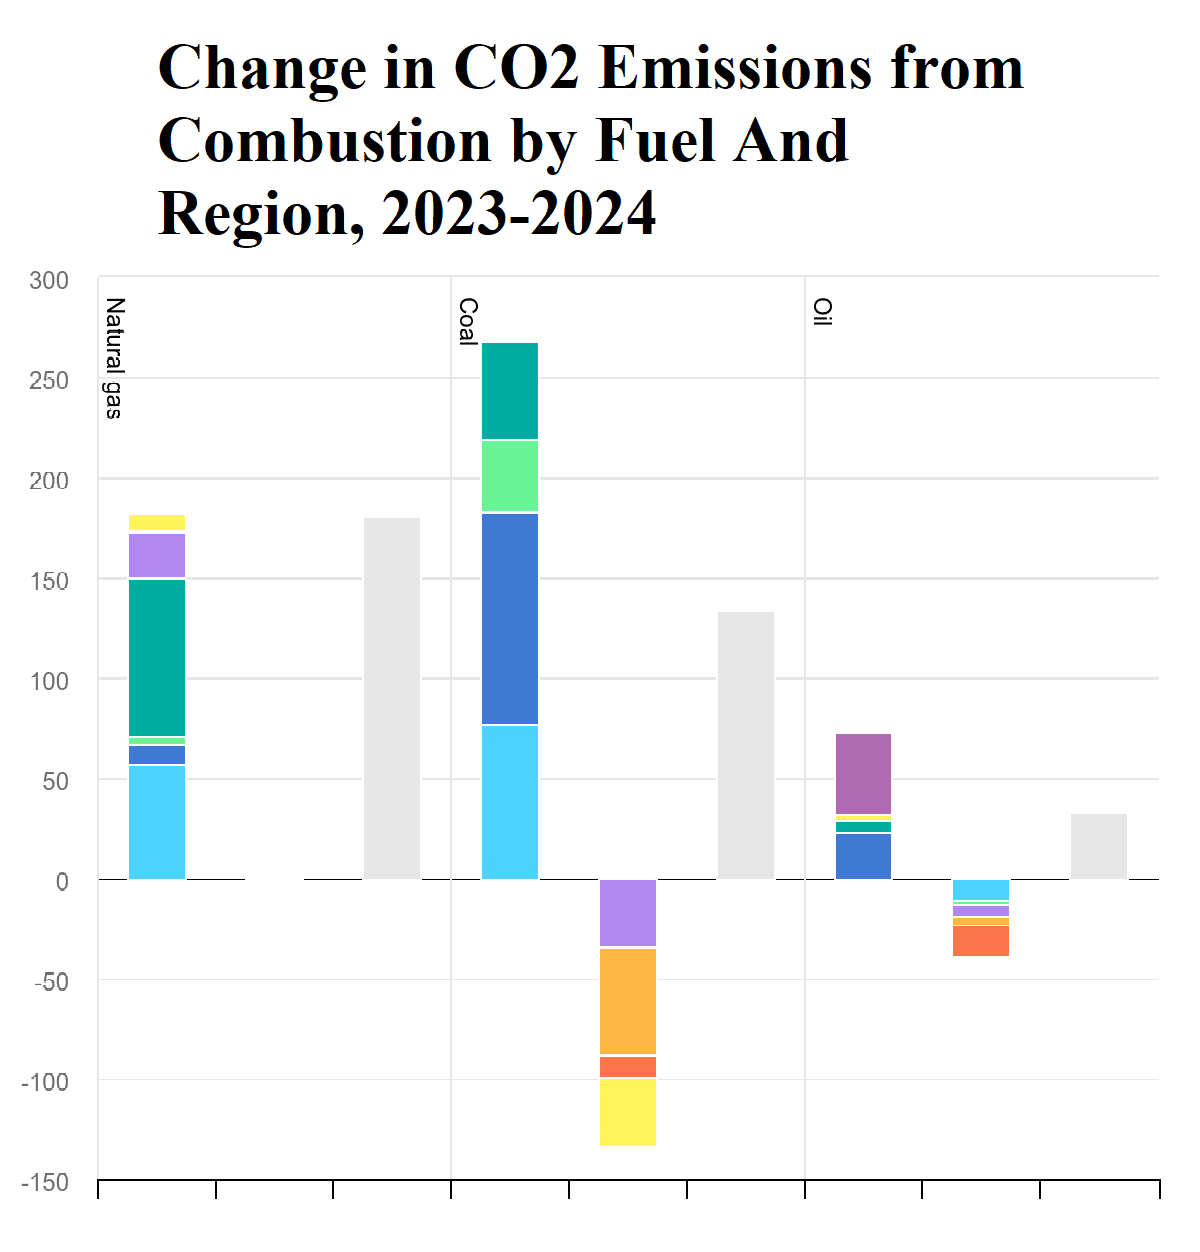 (Source: iea.org)
| Country | Natural Gas (MTCO2) | Coal (MTCO2) | Oil (MTCO2) |
| Worldwide | 181.4 | 134.2 |
33.4 |
|
China |
57.1 | 76.6 | -11.4 |
| India | 9.7 | 106.5 |
22.8 |
|
Indonesia |
4.4 | 36.2 | -1.4 |
| United States | 23.3 | -34.3 |
-6.6 |
|
European Union |
– | -53.4 | -3.6 |
| Japan | – | -11.6 |
-16.3 |
|
Rest Developing Economies |
78.6 | 48.9 | 5.9 |
| Rest Advanced Economies | 8.3 | -34.6 |
3 |
|
International Bunkers |
– | – |
41 |
Carbon Emission Statistics by Region
 (Source: iea.org)
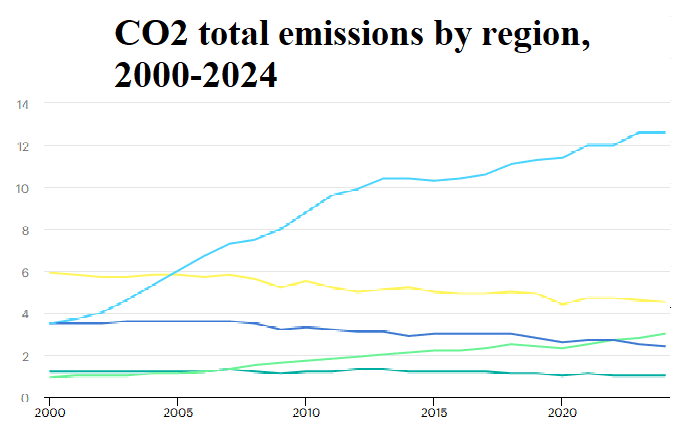
- In 2024, China released the most carbon dioxide, with 12.6 billion tons of CO2.
- The United States came next, producing 4.5 billion tonnes. India followed with 3.0 billion tonnes, while the European Union added 2.4 billion.
- Japan had the lowest, giving off 1.0 billion tonnes of CO2.
CO2 Per Capita Emissions by Region, 2024
|
Region |
CO2 Per Capita Emissions (t CO2) |
| United States |
13.4 |
|
China |
8.9 |
| Japan |
7.7 |
|
European Union |
5.4 |
| India |
2.1 |
CO₂ Price Trends Statistics
- CO2 prices kept going up in 2022, reaching USD 186.40 per ton.
- In 2023, the price climbed again to $ 195.40.
- This rising trend will continue, and the price could reach around USD 223.80 per ton in 2024.
- In 2025, there may be a small drop to USD 222.80.
- The price is predicted to climb to USD 227.70 in 2026 and then level off around USD 223.10 in 2027.
- CO2 prices could dip to USD 213.60 by the end of 2028, but a slight rebound to USD 217.00 is expected in 2029.
Global Heating Degree Days Analyses
| Months | 2023 (Days) | 2024 (Days) |
| January | 212.5 |
212.2 |
|
February |
156.2 | 161.1 |
| March | 105.3 |
111.5 |
|
April |
63.4 | 49.2 |
| May | 28.8 |
26.2 |
|
June |
11.8 | 12.2 |
| July | 9.8 |
10.1 |
|
August |
9.5 | 8.9 |
| September | 13.4 |
16.6 |
|
October |
44.4 | 49.5 |
| November | 111.1 |
103.9 |
|
December |
180.7 |
188.8 |
Global Cooling Degree Days Analyses
| Months | 2023 (Days) | 2024 (Days) |
| January | 38.6 | 45.2 |
| February | 49.3 | 56.1 |
| March | 76.1 | 89.5 |
| April | 106.7 | 127.8 |
| May | 136.2 | 156.3 |
| June | 160.3 | 171.7 |
| July | 175.7 | 178.1 |
| August | 167.7 | 167.7 |
| September | 136.0 | 138.1 |
| October | 100.6 | 102.8 |
| November | 65.1 | 61.4 |
| December | 47.7 | 44.4 |
Atmospheric Carbon Dioxide Concentration Statistics
 (Source: statista.com)
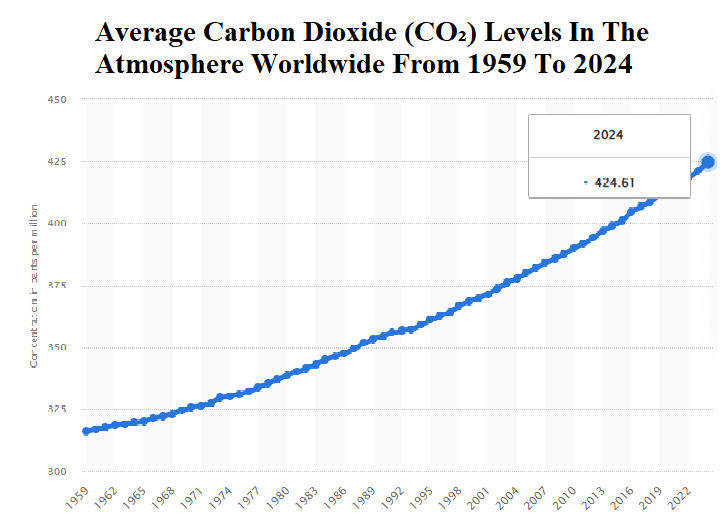
- Average annual atmospheric levels of carbon dioxide (CO₂) reached a record high of 424.61 per million (ppm) 2024.
- Moreover, in 2022 and 2023, the average CO₂ levels in the atmosphere were 418.53 ppm and 421.08 ppm, respectively.
Countries with Net Zero Emissions Targets Worldwide by Status
- According to a report published by Statista, as of November 2024, almost 147 of the world’s 198 countries had made some kind of net-zero plan.
- Out of these, 29 countries had made their targets into law.
- Similarly, carbon emission statistics show that 46 other countries had only suggested plans.
- Still, 51 countries had not set any net-zero goals at all.
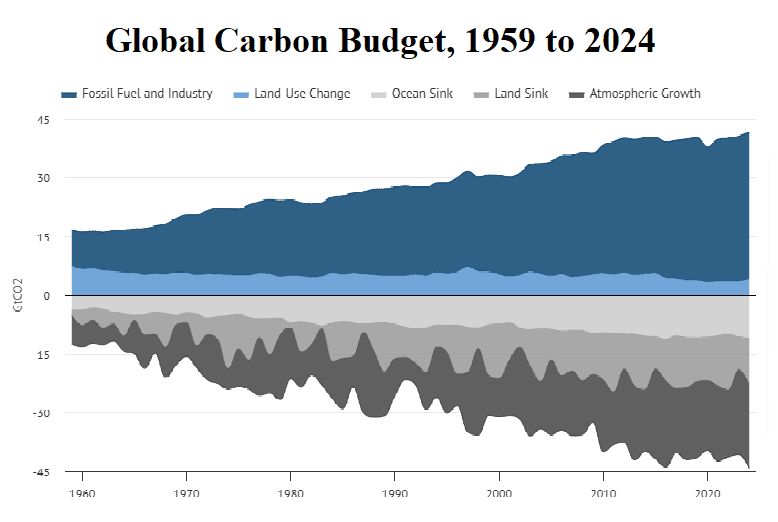
Global Carbon Budget Comparison
 (Source: carbonbrief.org)
|
Projects |
2023 (GtCO2) | 2024 (GtCO2) |
| Fossil Fuel and Industry | 37.01 |
37.40 |
|
Land-Use Change |
3.62 | 4.16 |
| Ocean Sink | -10.55 |
-10.85 |
|
Land Sink |
-8.43 | -11.87 |
| Atmospheric Growth | -21.71 |
-21.47 |
Carbon Budget to Limit Global Warming 2025 by Scenario
- If we keep polluting like now, the world can only release about 235 billion tons of CO₂ before hitting the 1.5°C limit, which might happen in 6 years.
- To keep global warming under 1.7°C, we could release up to 585 billion tons of CO₂, which would last around 14 years at today’s pace.
- For the 2°C limit, the world could release 1,110 billion tons of CO₂, but if nothing changes, that budget might run out in 27 years.
Future Emission Reduction Targets by Country
- The United States wants to cut emissions by 50–52% (compared to 2005 levels) by 2030 and reach net-zero emissions by 2050.
- China plans to let its CO₂ emissions peak by 2030, not cut them yet, and aims for net zero by 2060.
- The European Union has asked all 27 member countries to reduce greenhouse gas emissions by 55% by 2030. The long-term goal is to reach net-zero emissions by 2050.
- Australia, among the highest polluters per person, has set a target to cut its emissions by 43% compared to 2005 levels by 2030. Like the EU, Australia also aims to achieve net-zero emissions by 2050.
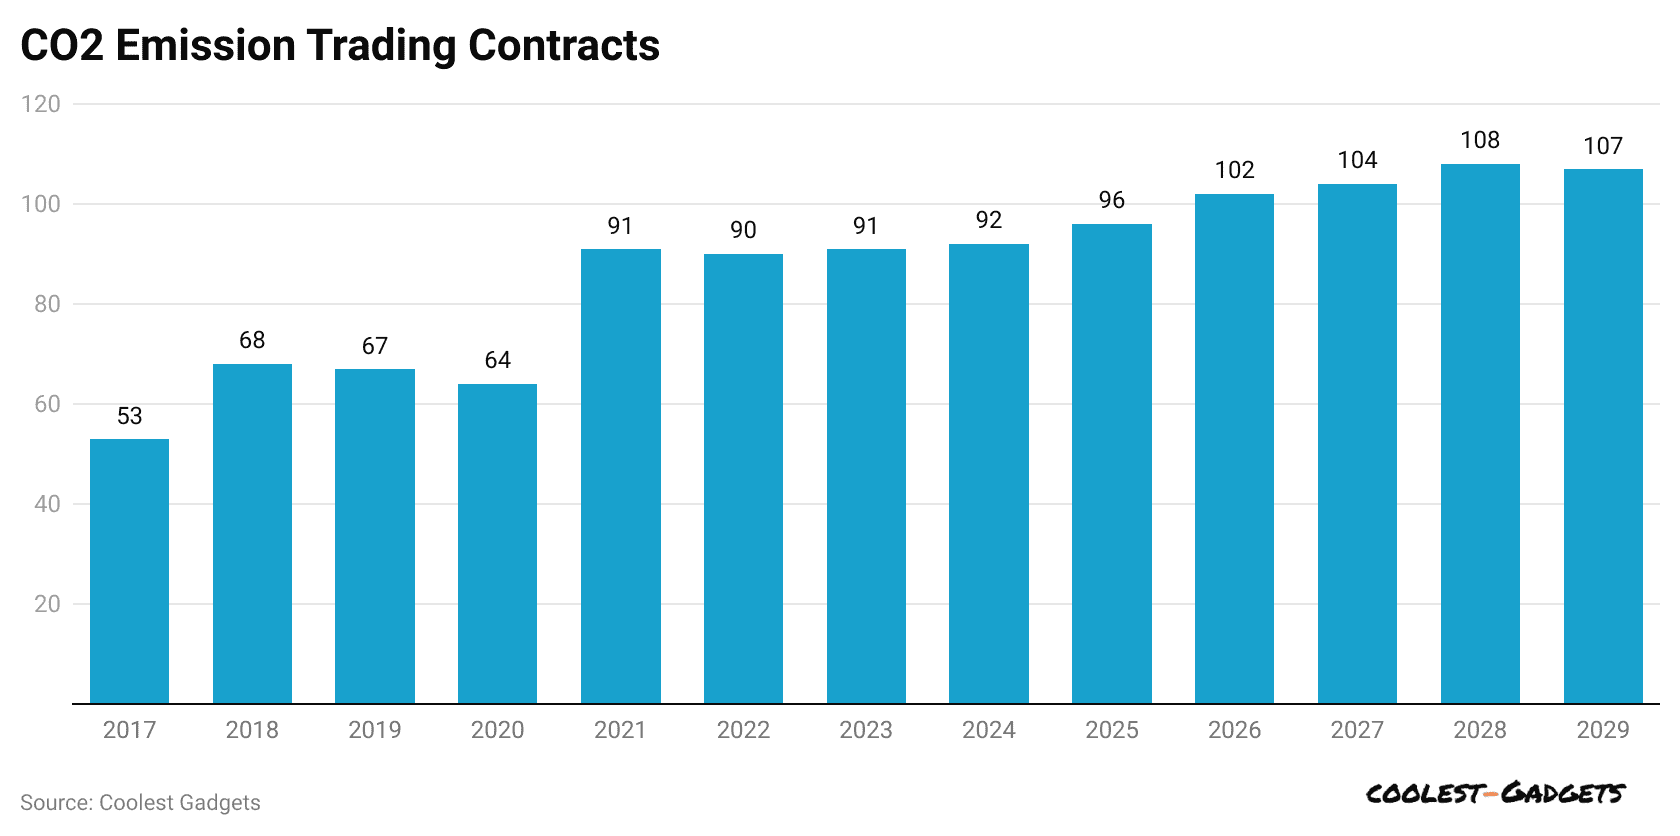
CO₂ Emission Trading Contracts
 (Reference: scoop.market.us)
- According to Carbon Emission Statistics, CO₂ emission trading contracts increased in 2022 and 2023, reaching 90 and 91, respectively.
- This steady rise is expected to carry on, with about 92 contracts predicted in 2024, 96 in 2025, and 102 in 2026.
- The growth will likely continue, reaching around 104 contracts in 2027 and 108 in 2028.
- But in 2029, a small decline is expected, bringing the number down slightly to 107 contracts.
Sustainable Initiatives of Carbon Emission Statistics
- In 2024, the European Union’s Emissions Trading System (ETS) reported a 5% drop in carbon dioxide emissions due to a 12% decrease in the power sector. This progress aligns with the EU’s goal of a 62% reduction by 2030.
- Revenues from carbon pricing mechanisms, such as taxes and emission trading systems, reached a record USD 104 billion in 2023.
- The United States saw a minimal decrease of 0.2% in greenhouse gas emissions in 2024, despite a 2.7% economic growth.
- Carbon dioxide emissions from fossil fuels hit a new high of approximately 37.4 billion tons in 2024, marking a 0.8% increase from the previous year.
- In 2024, clean energy sources supplied over 40% of global electricity demand for the first time since the 1940s, driven by significant solar and wind power growth.
- Sectors covered by the EU-ETS have reduced emissions by approximately 50% since 2005.
- An increase of USD 10 per ton in carbon taxes has been associated with a 1.3% short-term and 4.6% long-term reduction in per capita CO₂ emissions.
- In 2024, aviation emissions under the EU ETS rose by about 15%, partly due to the system’s inclusion of more international flights.
Conclusion
To sum up, carbon emissions are a big problem for our planet. Most come from cars, factories, and burning fuels like coal and oil. These emissions trap heat and make the Earth warmer, which leads to climate change.
But the good news is that we can still do something about it. We can use clean energy sources like solar or wind, drive less, and turn off lights and electronics when we don’t need them. Planting trees is also a great way to help because trees soak up carbon dioxide from the air.
Even small actions make a difference. If everyone does a little, it can add up to a lot. Let’s all take steps now to keep our planet safe and healthy for the future. The time to start is now, before things get worse.
Sources
FAQ.
Carbon emissions trap heat in the air, making Earth hotter and causing harmful weather, health, and nature problems.
Carbon emissions come from burning coal, oil, and gas in cars, factories, and power plants to make energy.
Use public transport, plant trees, save electricity, recycle waste, and choose clean energy like solar or wind power.
The greenhouse effect warms the Earth as gases trap sunlight heat, making the planet comfortable for plants, animals, and people.
Electric cars help the Earth by reducing air pollution and using cleaner energy than gas cars.
Saisuman is a talented content writer with a keen interest in mobile tech, new gadgets, law, and science. She writes articles for websites and newsletters, conducting thorough research for medical professionals. Fluent in five languages, her love for reading and languages led her to a writing career. With a Master’s in Business Administration focusing on Human Resources, Saisuman has worked in HR and with a French international company. In her free time, she enjoys traveling and singing classical songs. At Coolest Gadgets, Saisuman reviews gadgets and analyzes their statistics, making complex information easy for readers to understand.